Speed_001
Download script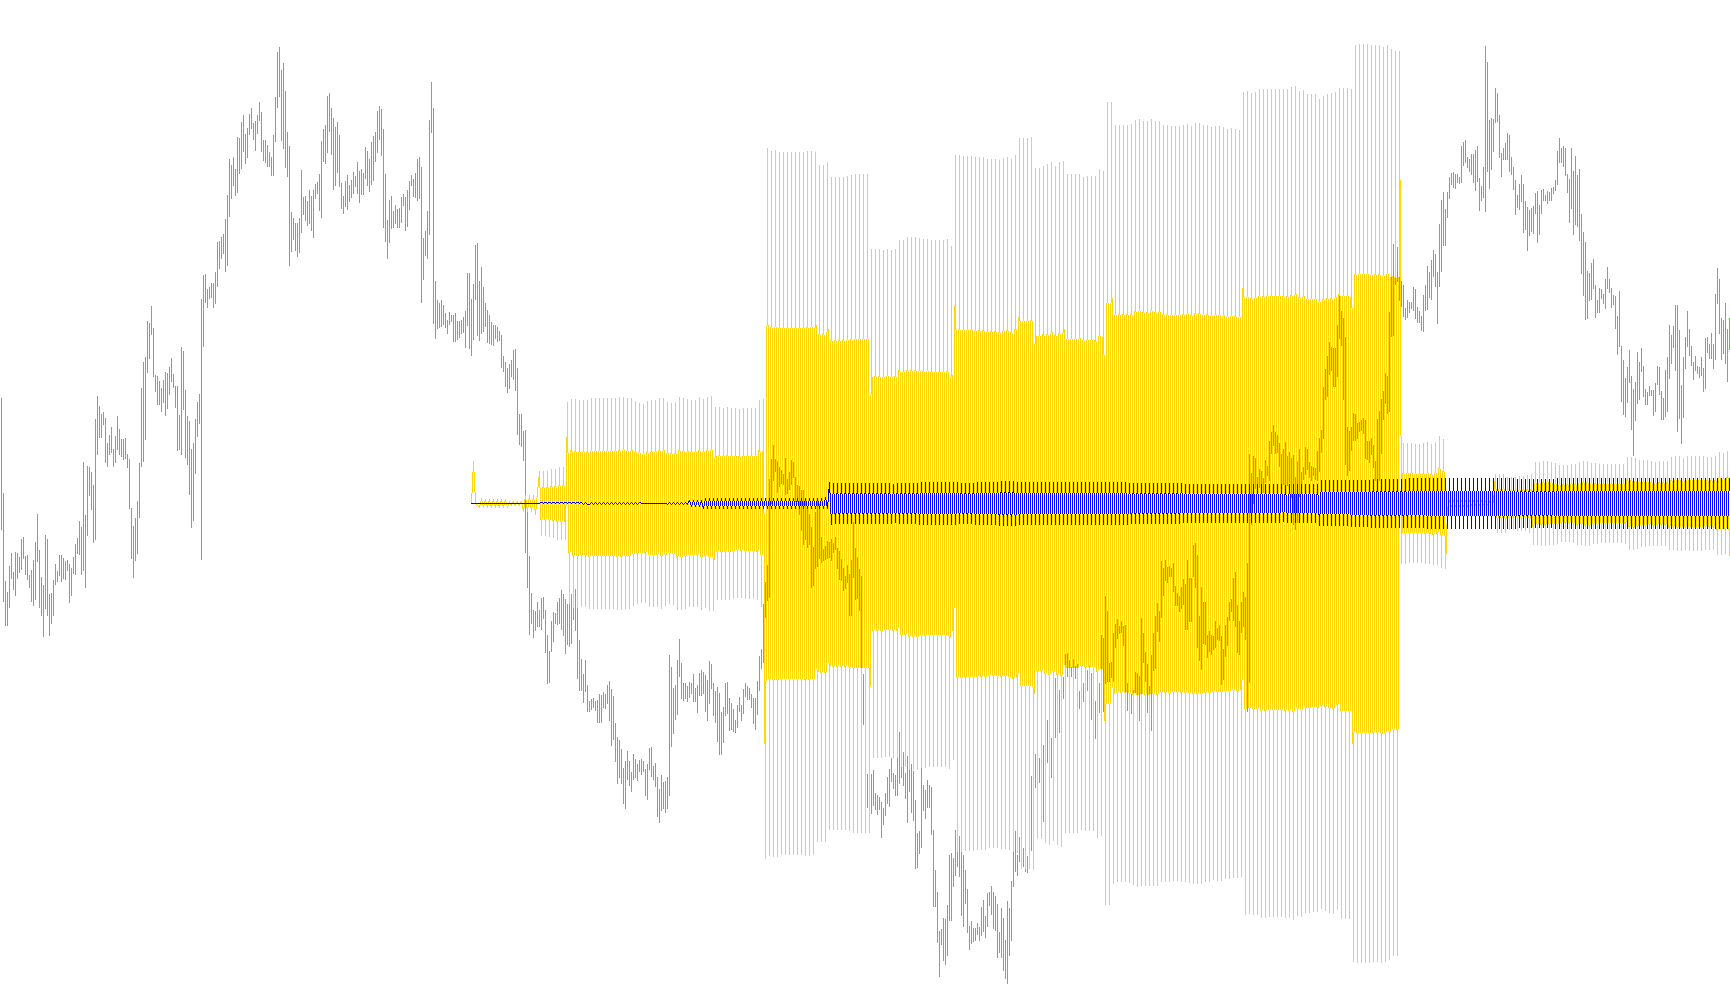
This script is a custom technical analysis indicator designed to measure and visualize market "speed" by comparing price movements against trading volume. Unlike standard indicators that only show price changes, this tool attempts to determine the intensity of those changes relative to the amount of activity occurring in the market.
Core Logic Overview
The script operates by analyzing the relationship between price fluctuations (measured in pips) and volume changes over a specific period. It focuses on identifying meaningful momentum while filtering out "noise" or insignificant market movements.
Key Functional Components
1. Multi-Point Data Analysis To calculate its values, the script looks at a window of the last six data points (bars). It calculates several averages across these points, including:
- Price Averages: The average price movement over the window.
- Volume Averages: The average trading volume over the same period.
- Median Price Points: A baseline used to normalize the current price action.
2. Movement Filtering (Thresholds) The script does not react to every tiny fluctuation in price. It uses user-defined "Pips Min" and "Pips Max" settings to act as a gatekeeper.
- If the price change between two points is too small (below the minimum) or too large (above the maximum), the indicator ignores that move.
- This ensures the resulting data only reflects significant market trends rather than minor, erratic vibrations.
3. The Speed Calculation When a price move meets the required criteria, the script calculates a "Speed" value. It does this by:
- Taking the difference in pips between two points and dividing it by the average pip movement (normalization).
- Dividing that result by the difference in volume between those same two points (relative to the average volume).
- The Result: A higher value indicates that a significant price move occurred on relatively low volume (high speed/imbalance), while a lower value suggests the move was supported by heavy volume.
4. Cumulative Tracking The script features a "Cumulative" option. When enabled, it subtracts the previous calculation from the current one. This transforms the data from a simple snapshot of current speed into a running total or trend line, making it easier to see whether market momentum is building up over time or cooling down.
Visual Representation
The logic produces three distinct lines (buffers) on a separate window below your main chart:
- Buffer 1: Uses the primary user-defined pip limits.
- Buffer 2: Uses a secondary, tighter set of pip limits to identify different types of price action.
- Buffer 3: Reserved for additional calculation layers (currently inactive in the provided logic).
Summary for Traders
Essentially, this indicator tells you how "efficiently" the market is moving. It helps identify moments where price is moving quickly with little effort from volume, which can be a sign of strong momentum or a potential exhaustion point in the current trend.
//+------------------------------------------------------------------+
//|                                                 Speed.mq4        |
//|                      Copyright © 2005, MetaQuotes Software Corp. |
//|                                       http://www.metaquotes.net/ |
//+------------------------------------------------------------------+
#property copyright "Copyright © 2005, MetaQuotes Software Corp."
#property link      "http://www.metaquotes.net/"

#property indicator_separate_window
#property indicator_buffers 3
#property indicator_color1 LightSeaGreen
#property indicator_color2 Red
#property indicator_color3 Lime

extern bool cumulat=true;
extern int pips_min=10;
extern int pips_max=300;
extern int pips_min1=10;
extern int pips_max1=20;
extern int pips_min2=10;
extern int pips_max2=30;

//---- buffers
double ExtMapBuffer1[];
double ExtMapBuffer2[];
double ExtMapBuffer3[];
//+------------------------------------------------------------------+
//| Custom indicator initialization function                         |
//+------------------------------------------------------------------+
int init()
  {
   IndicatorShortName("Speed ((C0-C1)/Cm) / ((V0-V1)/Vm)");
//---- indicators
   SetIndexStyle(0,DRAW_LINE);
   SetIndexBuffer(0,ExtMapBuffer1);
   SetIndexStyle(1,DRAW_LINE);
   SetIndexBuffer(1,ExtMapBuffer2);
   SetIndexStyle(2,DRAW_LINE);
   SetIndexBuffer(2,ExtMapBuffer3);

//----
   return(0);
  }
//+------------------------------------------------------------------+
//| Accumulation/Distribution                                        |
//+------------------------------------------------------------------+
int start()
  {
   int i,n,Bars1,counted_bars=IndicatorCounted();
   RefreshRates();
//----
   //i=0;
   //n=Bars-counted_bars-1;
   //while(i<=n)
   Bars1=Bars/2;
   i=Bars1;//Bars-counted_bars-1;
   while(i>=0)
   {
      double high0 =High[i];
      double low0  =Low[i];
      double open0 =Open[i];
      double close0=Close[i];
      double pips0=close0/Point;
      double vol0=Volume[i];

      double high1 =High[i+1];
      double low1  =Low[i+1];
      double open1 =Open[i+1];
      double close1=Close[i+1];
      double pips1=close1/Point;
      double vol1=Volume[i+1];

      double high2 =High[i+2];
      double low2  =Low[i+2];
      double open2 =Open[i+2];
      double close2=Close[i+2];
      double pips2=close2/Point;
      double vol2=Volume[i+2];

      double high3 =High[i+3];
      double low3  =Low[i+3];
      double open3 =Open[i+3];
      double close3=Close[i+3];
      double pips3=close0/Point;
      double vol3=Volume[i+3];

      double high4 =High[i+4];
      double low4  =Low[i+4];
      double open4 =Open[i+4];
      double close4=Close[i+4];
      double pips4=close1/Point;
      double vol4=Volume[i+4];

      double high5 =High[i+5];
      double low5  =Low[i+5];
      double open5 =Open[i+5];
      double close5=Close[i+5];
      double pips5=close5/Point;
      double vol5=Volume[i+5];

      double close_med = (close0+close1+close2+close3+close4+close5)/6;
      double vol_med= (vol0+vol1+vol2+vol3+vol4+vol5)/6;
      double pips_med= (pips0+pips1+pips2+pips3+pips4+pips5)/6;


      double vit1;
      if (((pips0-pips1)>pips_min) && ((pips0-pips1)<pips_max) )
      {
        vit1=((pips0-pips1)/pips_med)/((vol0-vol1)/vol_med);
        ExtMapBuffer1[i]=vit1;//(close0-close1);//vit1;  //(close-low)-(high-close);
      }
      else
        ExtMapBuffer1[i]=0;

      if (((pips0-pips1)>pips_min1) && ((pips0-pips1)<pips_max1) )
      {
        vit1=((pips0-pips1)/pips_med)/((vol0-vol1)/vol_med);
        ExtMapBuffer2[i]=vit1;//(close0-close1);//vit1;  //(close-low)-(high-close);
      }
      else
        ExtMapBuffer2[i]=0;
 /*
      if (((pips0-pips1)>pips_min2) && ((pips0-pips1)<pips_max2) )
      {
        vit1=((pips0-pips1)/pips_med)/((vol0-vol1)/vol_med);
        ExtMapBuffer3[i]=vit1;//(close0-close1);//vit1;  //(close-low)-(high-close);
      }
      else
        ExtMapBuffer3[i]=0;

 */
      double vit2=(pips1-pips2)/(vol1-vol2);
      //ExtMapBuffer1[i]=ExtMapBuffer1[i+1]+Volume[i];
      //ExtMapBuffer1[i]=vit1;  //(close-low)-(high-close);
      /*
      if(ExtMapBuffer1[i]!=0)
      {
         double diff=high-low;
         if(0==diff)
            ExtMapBuffer1[i]=0;
         else
         {
            ExtMapBuffer1[i]/=diff;
            ExtMapBuffer1[i]*=Volume[i];
         }
      }*/
      if((i<Bars1-1) && cumulat)
      {
        ExtMapBuffer1[i]-=ExtMapBuffer1[i+1];
        ExtMapBuffer2[i]-=ExtMapBuffer2[i+1];
        //ExtMapBuffer3[i]-=ExtMapBuffer3[i+1];
      }


      i--;
     }
//----
   return(0);
  }
//+------------------------------------------------------------------+
Comments