Pivot_ESAZ_Monthly
Download script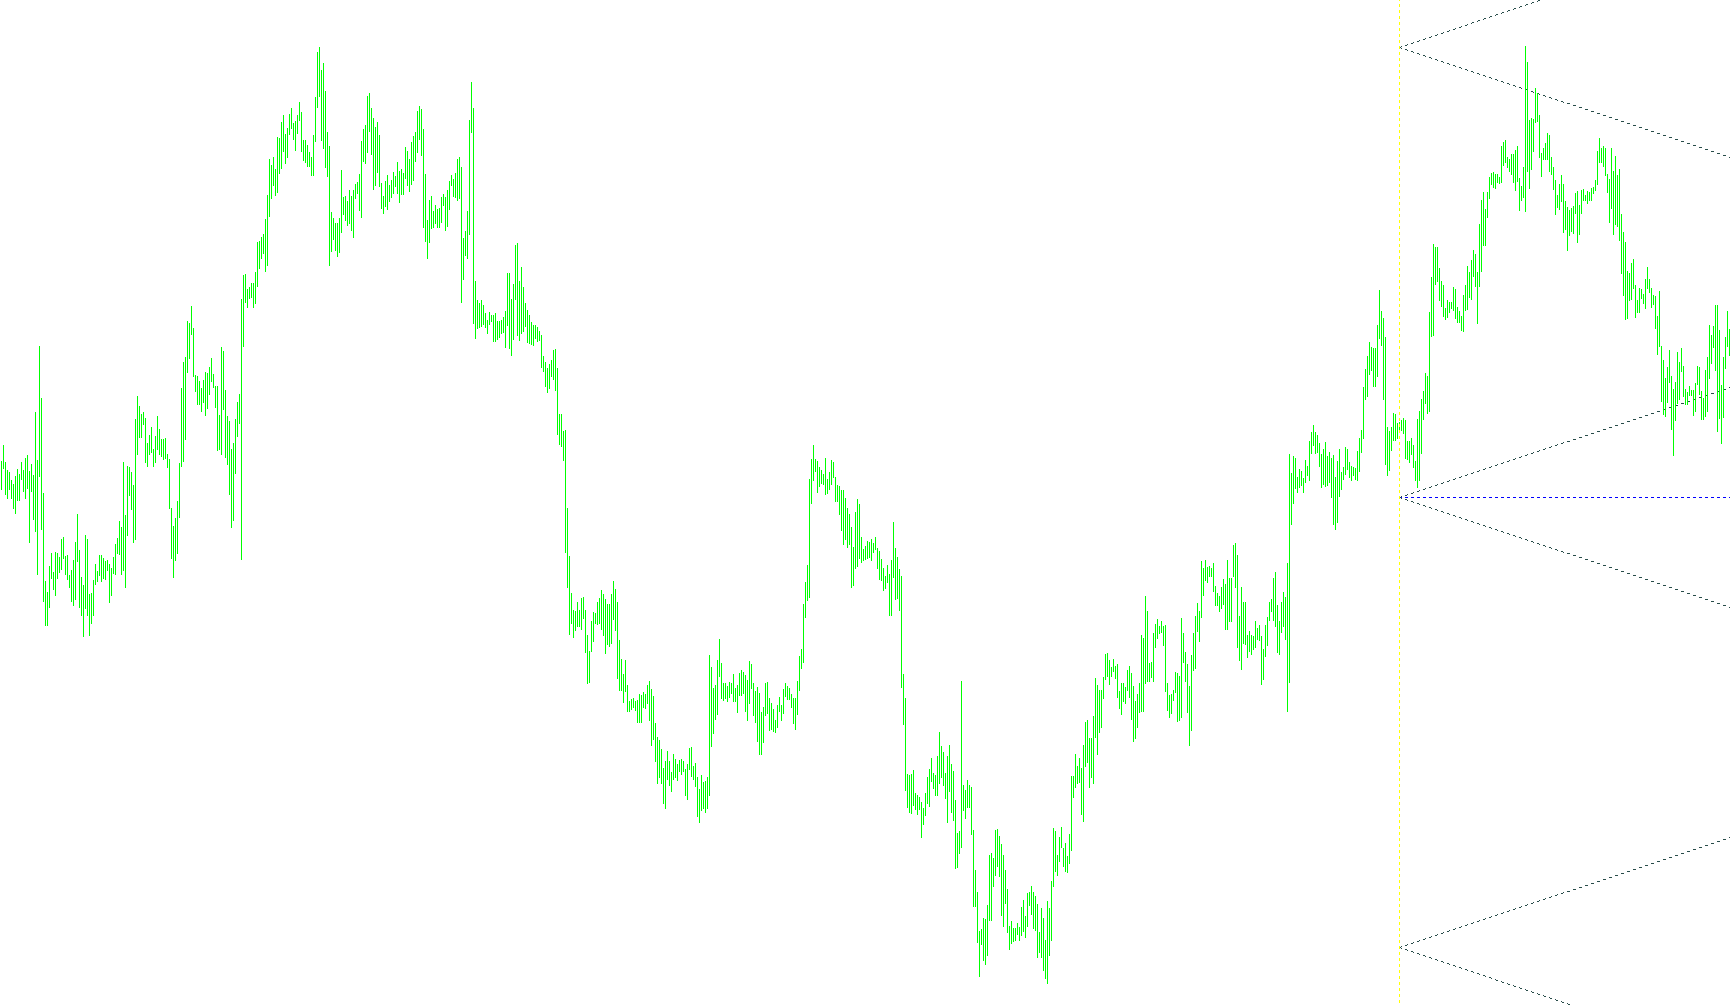
This script is a technical analysis tool designed for the MetaTrader platform to automatically calculate and display specific price levels on a chart. It primarily focuses on "Pivot Points," which are used by traders to identify potential support and resistance areas based on historical price action.
Core Functionality
The script analyzes price data from the previous month to project a roadmap of key price levels for the current period. It looks at three specific data points from the prior month: the highest price reached (High), the lowest price reached (Low), and the closing price (Close).
How the Logic Works
Based on those three values, the script performs the following calculations:
- The Pivot Point (P): It calculates a central equilibrium point by averaging the previous month's high, low, and close. This serves as the primary "anchor" for the current trading period.
- Resistance Levels (R1–R4): The script projects four upward levels. These represent areas where price might face selling pressure or struggle to move higher.
- Support Levels (S1–S4): Conversely, it projects four downward levels. These represent areas where price might find "ซื้อ" (buying) interest or struggle to drop further.
- Intermediate Levels: Beyond the primary R and S levels, the script calculates secondary "sub-levels" (Pmo lines). These provide a more granular view by breaking down the space between the main pivot and the major resistance/support zones into smaller segments.
Visual Representation
To make this data easy for a trader to read at a glance, the script automatically draws several types of visual elements on the chart:
- Horizontal Lines: It draws distinct lines for every calculated Pivot, Support, and Resistance level. Each type is assigned a specific color (such as Blue for the main pivot, Gray for upper levels, and Slate Gray for lower levels) to help with visual organization.
- Grid Zones: The script creates a series of connecting lines (GL lines) that bridge the gaps between these levels. This helps traders visualize "zones" of price action rather than just isolated numbers.
- Vertical Markers: It places vertical lines on the chart to clearly demarcate the beginning and end of the relevant time periods, ensuring the trader knows exactly which timeframe the current levels apply to.
Key Features for the User
- Automatic Cleanup: The script is designed to be tidy; it includes a routine to clear old drawings from the chart so that your screen doesn't become cluttered with outdated data.
- Customizable Periods: Users can define how many historical periods they want to see displayed at once.
- Visual Customization: The script allows for adjustments in line thickness, style, and color, allowing the user to tailor the display to their personal preference or chart theme.
//+------------------------------------------------------------------+
//|                                              Pivot_ESAZ_Week.mq4 |
//|                                                        DimDimych |
//|                            http://goodservice.su/forum/25-3550-1 |
//+------------------------------------------------------------------+
#property copyright "DimDimych"
#property link      "http://goodservice.su/forum/25-3550-1"

#property indicator_chart_window


extern int   CountPeriods  =1;

extern color pivot         =Blue;
extern color day           =Yellow;
extern color level_up      =Gray;
extern color level_dn      =SlateGray;
extern color setka         =DarkSlateGray;
extern color metka         =MidnightBlue;
extern int   LineWidth     =0;
extern int   style         =2;
extern bool  ExtSave       =false;

   datetime ny_time[];
   datetime time1;
   datetime time2;
   double open,close,high,low;
   double P,R1,R2,R3,S1,S2,S3,R4,S4;
   int shift;
//*************
void ObjDel()
{
  for (int num=0;num<=CountPeriods;num++)
  {
  ObjectDelete("PPmo["+num+"]");
  ObjectDelete("R1mo["+num+"]");
  ObjectDelete("R2mo["+num+"]");
  ObjectDelete("R3mo["+num+"]" );
  ObjectDelete("R4mo["+num+"]" );
  ObjectDelete("S1mo["+num+"]" );
  ObjectDelete("S2mo["+num+"]" );
  ObjectDelete("S3mo["+num+"]" );
  ObjectDelete("S4mo["+num+"]" );

  ObjectDelete("R1Pmo["+num+"]");
  ObjectDelete("R2Pmo["+num+"]");
  ObjectDelete("R3Pmo["+num+"]" );
  ObjectDelete("R4Pmo["+num+"]" );
  ObjectDelete("S1Pmo["+num+"]" );
  ObjectDelete("S2Pmo["+num+"]" );
  ObjectDelete("S3Pmo["+num+"]" );
  ObjectDelete("S4Pmo["+num+"]" );

  ObjectDelete("GL1mo["+num+"]");
  ObjectDelete("GL2mo["+num+"]");
  ObjectDelete("GL3mo["+num+"]");
  ObjectDelete("GL4mo["+num+"]");
  ObjectDelete("GL5mo["+num+"]");
  ObjectDelete("GL6mo["+num+"]");
  ObjectDelete("GL7mo["+num+"]");
  ObjectDelete("GL8mo["+num+"]");
  ObjectDelete("GL9mo["+num+"]");
  ObjectDelete("GL10mo["+num+"]");
  ObjectDelete("GL11mo["+num+"]");
  ObjectDelete("GL12mo["+num+"]");
  ObjectDelete("GL13mo["+num+"]");
  ObjectDelete("GL14mo["+num+"]");
  ObjectDelete("GL15mo["+num+"]");
  ObjectDelete("GL16mo["+num+"]");
  ObjectDelete("pVmo["+num+"]");
  }
  ObjectDelete("pVmo0");
}
//***************
void PlotLine(string name,double value,double value1,double line_color)
{
   double valueN=NormalizeDouble(value,Digits);
   double valueN1=NormalizeDouble(value1,Digits);
   bool res = ObjectCreate(name,OBJ_TREND,0,time1,valueN,time2,valueN1);
   ObjectSet(name, OBJPROP_WIDTH, 1);
   ObjectSet(name, OBJPROP_STYLE, style);
   ObjectSet(name, OBJPROP_RAY, false);
   ObjectSet(name, OBJPROP_BACK, true);
   ObjectSet(name, OBJPROP_COLOR, line_color);
}
//***************
void PlotVLine(string name,double tm)
{

   bool res = ObjectCreate(name,OBJ_VLINE,0,tm,0);
   ObjectSet(name, OBJPROP_WIDTH, 0);
   ObjectSet(name, OBJPROP_STYLE, 2);
   ObjectSet(name, OBJPROP_COLOR, day);
}
//***********
int init()
  {
  return(0);
  }
//***************
int deinit()
  {
   ObjDel();
   Comment("");
   return(0);
  }
//***************
int start()
  {
  int i;

  ObjDel();
    string save="";
    if(ExtSave==true)
    {
      save=TimeToStr(TimeLocal(),TIME_DATE|TIME_SECONDS);
    }
  ArrayResize(ny_time,CountPeriods+1);
  for (shift=0;shift<=CountPeriods-1;shift++)
  {
  ny_time[shift]=iTime(NULL,PERIOD_MN1,shift);

  high  = iHigh(NULL,PERIOD_MN1,shift+1);
  low   = iLow(NULL,PERIOD_MN1,shift+1);
  open  = iOpen(NULL,PERIOD_MN1,shift+1);
  close = iClose(NULL,PERIOD_MN1,shift+1);

  P  = (high+low+close)/3.0;

  R1 = P+(high-low)/2;
  R2 = P+(high-low);
  R3 = P+(high-low)+(high-low)/2;
  R4 = P+(high-low)*2;

  S1 = P-(high-low)/2;
  S2 = P-(high-low);
  S3 = P-(high-low)-(high-low)/2;
  S4 = P-(high-low)*2;
//********
  time1 = ny_time[shift];

  if (shift==0)
  {
  time2 = ny_time[shift] + PERIOD_MN1*60 ;
  PlotVLine("pVmo0"+save,time2);
  }
  else
  time2 = ny_time[shift-1];
//********
   PlotVLine("pVmo["+shift+"]"+save,time1);

   PlotLine("PPmo["+shift+"]"+save,P ,P, pivot);

   PlotLine("R1mo["+shift+"]"+save,R1,R1,level_up);
   PlotLine("R2mo["+shift+"]"+save,R2,R2,level_up);
   PlotLine("R3mo["+shift+"]"+save,R3,R3,level_up);
   PlotLine("R4mo["+shift+"]"+save,R4,R4,level_up);

   PlotLine("R1Pmo["+shift+"]"+save,P+(R1-P)/2,   P+(R1-P)/2,level_up);
   PlotLine("R2Pmo["+shift+"]"+save,R1+(R2-R1)/2,R1+(R2-R1)/2,level_up);
   PlotLine("R3Pmo["+shift+"]"+save,R2+(R3-R2)/2,R2+(R3-R2)/2,level_up);
   PlotLine("R4Pmo["+shift+"]"+save,R3+(R4-R3)/2,R3+(R4-R3)/2,level_up);

   PlotLine("S1mo["+shift+"]"+save,S1,S1,level_dn);
   PlotLine("S2mo["+shift+"]"+save,S2 ,S2,level_dn);
   PlotLine("S3mo["+shift+"]"+save,S3 ,S3,level_dn);
   PlotLine("S4mo["+shift+"]"+save,S4,S4,level_dn);

   PlotLine("S1Pmo["+shift+"]"+save,P- (P-S1)/2,  P-(P-S1)/2,level_dn);
   PlotLine("S2Pmo["+shift+"]"+save,S1-(S1-S2)/2,S1-(S1-S2)/2,level_dn);
   PlotLine("S3Pmo["+shift+"]"+save,S2-(S2-S3)/2,S2-(S2-S3)/2,level_dn);
   PlotLine("S4Pmo["+shift+"]"+save,S3-(S3-S4)/2,S3-(S3-S4)/2,level_dn);
//**************
   PlotLine("GL1mo["+shift+"]"+save,P, R1,setka);
   PlotLine("GL2mo["+shift+"]"+save,R1,R2,setka);
   PlotLine("GL3mo["+shift+"]"+save,R2,R3,setka);
   PlotLine("GL4mo["+shift+"]"+save,R3,R4,setka);

   PlotLine("GL5mo["+shift+"]"+save,R1, P,setka);
   PlotLine("GL6mo["+shift+"]"+save,R2, R1,setka);
   PlotLine("GL7mo["+shift+"]"+save,R3, R2,setka);
   PlotLine("GL8mo["+shift+"]"+save,R4, R3,setka);

   PlotLine("GL9mo["+shift+"]"+save, P, S1,setka);
   PlotLine("GL10mo["+shift+"]"+save,S1,S2,setka);
   PlotLine("GL11mo["+shift+"]"+save,S2,S3,setka);
   PlotLine("GL12mo["+shift+"]"+save,S3,S4,setka);

   PlotLine("GL13mo["+shift+"]"+save,S1, P,setka);
   PlotLine("GL14mo["+shift+"]"+save,S2, S1,setka);
   PlotLine("GL15mo["+shift+"]"+save,S3, S2,setka);
   PlotLine("GL16mo["+shift+"]"+save,S4, S3,setka);
  }
   return(0);
  }
//+------------------------------------------------------------------+
Comments