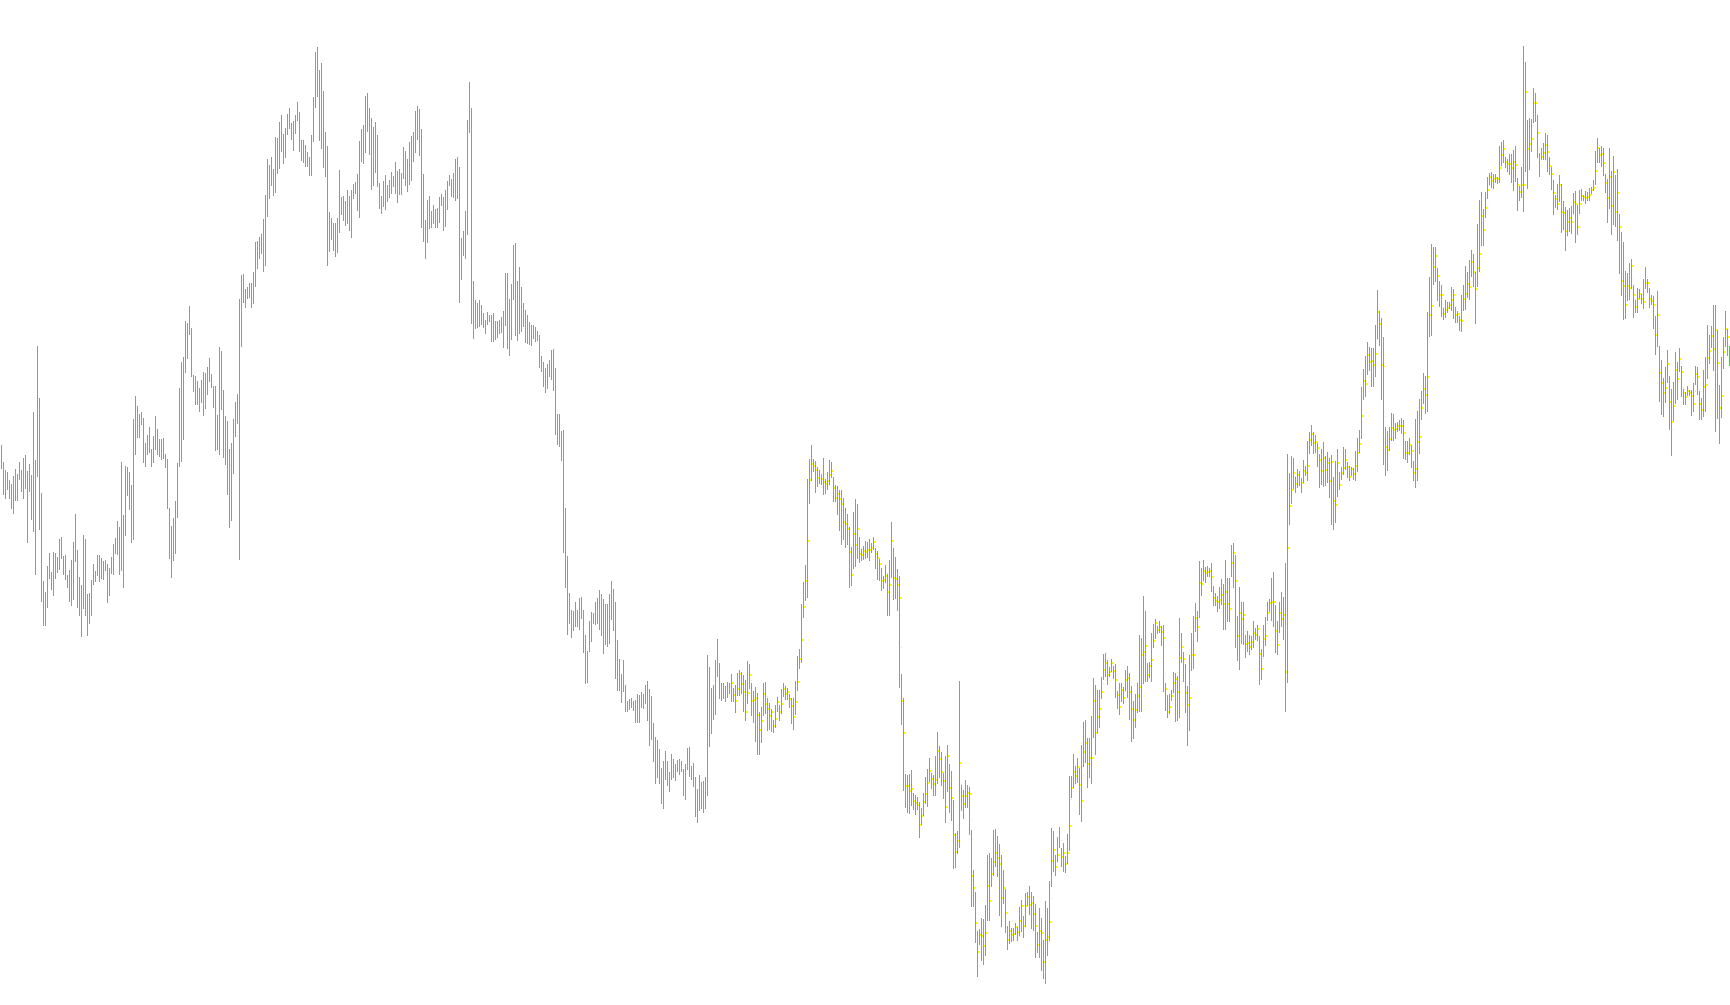
This tool is designed to provide traders with a clear visual representation of "Pivot Points" on a currency or asset chart. In trading, pivot points are used to identify potential areas of support and resistance, helping users understand where the market might change direction or consolidate.
Core Functionality
The script focuses specifically on the 30-minute timeframe (M30). It automatically scans historical data to calculate specific price levels based on the previous periods' activity. Instead of showing every possible movement, it highlights a key "Pivot" value for each 30-minute block over a customizable period of time.
How the Logic Works
- Data Collection: The tool looks back at the previous 30-minute candle to gather three critical pieces of information: the highest price reached (High), the lowest price hit (Low), and the final price at which it closed (Close).
- The Calculation: It uses a standard mathematical formula to determine the Pivot Point. It takes the average of those three values—adding the High, Low, and Close together and dividing by three. This resulting number represents the "equilibrium" price for that specific timeframe.
- Visual Mapping: Once the calculation is complete, the script draws a horizontal line on your chart at that exact price level. These lines are colored yellow and styled to be visible but not distracting (placed in the background), allowing you to see historical price levels clearly.
- Historical Depth: You can customize how far back the tool looks. By default, it is set to track a significant amount of history, allowing you to see a long trail of past pivot points to identify recurring patterns or "zones" where the market has historically struggled to move past.
User Experience
When you apply this script, it cleans up your chart by automatically managing the lines. It ensures that the visual data is updated correctly so that you can focus on identifying trends. By providing these "anchor points," the tool helps take the guesswork out of finding support and resistance levels, providing a structured map of the market's previous price behavior.
//+------------------------------------------------------------------+
//|                                                   Pivot_only_M30.mq4 |
//|                                                   upgrade by Darkkiller |
//|                      Copyright © 2006, MetaQuotes Software Corp. |
//|                                        http://www.metaquotes.net |
//+------------------------------------------------------------------+
//+------------------------------------------------------------------+
//|                                                 AllPivots_v1.mq4 |
//|                                  Copyright © 2006, Forex-TSD.com |
//|                         Written by IgorAD,igorad2003@yahoo.co.uk |
//|            http://finance.groups.yahoo.com/group/TrendLaboratory |
//+------------------------------------------------------------------+
#property copyright "Copyright © 2006, Forex-TSD.com "
#property link      "http://www.forex-tsd.com/"

#property indicator_chart_window

extern int  CountDays=1000;


   datetime time1;
   datetime time2;
   double open,close,high,low;
   double P;

   int shift, num;

   void ObjDel()
   {
      for (;num<=CountDays;num++)
      {
      ObjectDelete("Pivot M30["+num+"]");

      }
   }

   void PlotLine(string name,double value,double line_color,double style)
   {
   ObjectCreate(name,OBJ_TREND,0,time1,value,time2,value);
   ObjectSet(name, OBJPROP_WIDTH, 2);
   ObjectSet(name, OBJPROP_STYLE, style);
   ObjectSet(name, OBJPROP_RAY, false);
   ObjectSet(name, OBJPROP_BACK, true);
   ObjectSet(name, OBJPROP_COLOR, line_color);
    }
int init()
  {

  return(0);
  }


int deinit()
  {
   ObjDel();
   Comment("");
   return(0);
  }

int start()
  {
  int i;

  ObjDel();
  num=0;

  for (shift=CountDays-1;shift>=0;shift--)
  {
  time1=iTime(NULL,PERIOD_M30,shift);
  i=shift-1;
  if (i<0)
  time2=Time[0];
  else
  time2=iTime(NULL,PERIOD_M30,i)-Period()*60;

  high  = iHigh(NULL,PERIOD_M30,shift+1);
  low   = iLow(NULL,PERIOD_M30,shift+1);
  close = iClose(NULL,PERIOD_M30,shift+1);

  P  = (high+low+close)/3.0;


  time2=time1+PERIOD_M30*60;


  num=shift;

  PlotLine("Pivot M30["+num+"]",P,Yellow,0);

  }
   return(0);
  }
//+------------------------------------------------------------------+
Comments