Pivot_Scalper
Download script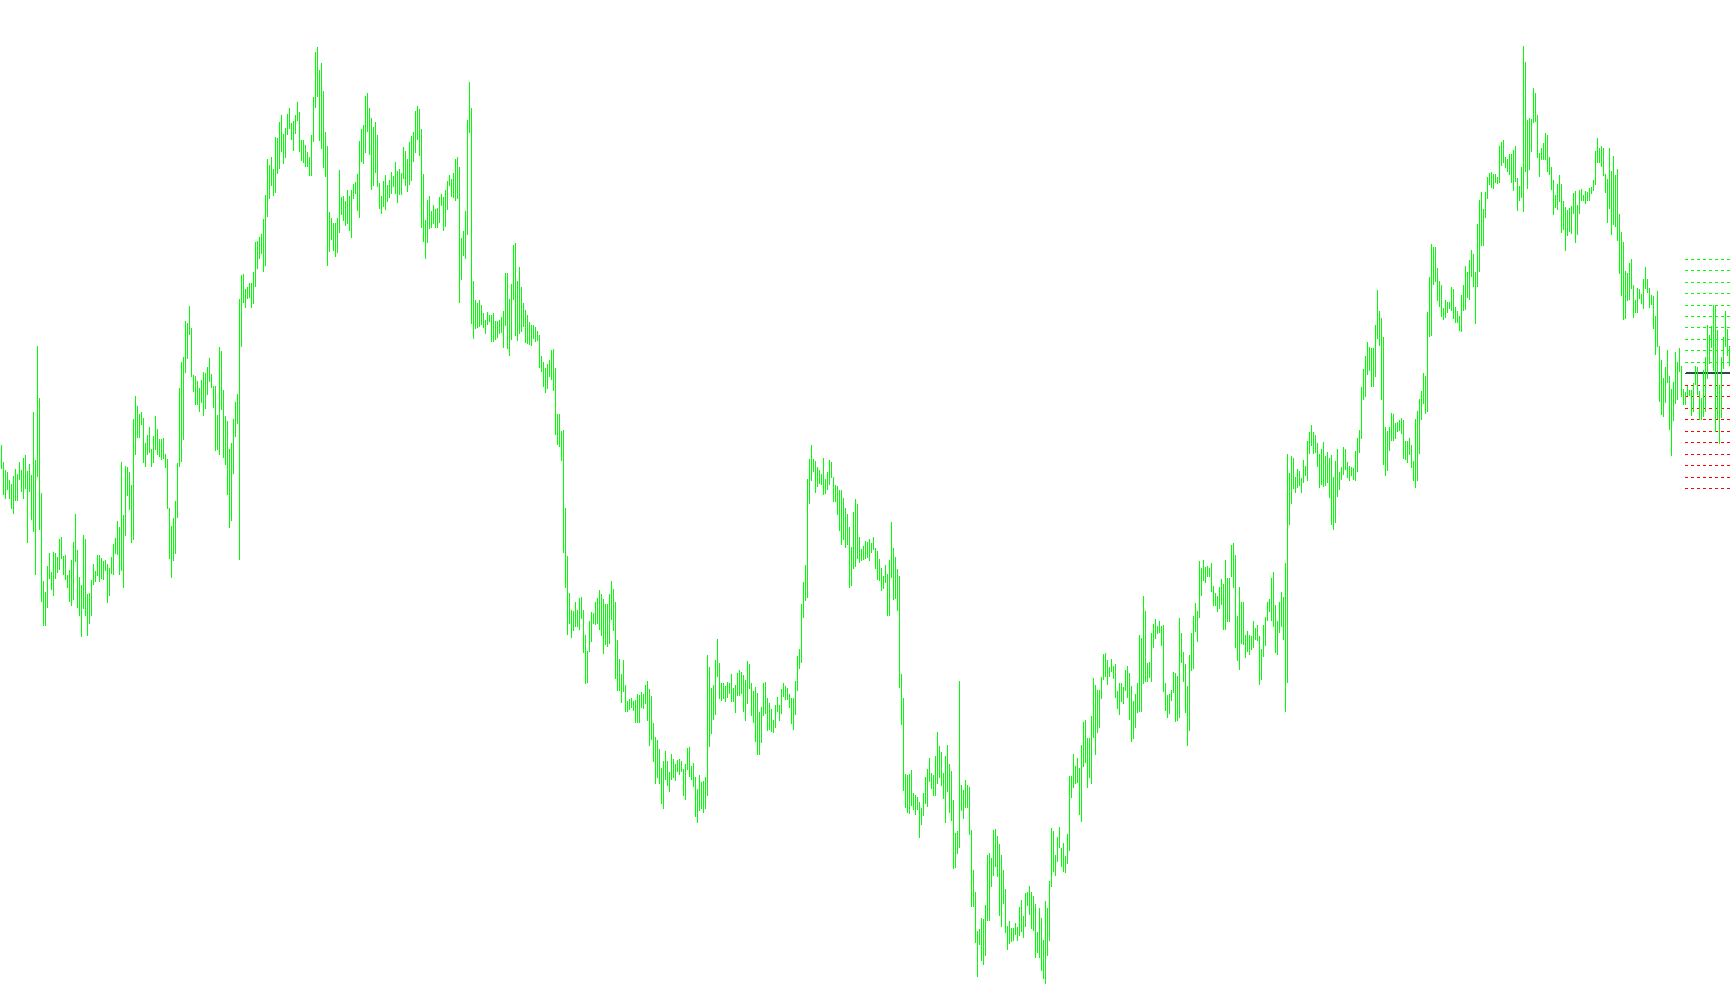
This tool is a specialized visual indicator designed for the MetaTrader 4 platform to assist traders in identifying key price levels based on daily "Pivot Points." It simplifies complex market data into a clear, multi-layered grid of horizontal levels that can help identify potential areas of support and resistance.
Core Logic Overview
The script operates by analyzing the high, low, and closing prices from the previous daily candle. Using these three data points, it calculates a central "Pivot" price. From this center point, the script automatically projects a series of symmetrical price levels both above and below the midpoint.
Key Features and Functionality
- Dynamic Level Generation: The indicator does not just show one level; it creates a comprehensive grid. It calculates 9 distinct layers of upper and lower levels. Each subsequent layer is spaced out proportionally, providing a "map" of where price might react or stall.
- Symmetrical Scaling: The logic ensures that the distance from the center pivot to each upper level is mirrored by an equal distance to the corresponding lower level. This creates a balanced visual field for the trader.
- Automated Visual Rendering: Every time the chart updates, the script clears the old lines and redraws the current levels. This ensures that the data is always relevant to the most recent daily price action.
- Customizable Visuals: The tool allows users to adjust several aesthetic and functional parameters without needing to modify the underlying logic:
- Color Coding: Users can set distinct colors for upper (typically green/lime) and lower (typically red) zones.
- Line Styling: Options are available to change the thickness, style (such as dashed or solid), and width of the lines to suit different visual preferences.
- Extension: A toggle allows users to choose whether the lines should extend infinitely across the screen or remain anchored to specific points.
- Timeframe Constraints: To ensure accuracy in the calculation of daily pivots, the script includes a check to ensure it is used on appropriate timeframes (specifically designed for views shorter than 4 hours).
How It Benefits the Trader
By instantly plotting these 20+ levels based on yesterday's price action, the tool removes the manual math required to find "Pivot Points." It provides a structured visual environment where traders can quickly identify high-probability zones where the market may experience a reversal or a breakout, making it an essential aid for scalping and day trading strategies.
//+------------------------------------------------------------------+
//|                                                Pivot Scalper.mq4 |
//|                                                               cja|
//+------------------------------------------------------------------+
#property indicator_chart_window
extern bool Show_Full_Lines = false;
extern int UpperLEVEL       = 30;
extern color Upper_Color    = Lime;
extern int LowerLEVEL       = 30;
extern color Lower_Color    = Red;
extern int Line_width       = 1;
extern int Line_style       = 2;
extern bool Extend_Lines    = true;

extern color Pivot_Color = DarkSlateGray;
extern int Pivot_width   = 2;

#define PP1 "PP1"
#define UPPER "UPPER"
#define LOWER "LOWER"
#define UPPER1 "UPPER1"
#define LOWER1 "LOWER1"
#define UPPER2 "UPPER2"
#define LOWER2 "LOWER2"
#define UPPER3 "UPPER3"
#define LOWER3 "LOWER3"
#define UPPER4 "UPPER4"
#define LOWER4 "LOWER4"
#define UPPER5 "UPPER5"
#define LOWER5 "LOWER5"
#define UPPER6 "UPPER6"
#define LOWER6 "LOWER6"
#define UPPER7 "UPPER7"
#define LOWER7 "LOWER7"
#define UPPER8 "UPPER8"
#define LOWER8 "LOWER8"
#define UPPER9 "UPPER9"
#define LOWER9 "LOWER9"

double x;
int trend;
//+------------------------------------------------------------------+
//| Custom indicator initialization function                         |
//+------------------------------------------------------------------+
int init()
  {
//---- indicators
IndicatorShortName("Pivot Scalper");
//----
   return(0);
  }
//+------------------------------------------------------------------+
//| Custom indicator deinitialization function                       |
//+------------------------------------------------------------------+
int deinit()
  {
//----
   ObjectDelete(PP1);
   ObjectDelete(UPPER); ObjectDelete(LOWER);
   ObjectDelete(UPPER1); ObjectDelete(LOWER1);
   ObjectDelete(UPPER2); ObjectDelete(LOWER2);
   ObjectDelete(UPPER3); ObjectDelete(LOWER3);
   ObjectDelete(UPPER4); ObjectDelete(LOWER4);
   ObjectDelete(UPPER5); ObjectDelete(LOWER5);
   ObjectDelete(UPPER6); ObjectDelete(LOWER6);
   ObjectDelete(UPPER7); ObjectDelete(LOWER7);
   ObjectDelete(UPPER8); ObjectDelete(LOWER8);
   ObjectDelete(UPPER9); ObjectDelete(LOWER9);

   DeleteLevel();
//----
   return(0);
  }
//+------------------------------------------------------------------+
//| Custom indicator iteration function                              |
//+------------------------------------------------------------------+
int start()
  {
   int counted_bars= IndicatorCounted();
    x = Period();
       if(x > 240) return(-1);

  if(Show_Full_Lines){trend = OBJ_HLINE;}else{trend=OBJ_TREND;}
//----
   CreatePVT();
}

void CreateLevel(string Line, double start, double end,double w, double s,color clr)
  {
   ObjectCreate(Line, trend, 0, iTime(NULL,1440,0), start, Time[0], end);
   ObjectSet(Line, OBJPROP_COLOR, clr);
   ObjectSet(Line,OBJPROP_WIDTH,w);
   ObjectSet(Line,OBJPROP_STYLE,s);
   ObjectSet(Line,OBJPROP_RAY,Extend_Lines);
   ObjectSet(Line,OBJPROP_BACK,true);
     }
        void DeleteLevel()
   {
   ObjectDelete(PP1);
   ObjectDelete(UPPER); ObjectDelete(LOWER);
   ObjectDelete(UPPER1); ObjectDelete(LOWER1);
   ObjectDelete(UPPER2); ObjectDelete(LOWER2);
   ObjectDelete(UPPER3); ObjectDelete(LOWER3);
   ObjectDelete(UPPER4); ObjectDelete(LOWER4);
   ObjectDelete(UPPER5); ObjectDelete(LOWER5);
   ObjectDelete(UPPER6); ObjectDelete(LOWER6);
   ObjectDelete(UPPER7); ObjectDelete(LOWER7);
   ObjectDelete(UPPER8); ObjectDelete(LOWER8);
   ObjectDelete(UPPER9); ObjectDelete(LOWER9);
   }
   void CreatePVT()
   {

     DeleteLevel();


    double P = (iHigh(NULL,1440,1) + iLow(NULL,1440,1) + iClose(NULL,1440,1)) / 3;
    double UP = P+ UpperLEVEL*Point;
    double DN = P- LowerLEVEL*Point;
    double UP1 = P+ (UpperLEVEL*Point)*2;
    double DN1 = P- (LowerLEVEL*Point)*2;
    double UP2 = P+ (UpperLEVEL*Point)*3;
    double DN2 = P- (LowerLEVEL*Point)*3;
    double UP3 = P+ (UpperLEVEL*Point)*4;
    double DN3 = P- (LowerLEVEL*Point)*4;
    double UP4 = P+ (UpperLEVEL*Point)*5;
    double DN4 = P- (LowerLEVEL*Point)*5;
    double UP5 = P+ (UpperLEVEL*Point)*6;
    double DN5 = P- (LowerLEVEL*Point)*6;
    double UP6 = P+ (UpperLEVEL*Point)*7;
    double DN6 = P- (LowerLEVEL*Point)*7;
    double UP7 = P+ (UpperLEVEL*Point)*8;
    double DN7 = P- (LowerLEVEL*Point)*8;
    double UP8 = P+ (UpperLEVEL*Point)*9;
    double DN8 = P- (LowerLEVEL*Point)*9;
    double UP9 = P+ (UpperLEVEL*Point)*10;
    double DN9 = P- (LowerLEVEL*Point)*10;


    CreateLevel(PP1,P,P,Pivot_width,0,Pivot_Color);
    CreateLevel(UPPER,UP,UP,Line_width,Line_style, Upper_Color );
    CreateLevel(LOWER,DN,DN,Line_width,Line_style, Lower_Color );
    CreateLevel(UPPER1,UP1,UP1,Line_width,Line_style, Upper_Color );
    CreateLevel(LOWER1,DN1,DN1,Line_width,Line_style, Lower_Color );
    CreateLevel(UPPER2,UP2,UP2,Line_width,Line_style, Upper_Color );
    CreateLevel(LOWER2,DN2,DN2,Line_width,Line_style, Lower_Color );
    CreateLevel(UPPER3,UP3,UP3,Line_width,Line_style, Upper_Color );
    CreateLevel(LOWER3,DN3,DN3,Line_width,Line_style, Lower_Color );
    CreateLevel(UPPER4,UP4,UP4,Line_width,Line_style, Upper_Color );
    CreateLevel(LOWER4,DN4,DN4,Line_width,Line_style, Lower_Color );
    CreateLevel(UPPER5,UP5,UP5,Line_width,Line_style, Upper_Color );
    CreateLevel(LOWER5,DN5,DN5,Line_width,Line_style, Lower_Color );
    CreateLevel(UPPER6,UP6,UP6,Line_width,Line_style, Upper_Color );
    CreateLevel(LOWER6,DN6,DN6,Line_width,Line_style, Lower_Color );
    CreateLevel(UPPER7,UP7,UP7,Line_width,Line_style, Upper_Color );
    CreateLevel(LOWER7,DN7,DN7,Line_width,Line_style, Lower_Color );
    CreateLevel(UPPER8,UP8,UP8,Line_width,Line_style, Upper_Color );
    CreateLevel(LOWER8,DN8,DN8,Line_width,Line_style, Lower_Color );
    CreateLevel(UPPER9,UP9,UP9,Line_width,Line_style, Upper_Color );
    CreateLevel(LOWER9,DN9,DN9,Line_width,Line_style, Lower_Color );


//----
   return(0);
  }
//+------------------------------------------------------------------+
Comments