Price Data Components
3
Views
0
Downloads
0
Favorites
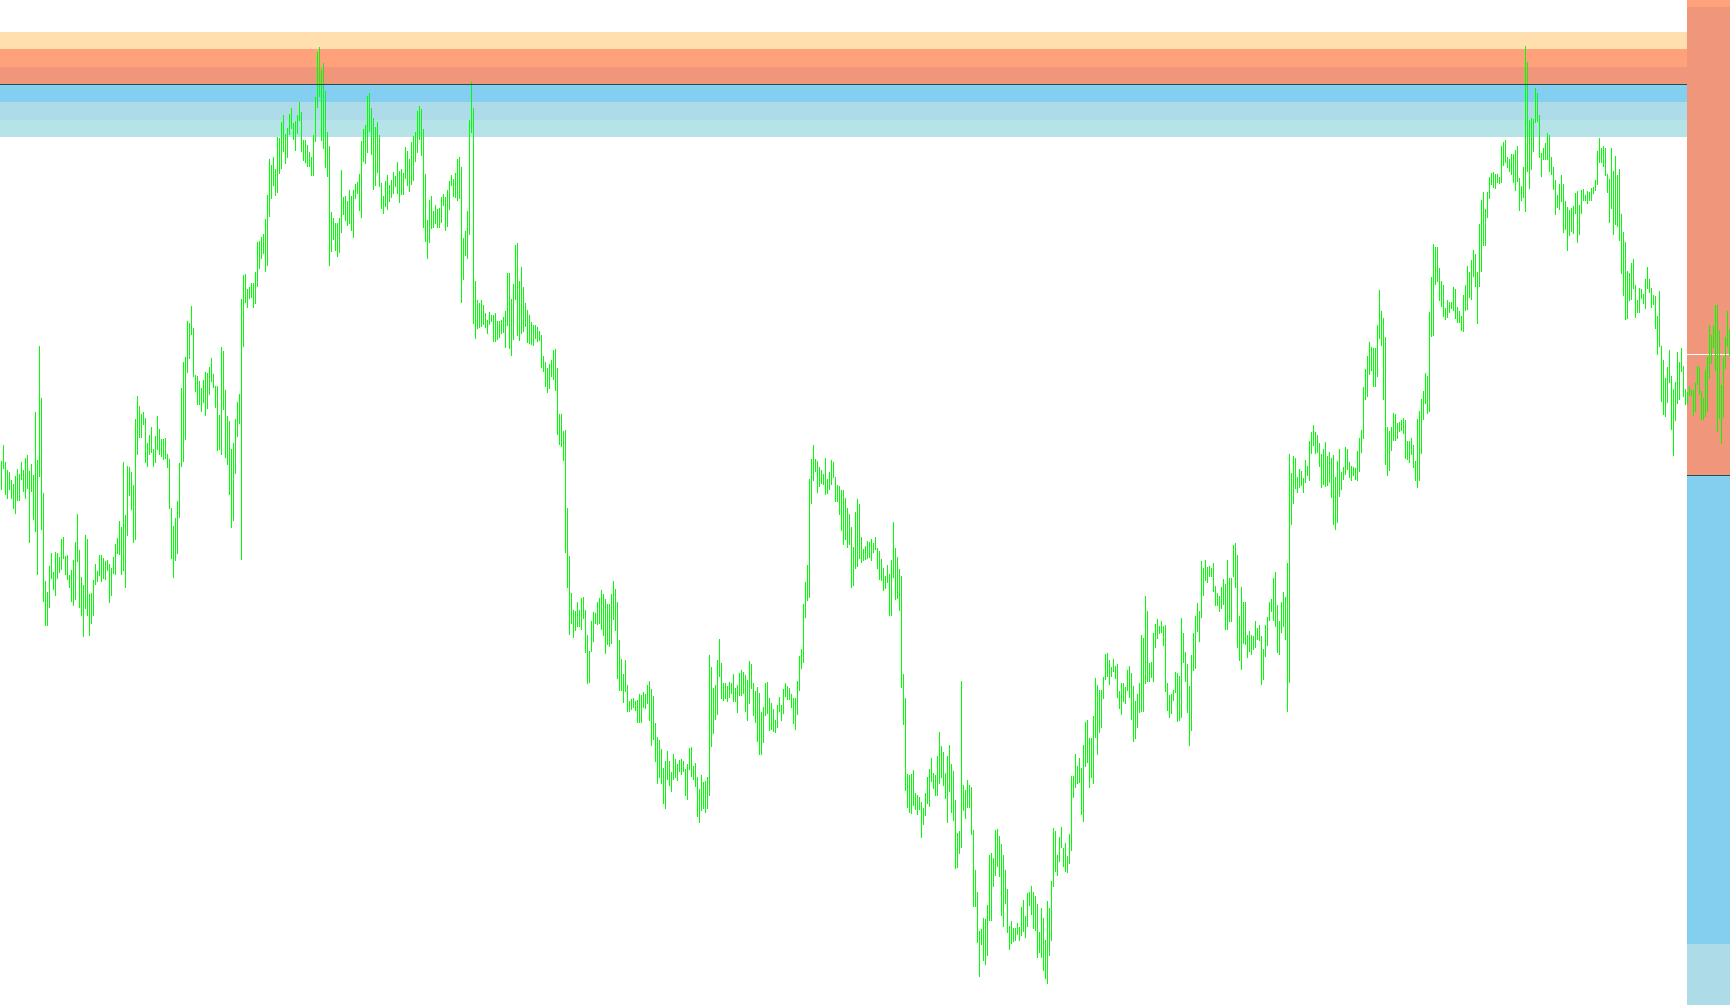
Pivots TimeShift History v1
//+------------------------------------------------------------------+
//|                                  Pivots TimeShift History v1.mq4 |
//|                                                LNX_Pivots_v2.mq4 |
//|                         Written by IgorAD,igorad2003@yahoo.co.uk |
//|            http://finance.groups.yahoo.com/group/TrendLaboratory |
//+------------------------------------------------------------------+
#property copyright "code adapted by cja - cjatradingtools.com"

#property indicator_chart_window
//---- input parameters
extern int   CountDays     =50;
extern int   GMT           =0;

extern bool   ShowLevels_as_Lines = false;
extern color  PivotColor = DarkSlateGray;
extern color  R3Color    = NavajoWhite;
extern color  R2Color    = LightSalmon;
extern color  R1Color    = DarkSalmon;
extern color  S3Color    = PowderBlue;
extern color  S2Color    = LightBlue;
extern color  S1Color    = SkyBlue;


//---- indicator buffers
double range[];
double timeshift[];
double low[];
double high[];
datetime time1;
datetime time2;
datetime start_time[];

int shift, num;
int time_shift[];
datetime prevDay=0;
bool fTime;
// ----
void ObjDel()
{
   if (ObjectsTotal() > 0)
   for (num=0;num<=CountDays;num++)
   {
   ObjectDelete("PP["+num+"]");
   ObjectDelete("R1["+num+"]");
   ObjectDelete("R2["+num+"]");
   ObjectDelete("R3["+num+"]");
   ObjectDelete("R4["+num+"]");
   ObjectDelete("S1["+num+"]");
   ObjectDelete("S2["+num+"]");
   ObjectDelete("S3["+num+"]");
   ObjectDelete("S4["+num+"]");


   }

}
// ----
void PlotRect(string name,double value,double value1,double line_color,double style)
{
   double valueN=NormalizeDouble(value,Digits);
   double valueN1=NormalizeDouble(value1,Digits);
   if(ShowLevels_as_Lines){bool res = ObjectCreate(name,OBJ_TREND,0,time1,valueN,time2,valueN1);}
   else{res = ObjectCreate(name,OBJ_RECTANGLE,0,time1,valueN,time2,valueN1);}
   ObjectSet(name, OBJPROP_WIDTH, 1);
   ObjectSet(name, OBJPROP_STYLE, style);
   ObjectSet(name, OBJPROP_RAY, false);
   ObjectSet(name, OBJPROP_BACK, true);
   ObjectSet(name, OBJPROP_COLOR, line_color);
}

void PlotLine(string name,double value,double value1,double line_color,double style)
{
   double valueN=NormalizeDouble(value,Digits);
   double valueN1=NormalizeDouble(value1,Digits);
   bool res = ObjectCreate(name,OBJ_TREND,0,time1,valueN,time2,valueN1);
   ObjectSet(name, OBJPROP_WIDTH, 1);
   ObjectSet(name, OBJPROP_STYLE, style);
   ObjectSet(name, OBJPROP_RAY, false);
   ObjectSet(name, OBJPROP_BACK, false);
   ObjectSet(name, OBJPROP_COLOR, line_color);
}

//+------------------------------------------------------------------+
//| Custom indicator initialization function                         |
//+------------------------------------------------------------------+
int init()
{
   fTime = true;
   IndicatorBuffers(2);
   SetIndexBuffer(0,range);
   SetIndexBuffer(1,timeshift);
   return(0);
}

//+------------------------------------------------------------------+
//| Custor indicator deinitialization function                       |
//+------------------------------------------------------------------+
int deinit()
{
   ObjDel();
   Comment("");
   return(0);
}
//+------------------------------------------------------------------+
//| LNX_Pivots_v3.1                                                    |
//+------------------------------------------------------------------+
int start()
{
   int i;
   double P,R1,R2,R3,R4,S1,S2,S3,S4;

   datetime cDay = iTime(NULL,PERIOD_D1,0) + (GMT-Period()/60.0)*3600;
   if (cDay != prevDay || fTime)
   {
   ObjDel();
   ArrayResize(start_time,CountDays+1);
   ArrayResize(time_shift,CountDays+1);
   ArrayResize(high,CountDays+1);
   ArrayResize(low,CountDays+1);
   ArrayResize(range,CountDays+1);
      for (shift=0;shift<=CountDays;shift++)
      {
      start_time[shift]  = iTime(NULL,PERIOD_D1,shift) + (GMT-Period()/60.0)*3600;
      time_shift[shift] = iBarShift(NULL,0,start_time[shift]);
      timeshift[shift] = iClose(NULL,0,time_shift[shift]);
      }

      for (shift=0;shift<=CountDays-1;shift++)
      {
      int length = time_shift[shift+1]-time_shift[shift];

      high[shift] = High[iHighest(NULL,0,MODE_HIGH,length,time_shift[shift])];
      low[shift]  = Low[iLowest(NULL,0,MODE_LOW,length,time_shift[shift])];
      range[shift] = high[shift] - low[shift];
      }

      for (shift=0;shift<=CountDays-1;shift++)
      {


      P  = (timeshift[shift]+high[shift]+low[shift])/3;

      time1 = start_time[shift]+Period()*60;

         if (shift==0)
         {
         time2 = start_time[shift] + 24*3600+Period()*60 ;

         }
         else
         time2 = start_time[shift-1]+Period()*60;

      int pstyle=0;
   PlotLine("PP["+shift+"]",P,P,PivotColor,pstyle);

   if(ShowLevels_as_Lines){
   PlotRect("R1["+shift+"]",P+range[shift]/2,              P+range[shift]/2,R1Color,pstyle);
   PlotRect("R2["+shift+"]",P+range[shift],                P+range[shift],R2Color,pstyle);
   PlotRect("R3["+shift+"]",P+range[shift]+range[shift]/2, P+range[shift]+range[shift]/2,R3Color,pstyle);

   PlotRect("S1["+shift+"]",P-range[shift]/2,              P-range[shift]/2,S1Color,pstyle);
   PlotRect("S2["+shift+"]",P-range[shift],                P-range[shift],S2Color,pstyle);
   PlotRect("S3["+shift+"]",P-range[shift]-range[shift]/2, P-range[shift]-range[shift]/2,S3Color,pstyle);
   }else{

   PlotRect("R1["+shift+"]",P+range[shift]/2,              P,R1Color,pstyle);
   PlotRect("R2["+shift+"]",P+range[shift],                P+range[shift]/2,R2Color,pstyle);
   PlotRect("R3["+shift+"]",P+range[shift]+range[shift]/2, P+range[shift],R3Color,pstyle);

   PlotRect("S1["+shift+"]",P-range[shift]/2,              P,S1Color,pstyle);
   PlotRect("S2["+shift+"]",P-range[shift],                P-range[shift]/2,S2Color,pstyle);
   PlotRect("S3["+shift+"]",P-range[shift]-range[shift]/2, P-range[shift],S3Color,pstyle);
   }


}
   fTime = false;
   prevDay = cDay;
   }

   return(0);
}
//+------------------------------------------------------------------+
Comments