Pivot_v1
Download script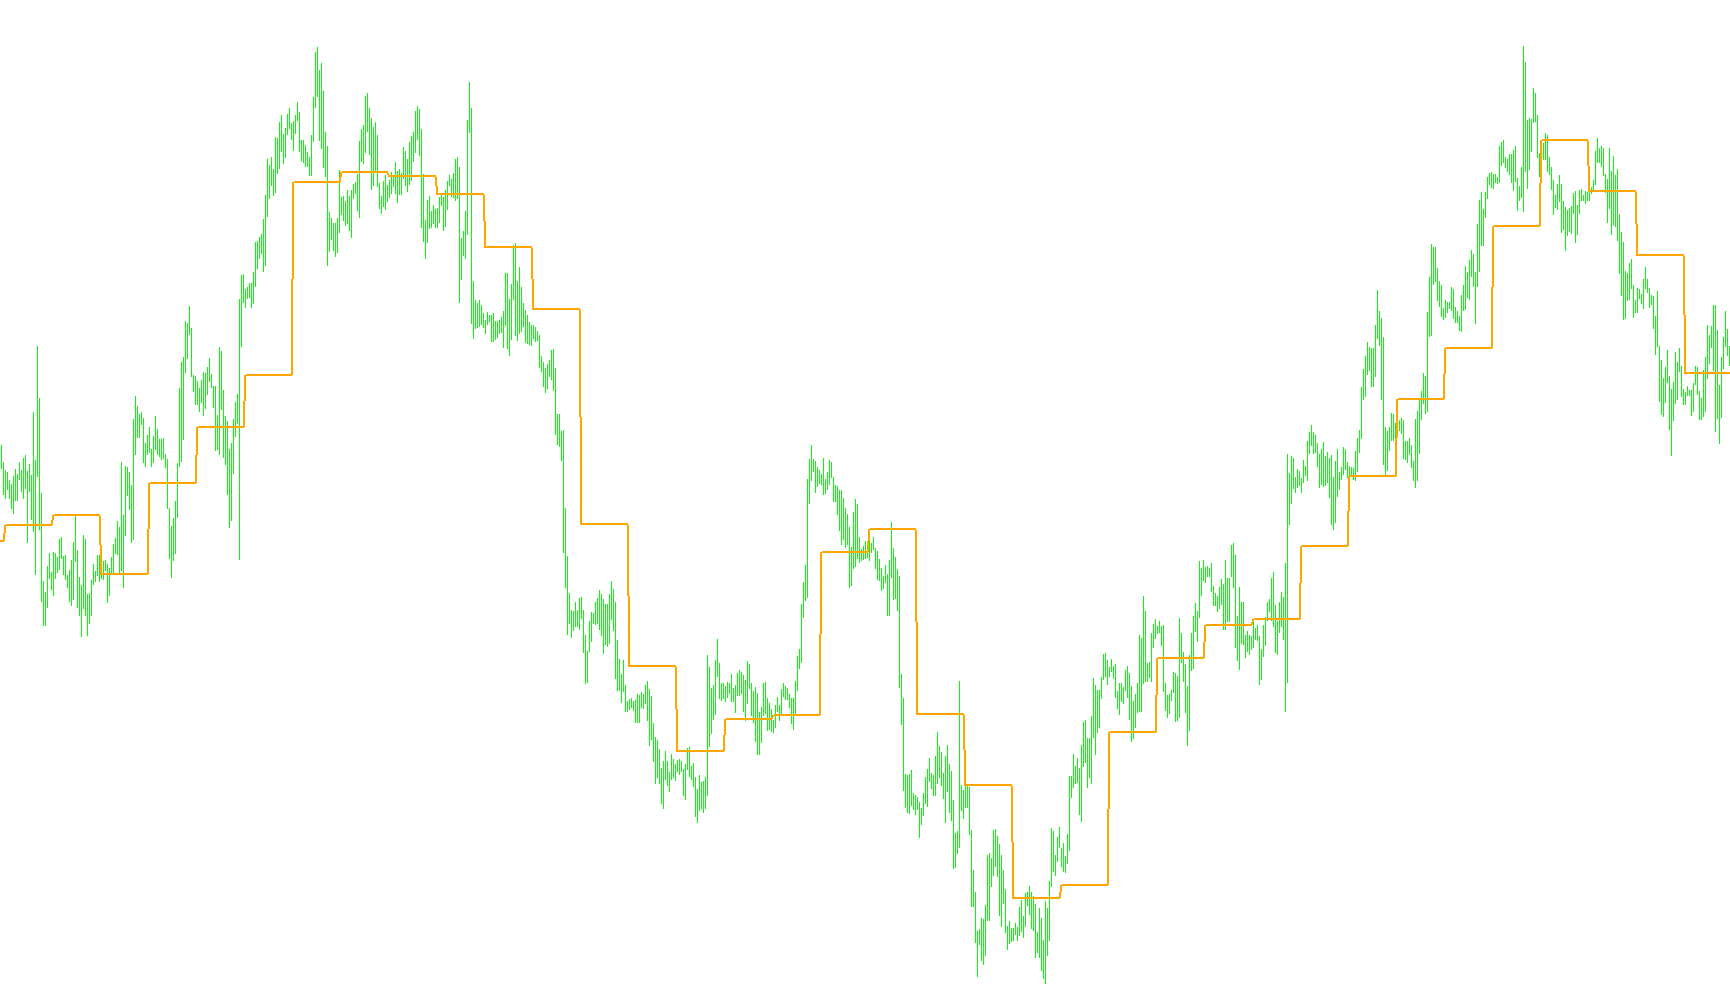
Overview
This script is a specialized technical analysis tool designed to identify and display "Pivot Points" on a trading chart. Pivot Points are commonly used by traders as key markers to determine potential support and resistance levels in the financial markets. By highlighting these specific price levels, the tool helps users visualize where the market might pause, reverse, or continue its trend based on previous price action.
Core Logic and Functionality
The script operates by analyzing historical price data to calculate a central equilibrium point for each new trading day. Here is the step-by-step logic of how it processes this information:
1. Price Range Tracking The tool constantly monitors the "High" (the highest price reached) and the "Low" (the lowest price reached) of the previous trading session. It keeps a running record of these extremes to ensure it has an accurate representation of the market's volatility during that period.
2. Day-to-Day Transition Detection The script is designed to recognize when one trading day ends and a new one begins. Every time a date change is detected, the tool triggers its primary calculation. This ensures that the pivot points are updated daily rather than moving constantly with every small price tick.
3. The Pivot Calculation Once a new day is identified, the script performs a mathematical calculation to determine the "Pivot Point" (P). It takes the highest price reached in the previous session, the lowest price reached, and the closing price of that session, then calculates their average. This result represents the "center of gravity" for the price action from the preceding day.
4. Data Visualization
- Dynamic Line Plotting: The script draws an orange line on your chart representing these calculated Pivot Points. As new days pass, the line updates to reflect the current day's calculation.
- Visual Mapping: The tool automatically places a text marker labeled "Pivot Point" at the specific coordinate where the calculation occurred, making it easy for you to see exactly which price level the script has identified for the current session.
Practical Use
Instead of manually calculating averages from complex price movements, this script automates the process. It provides a clean, visual guide on your chart, allowing you to quickly identify the "fair value" or "balance point" of the market based on yesterday's behavior. By seeing where these orange lines sit, traders can better anticipate potential areas of interest throughout the trading day.
//+------------------------------------------------------------------+
//|                                                        Pivot.mq4 |
//|                               Copyright © 2004, Poul_Trade_Forum |
//|                                                         Aborigen |
//|                                          http://forex.kbpauk.ru/ |
//+------------------------------------------------------------------+
#property copyright "Poul Trade Forum"
#property link      "http://forex.kbpauk.ru/"

#property indicator_chart_window
//#property indicator_separate_window
#property indicator_buffers 7
#property indicator_color1 Orange
//#property indicator_color2
//#property indicator_color3
//#property indicator_color4
//#property indicator_color5
//#property indicator_color6
//#property indicator_color7
//---- input parameters

//---- buffers
double PBuffer[];
//double S1Buffer[];
//double R1Buffer[];
//double S2Buffer[];
//double R2Buffer[];
//double S3Buffer[];
//double R3Buffer[];
string Pivot="Pivot Point";
//string Sup2="", Res2="", Sup3="", Res3="";
int fontsize=10;
double P;
double LastHigh,LastLow,x;

//+------------------------------------------------------------------+
//| Custor indicator deinitialization function                       |
//+------------------------------------------------------------------+
int deinit()
  {
//---- TODO: add your code here

   ObjectDelete("Pivot");
   //ObjectDelete("");
   //ObjectDelete("");
   //ObjectDelete("");
   //ObjectDelete("");
   //ObjectDelete("");
   //ObjectDelete("");

//----
   return(0);
  }
//+------------------------------------------------------------------+
//| Custom indicator initialization function                         |
//+------------------------------------------------------------------+
int init()
  {
   string short_name;


//---- indicator line
   SetIndexStyle(0,DRAW_LINE,0,2,Orange);
   //SetIndexStyle(1,DRAW_LINE,0,2,);
   //SetIndexStyle(2,DRAW_LINE,0,2,);
   //SetIndexStyle(3,DRAW_LINE,0,2,);
   //SetIndexStyle(4,DRAW_LINE,0,2,);
   //SetIndexStyle(5,DRAW_LINE,0,2,);
   //SetIndexStyle(6,DRAW_LINE,0,2,);
   SetIndexBuffer(0,PBuffer);
   //SetIndexBuffer(1,S1Buffer);
   //SetIndexBuffer(2,R1Buffer);
   //SetIndexBuffer(3,S2Buffer);
   //SetIndexBuffer(4,R2Buffer);
   //SetIndexBuffer(5,S3Buffer);
   //SetIndexBuffer(6,R3Buffer);


//---- name for DataWindow and indicator subwindow label
   short_name="Pivot Point";
   IndicatorShortName(short_name);
   SetIndexLabel(0,short_name);

//----
   SetIndexDrawBegin(0,1);
//----


//----
   return(0);
  }

//+------------------------------------------------------------------+
//| Custom indicator iteration function                              |
//+------------------------------------------------------------------+
int start()

  {
   int    counted_bars=IndicatorCounted();

   int limit, i;
//---- indicator calculation
if (counted_bars==0)
{
   x=Period();
   if (x>240) return(-1);
   //ObjectCreate("Pivot", OBJ_TEXT, 0, 0,0);
   //ObjectSetText("Pivot", "                 Pivot Point",fontsize,"Arial",Red);
   //ObjectCreate("Sup1", OBJ_TEXT, 0, 0, 0);
   //ObjectSetText("Sup1", "      S 1",fontsize,"Arial",Red);
   //ObjectCreate("Res1", OBJ_TEXT, 0, 0, 0);
   //ObjectSetText("Res1", "      R 1",fontsize,"Arial",Red);
   //ObjectCreate("Sup2", OBJ_TEXT, 0, 0, 0);
   //ObjectSetText("Sup2", "      S 2",fontsize,"Arial",Red);
   //ObjectCreate("Res2", OBJ_TEXT, 0, 0, 0);
   //ObjectSetText("Res2", "      R 2",fontsize,"Arial",Red);
   //ObjectCreate("Sup3", OBJ_TEXT, 0, 0, 0);
  // ObjectSetText("Sup3", "      S 3",fontsize,"Arial",Red);
   //ObjectCreate("Res3", OBJ_TEXT, 0, 0, 0);
   //ObjectSetText("Res3", "      R 3",fontsize,"Arial",Red);
}
   if(counted_bars<0) return(-1);
//---- last counted bar will be recounted
//   if(counted_bars>0) counted_bars--;
   limit=(Bars-counted_bars)-1;


for (i=limit; i>=0;i--)
{

if (High[i+1]>LastHigh) LastHigh=High[i+1];
if (Low[i+1]<LastLow) LastLow=Low[i+1];

if (TimeDay(Time[i])!=TimeDay(Time[i+1]))
   {
   P=(LastHigh+LastLow+Close[i+1])/3;
   //R1 = (2*P)-LastLow;
   //S1 = (2*P)-LastHigh;
   //R2 = P+(LastHigh - LastLow);
   //S2 = P-(LastHigh - LastLow);
   //R3 = (2*P)+(LastHigh-(2*LastLow));
   //S3 = (2*P)-((2* LastHigh)-LastLow);
   LastLow=Open[i]; LastHigh=Open[i];

   ObjectMove("Pivot", 0, Time[i],P);
   //ObjectMove("Sup1", 0, Time[i],S1);
   //ObjectMove("Res1", 0, Time[i],R1);
   //ObjectMove("Sup2", 0, Time[i],S2);
   //ObjectMove("Res2", 0, Time[i],R2);
   //ObjectMove("Sup3", 0, Time[i],S3);
   //ObjectMove("Res3", 0, Time[i],R3);

   }

    PBuffer[i]=P;
    //S1Buffer[i]=S1;
    //R1Buffer[i]=R1;
    //S2Buffer[i]=S2;
    //R2Buffer[i]=R2;
    //S3Buffer[i]=S3;
    //R3Buffer[i]=R3;

}

//----
   return(0);
  }
//+------------------------------------------------------------------+
Comments