Pivot_ESAZ_Day
Download script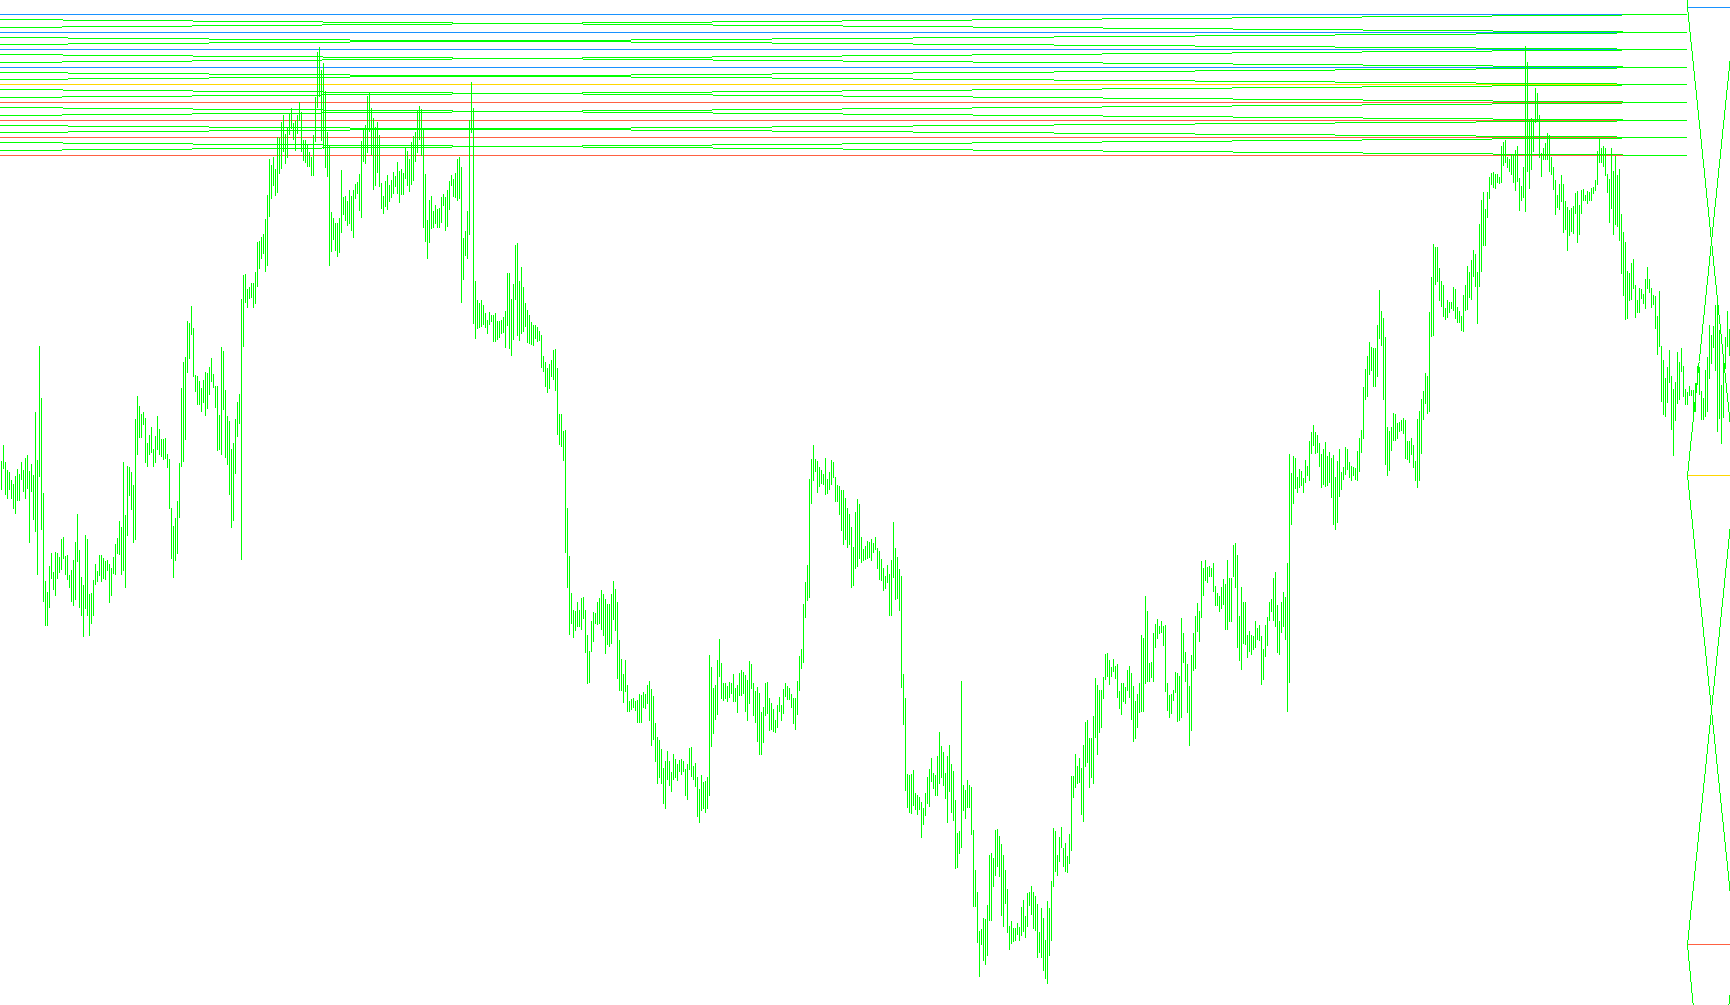
This script is a technical analysis tool designed for the MetaTrader 4 platform. Its primary purpose is to automatically calculate and display specific price levels—known as Pivot Points—on a trading chart based on historical price data from previous days.
Core Logic Overview
The script analyzes past market behavior to project potential support and resistance zones for the current trading session. Instead of looking at just one point in time, it looks back over a user-defined number of days (defaulting to 5) to establish a "range" of price movement.
How the Calculations Work
The tool follows a structured three-step process to generate these levels:
1. Data Collection The script identifies the daily high, low, and closing prices for the previous period. It adjusts these calculations based on a specific time offset (GMT) to ensure the data aligns correctly with your local trading session.
2. Establishing the Pivot Range By calculating the difference between the highest price and the lowest price over the observed period, the script determines the "Range." This range is the foundation for all subsequent levels. It then calculates a central Pivot Point, which is the average of the previous day's high, low, and closing prices.
3. Mapping Support and Resistance Once the Pivot Point and the Range are established, the script generates several tiers of price levels:
- Resistance Levels (Upward): These represent prices where the market may face difficulty moving higher. These are plotted above the Pivot Point.
- Support Levels (Downward): These represent prices where the market may find a "floor" and stop falling. These are plotted below the Pivot Point.
- Intermediate Zones: The script also creates various connecting lines (Grid Lines) that bridge the gaps between the main Pivot, Support, and Resistance levels, providing a more comprehensive visual of the expected trading corridor.
Visual Presentation
The script handles all the "heavy lifting" of drawing on your chart:
- Automatic Drawing: It automatically places horizontal lines for various levels (labeled R1-R4 for resistance and S1-S4 for support).
- Dynamic Updates: Every time a new day starts, the script clears the old data and redraws the levels based on the newest market information.
- Reference Markers: It places specific price markers on the chart to highlight the core calculations for the current day.
Summary for the User
In simple terms, this tool takes the "memory" of the last few days of trading and uses it to draw a roadmap for today. It shows you where the market is likely to struggle to move up (Resistance) and where it might find support if it drops (Support), helping traders identify potential turning points in price action at a glance.
//+------------------------------------------------------------------+
//|                                               Pivot_ESAZ_Day.mq4 |
//|                                                        DimDimych |
//|                            http://goodservice.su/forum/25-3550-1 |
//+------------------------------------------------------------------+
#property copyright "DimDimych"
#property link      "http://goodservice.su/forum/25-3550-1"

#property indicator_chart_window
//---- input parameters
extern int   CountDays     =5;
extern int   GMT           =0;
extern color pivot         =Gold;
extern color level_up      =DodgerBlue;
extern color level_dn      =Tomato;
extern color setka         =Lime;
extern color metka         =MidnightBlue;

//---- indicator buffers
double range[];
double ny_close[];
double low[];
double high[];
datetime time1;
datetime time2;
datetime ny_time[];

int shift, num;
int ny_shift[];
datetime prevDay=0;
bool fTime;
// ----
void ObjDel()
{
   if (ObjectsTotal() > 0)
   for (num=0;num<=CountDays;num++)
   {
   ObjectDelete("PP["+num+"]");
   ObjectDelete("R1["+num+"]");
   ObjectDelete("R2["+num+"]");
   ObjectDelete("R3["+num+"]");
   ObjectDelete("R4["+num+"]");
   ObjectDelete("S1["+num+"]");
   ObjectDelete("S2["+num+"]");
   ObjectDelete("S3["+num+"]");
   ObjectDelete("S4["+num+"]");

   ObjectDelete("GL1["+num+"]");
   ObjectDelete("GL2["+num+"]");
   ObjectDelete("GL3["+num+"]");
   ObjectDelete("GL4["+num+"]");
   ObjectDelete("GL5["+num+"]");
   ObjectDelete("GL6["+num+"]");
   ObjectDelete("GL7["+num+"]");
   ObjectDelete("GL8["+num+"]");
   ObjectDelete("GL9["+num+"]");
   ObjectDelete("GL10["+num+"]");
   ObjectDelete("GL11["+num+"]");
   ObjectDelete("GL12["+num+"]");
   ObjectDelete("GL13["+num+"]");
   ObjectDelete("GL14["+num+"]");
   ObjectDelete("GL15["+num+"]");
   ObjectDelete("GL16["+num+"]");

   }
   ObjectDelete("mP");
   ObjectDelete("mR1");
   ObjectDelete("mR2");
   ObjectDelete("mR3");
   ObjectDelete("mR4");
   ObjectDelete("mS1");
   ObjectDelete("mS2");
   ObjectDelete("mS3");
   ObjectDelete("mS4");
}
// ----
void PlotLine(string name,double value,double value1,double line_color,double style)
{
   double valueN=NormalizeDouble(value,Digits);
   double valueN1=NormalizeDouble(value1,Digits);
   bool res = ObjectCreate(name,OBJ_TREND,0,time1,valueN,time2,valueN1);
   ObjectSet(name, OBJPROP_WIDTH, 1);
   ObjectSet(name, OBJPROP_STYLE, style);
   ObjectSet(name, OBJPROP_RAY, false);
   ObjectSet(name, OBJPROP_BACK, true);
   ObjectSet(name, OBJPROP_COLOR, line_color);
}
//***********
void PlotPrice(string name, double value, double line_color)
{
    double valueN=NormalizeDouble(value,Digits);
    bool res = ObjectCreate(name, OBJ_ARROW, 0, time2,valueN);
    ObjectSet(name, OBJPROP_COLOR, line_color);
    ObjectSet(name, OBJPROP_WIDTH, 1);
    ObjectSet(name, OBJPROP_ARROWCODE, SYMBOL_RIGHTPRICE);
}
//+------------------------------------------------------------------+
//| Custom indicator initialization function                         |
//+------------------------------------------------------------------+
int init()
{
   fTime = true;
   IndicatorBuffers(2);
   SetIndexBuffer(0,range);
   SetIndexBuffer(1,ny_close);
   return(0);
}

//+------------------------------------------------------------------+
//| Custor indicator deinitialization function                       |
//+------------------------------------------------------------------+
int deinit()
{
   ObjDel();
   Comment("");
   return(0);
}
//+------------------------------------------------------------------+
//| LNX_Pivots_v3.1                                                    |
//+------------------------------------------------------------------+
int start()
{
   int i;
   double P,R1,R2,R3,R4,S1,S2,S3,S4;

   datetime cDay = iTime(NULL,PERIOD_D1,0) + (GMT-Period()/60.0)*3600;
   if (cDay != prevDay || fTime)
   {
   ObjDel();
   ArrayResize(ny_time,CountDays+1);
   ArrayResize(ny_shift,CountDays+1);
   ArrayResize(high,CountDays+1);
   ArrayResize(low,CountDays+1);
   ArrayResize(range,CountDays+1);
      for (shift=0;shift<=CountDays;shift++)
      {
      ny_time[shift]  = iTime(NULL,PERIOD_D1,shift) + (GMT-Period()/60.0)*3600;
      ny_shift[shift] = iBarShift(NULL,0,ny_time[shift]);
      ny_close[shift] = iClose(NULL,0,ny_shift[shift]);
      }

      for (shift=0;shift<=CountDays-1;shift++)
      {
      int length = ny_shift[shift+1]-ny_shift[shift];

      high[shift] = High[iHighest(NULL,0,MODE_HIGH,length,ny_shift[shift])];
      low[shift]  = Low[iLowest(NULL,0,MODE_LOW,length,ny_shift[shift])];
      range[shift] = high[shift] - low[shift];
      }

      for (shift=0;shift<=CountDays-1;shift++)
      {


      P  = (ny_close[shift]+high[shift]+low[shift])/3;

      time1 = ny_time[shift]+Period()*60;

         if (shift==0)
         {
         time2 = ny_time[shift] + 24*3600+Period()*60 ;
         PlotPrice("mP",P,metka);
         PlotPrice("mR1",P+range[shift]/2,metka);
         PlotPrice("mR2",P+range[shift],metka);
         PlotPrice("mS1",P-range[shift]/2,metka);
         PlotPrice("mS2",P-range[shift],metka);
         PlotPrice("mR3",P+range[shift]+range[shift]/2,metka);
         PlotPrice("mR4",P+range[shift]*2,metka);
         PlotPrice("mS3",P-range[shift]-range[shift]/2,metka);
         PlotPrice("mS4",P-range[shift]*2,metka);
         }
         else
         time2 = ny_time[shift-1]+Period()*60;

      int pstyle=0;
   PlotLine("PP["+shift+"]",P,P,pivot,pstyle);

   PlotLine("R1["+shift+"]",P+range[shift]/2,              P+range[shift]/2,level_up,pstyle);
   PlotLine("R2["+shift+"]",P+range[shift],                P+range[shift],level_up,pstyle);
   PlotLine("R3["+shift+"]",P+range[shift]+range[shift]/2, P+range[shift]+range[shift]/2,level_up,pstyle);
   PlotLine("R4["+shift+"]",P+range[shift]*2,              P+range[shift]*2,level_up,pstyle);
   PlotLine("S1["+shift+"]",P-range[shift]/2,              P-range[shift]/2,level_dn,pstyle);
   PlotLine("S2["+shift+"]",P-range[shift],                P-range[shift],level_dn,pstyle);
   PlotLine("S3["+shift+"]",P-range[shift]-range[shift]/2, P-range[shift]-range[shift]/2,level_dn,pstyle);
   PlotLine("S4["+shift+"]",P-range[shift]*2,              P-range[shift]*2,level_dn,pstyle);

   PlotLine("GL1["+shift+"]",P,                            P+range[shift]/2,setka,pstyle);
   PlotLine("GL2["+shift+"]",P+range[shift]/2,             P+range[shift],setka,pstyle);
   PlotLine("GL3["+shift+"]",P+range[shift],               P+range[shift]+range[shift]/2,setka,pstyle);
   PlotLine("GL4["+shift+"]",P+range[shift]+range[shift]/2,P+range[shift]*2,setka,pstyle);

   PlotLine("GL5["+shift+"]",P+range[shift]/2,             P,setka,pstyle);
   PlotLine("GL6["+shift+"]",P+range[shift],               P+range[shift]/2,setka,pstyle);
   PlotLine("GL7["+shift+"]",P+range[shift]+range[shift]/2,P+range[shift],setka,pstyle);
   PlotLine("GL8["+shift+"]",P+range[shift]*2,             P+range[shift]+range[shift]/2,setka,pstyle);

   PlotLine("GL9["+shift+"]",P,                            P-range[shift]/2,setka,pstyle);
   PlotLine("GL10["+shift+"]",P-range[shift]/2,             P-range[shift],setka,pstyle);
   PlotLine("GL11["+shift+"]",P-range[shift],               P-range[shift]-range[shift]/2,setka,pstyle);
   PlotLine("GL12["+shift+"]",P-range[shift]-range[shift]/2,P-range[shift]*2,setka,pstyle);

   PlotLine("GL13["+shift+"]",P-range[shift]/2,             P,setka,pstyle);
   PlotLine("GL14["+shift+"]",P-range[shift],               P-range[shift]/2,setka,pstyle);
   PlotLine("GL15["+shift+"]",P-range[shift]-range[shift]/2,P-range[shift],setka,pstyle);
   PlotLine("GL16["+shift+"]",P-range[shift]*2,             P-range[shift]-range[shift]/2,setka,pstyle);
}
   fTime = false;
   prevDay = cDay;
   }

   return(0);
}
//+------------------------------------------------------------------+
Comments