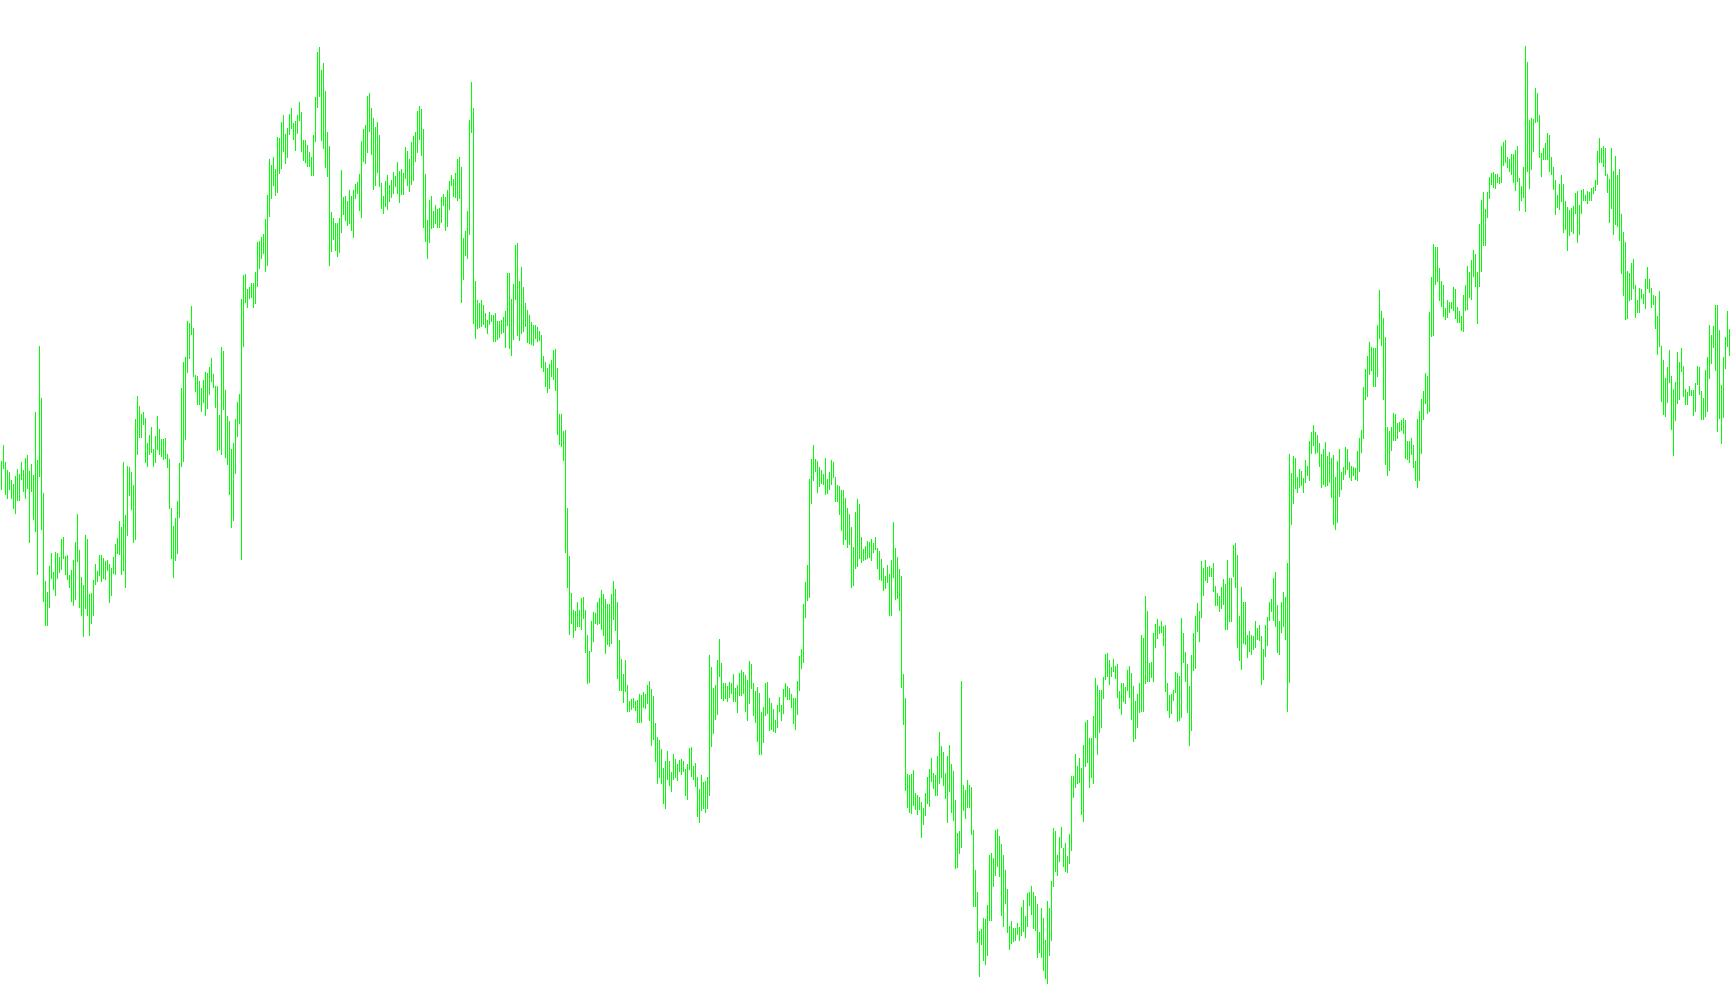
This script is designed to automatically project and visualize key price levels on your trading chart, specifically focusing on Pivot Points. These are standard technical analysis levels used by traders to identify potential areas of support and resistance for the current trading session.
Core Functionality
The tool calculates and draws several distinct zones based on the previous day's price action (High, Low, and Close). Instead of just drawing single lines, it creates colored rectangular blocks that help you visualize the "strength" of various price areas:
- Pivot Line: The central equilibrium point for the day.
- Resistance Zones (R1, R2, R3): These represent upward price ceilings where selling pressure may increase.
- Support Zones (S1, S2, S3): These represent downward price floors where buying interest may emerge.
How the Logic Works
To ensure accuracy, the script follows a specific sequence of operations:
1. Data Gathering & Smart Scheduling The script identifies the timeframe required to calculate these levels (defaulting to Daily). It is programmed with "smart" awareness of the market week; for example, it can detect if a Sunday occurred to ensure that the data pulled for Monday calculations remains consistent and doesn't include non-trading days.
2. Dynamic Calculation The script automatically retrieves the highest price, lowest price, and closing price from the previous period. It then applies a standard mathematical formula to generate:
- The Primary Pivot (the average of High, Low, and Close).
- Primary Supports/Resistances (calculated relative to the Pivot).
- Secondary/Tertiary Levels (extended zones based on the distance between the primary levels).
3. Automatic Visualization Once the calculations are finished, the script cleans the chart by removing old data and drawing new rectangular zones. These zones start from the Pivot Point and expand outward toward the Resistance and Support levels. This allows you to see the "spread" of price volatility rather than just a single coordinate.
4. Real-Time Updates The script is designed to be efficient. It monitors the market and automatically refreshes these zones whenever a new candle forms. This ensures that your chart always displays the most current levels based on the latest available market data without requiring manual intervention.
Summary for the Trader
Think of this tool as an automated map-maker. It looks at where the market was yesterday, calculates where it is likely to find "friction" today, and paints those areas clearly on your screen so you can better identify potential entry and exit zones at a glance.
//+------------------------------------------------------------------+
//|                                             Pivot Daily Zone.mq4 |
//|                                      Copyright © 2006, Eli Hayun |
//|                                          http://www.elihayun.com |
//+------------------------------------------------------------------+
#property copyright "Copyright © 2006, Eli Hayun"
#property link      "http://www.elihayun.com"

#property indicator_chart_window

#define PIVOT_LINE  "Pivot line"
#define R1          "R1"
#define R2          "R2"
#define R3          "R3"
#define S1          "S1"
#define S2          "S2"
#define S3          "S3"


bool ObjectCreated = false;

extern color  PivotColor = DarkSlateGray;
extern color  R3Color    = NavajoWhite;
extern color  R2Color    = LightSalmon;
extern color  R1Color    = DarkSalmon;
extern color  S3Color    = PowderBlue;
extern color  S2Color    = LightBlue;
extern color  S1Color    = SkyBlue;

bool HaveSunday = false;

int PivotTF = PERIOD_D1;

//+------------------------------------------------------------------+
//| Custom indicator initialization function                         |
//+------------------------------------------------------------------+
int init()
  {
   if (PivotTF >= PERIOD_D1)
      PivotTF = PERIOD_W1;

   for (int ii=0; ii<10; ii++)
   {
      if (TimeDayOfWeek(iTime(NULL, PivotTF, ii)) == 0)
         HaveSunday = true;
   }

   CreatePivotZones();
   return(0);
  }
//+------------------------------------------------------------------+
//| Custom indicator deinitialization function                       |
//+------------------------------------------------------------------+
int deinit()
  {

   DeleteObjects();

   return(0);
  }
//+------------------------------------------------------------------+
//| Custom indicator iteration function                              |
//+------------------------------------------------------------------+
int start()
  {

      if (NewBar())
      {
         CreatePivotZones();
      }

  }
//+------------------------------------------------------------------+

void CreateObj(string objName, double start, double end, color clr)
{
   int fvb = FirstVisibleBar();
   int bpw = BarsPerWindow();

   if (start == end) end -= 2 * Point;

   ObjectCreate(objName, OBJ_RECTANGLE, 0, iTime(NULL,PERIOD_D1, 0), start, Time[0], end);
   ObjectSet(objName, OBJPROP_COLOR, clr);

}
void DeleteObjects()
{
   ObjectDelete(PIVOT_LINE);
   ObjectDelete(R1);
   ObjectDelete(R2);
   ObjectDelete(R3);
   ObjectDelete(S1);
   ObjectDelete(S2);
   ObjectDelete(S3);
   ObjectDelete("Start Day");

}

bool NewBar()
{
   static datetime dt = 0;
   static datetime dtDay = 0;
   if (dtDay != iTime(NULL, PivotTF, 0))
   {
      ObjectDelete("Start Day");
      ObjectCreate("Start Day", OBJ_VLINE, 0, iTime(NULL, PERIOD_D1, 0),0);
      dtDay = iTime(NULL, PivotTF, 0);
   }
   if (dt != Time[0])
   {
      dt = Time[0];
      return(true);
   }
   return(false);
}

void CreatePivotZones()
{

      double yOpen  = GetOpen();
      double yClose = GetClose();
      double yHigh  = GetHigh();
      double yLow   = GetLow();

      double pivot = (yHigh + yClose + yLow) / 3;
      double r1    = 2 * pivot - yLow;
      double s1    = 2 * pivot - yHigh;
      double r2    = pivot + (r1 - s1);
      double r3    = yHigh + 2 * (pivot - yLow);
      double s2    = pivot - (r1 - s1);
      double s3    = yLow - 2 * (yHigh - pivot);

      DeleteObjects();
      CreateObj(PIVOT_LINE, pivot, pivot, PivotColor);
      CreateObj(R1, pivot, r1, R1Color);
      CreateObj(R2, r1, r2, R2Color);
      CreateObj(R3, r2, r3, R3Color);
      CreateObj(S1, pivot, s1, S1Color);
      CreateObj(S2, s1, s2, S2Color);
      CreateObj(S3, s2, s3, S3Color);
}

double GetHigh()
{
   int dow = TimeDayOfWeek(iTime(NULL, PivotTF, 0));
   int dow1 = TimeDayOfWeek(iTime(NULL, PivotTF, 1));

   int sh = 1;
   if ((HaveSunday) && (dow == 1))
      sh = 2; // skip sunday

   if (dow == 2) // Teusday
   {
      return ( Highest(NULL, PivotTF, MODE_HIGH, 2,1) );
   }

   return( iHigh(NULL, PivotTF, sh) );


}

double GetLow()
{
   int dow = TimeDayOfWeek(iTime(NULL, PivotTF, 0));
   int dow1 = TimeDayOfWeek(iTime(NULL, PivotTF, 1));

   int sh = 1;
   if ((HaveSunday) && (dow == 1))
      sh = 2; // skip sunday

   if (dow == 2) // Teusday
   {
      return ( Lowest(NULL, PivotTF, MODE_LOW,2,1) );
   }

   return( iLow(NULL, PivotTF, sh) );
}

double GetOpen()
{
   int dow = TimeDayOfWeek(iTime(NULL, PivotTF, 0));

   int sh = 1;
   if (HaveSunday && (dow == 1)) sh = 2; // Today is Monday

   return( iOpen(NULL, PivotTF, sh) );

}
double GetClose()
{
   int dow = TimeDayOfWeek(iTime(NULL, PivotTF, 0));

   int sh = 1;
   if (HaveSunday && (dow == 1)) sh = 2; // Today is Monday

   return( iClose(NULL, PivotTF, sh) );
}
Comments