Pivot Lines_RDs
Download script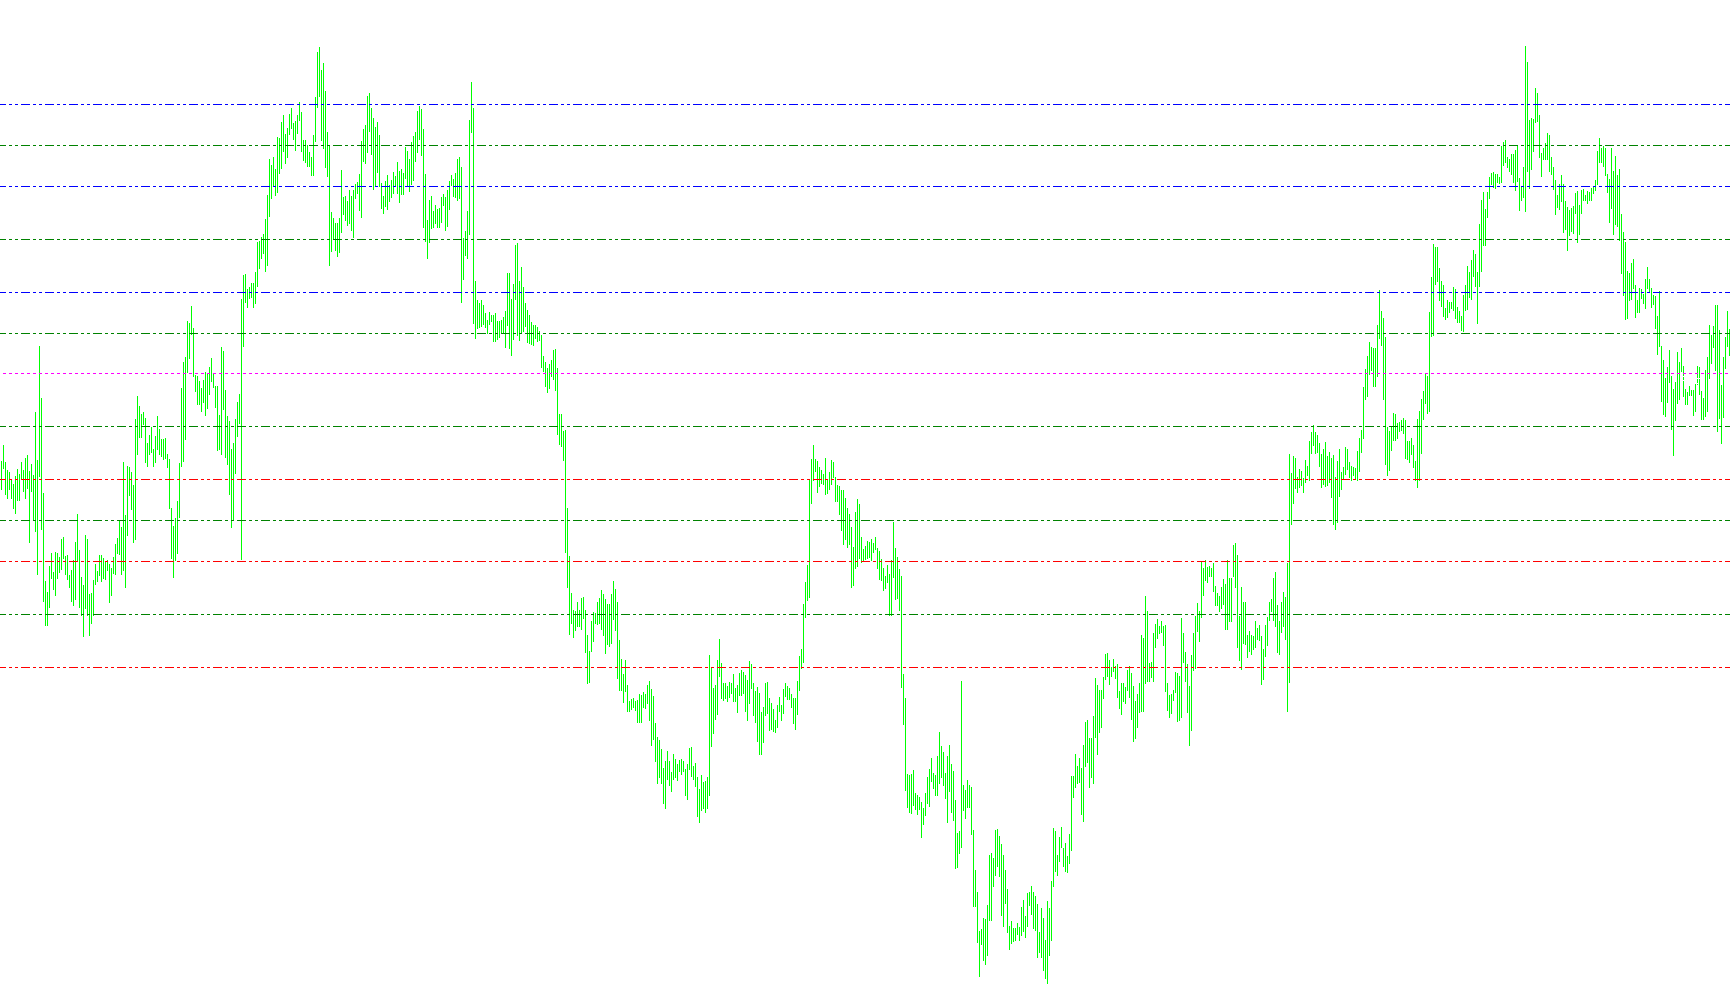
This tool is designed to provide traders with essential price levels and visual benchmarks based on historical price data. It identifies key zones where price action may experience support or resistance, helping you navigate the market more effectively by highlighting significant mathematical pivot points.
How it Works
The script primarily analyzes the relationship between "Yesterday's" price movements and "Today's" current activity. By pulling the high, low, and closing prices from the previous trading day, the tool performs several distinct calculations to project potential turning points on your chart:
1. Standard Pivot Points The core of the script calculates a primary "Pivot" (P), which acts as a central balance point for the current session. From this base, it generates several levels:
- Resistance Levels (R1, R2, R3): These represent potential ceiling areas where upward price momentum might stall.
- Support Levels (S1, S2, S3): These represent potential floor areas where downward momentum might find a foothold.
2. Camarilla Levels For traders who prefer specific volatility-based levels, the script can display "Camarilla" lines (H3, H4, L3, L4). These are often used to identify breakout points and are calculated using specific proportions of yesterday's price range.
3. Midpoint Pivots The tool also includes a "Midpoint" feature. This breaks down the primary pivot areas into smaller, more granular sub-levels (M0 through M5). These provide extra detail for traders looking for precision in identifying smaller shifts in price direction between major support and resistance zones.
Key Visual Features
- Dynamic Labeling: The script automatically places text labels (like "R1", "Pivot", or "H3") on your chart so you can immediately identify what each line represents without guesswork.
- Color-Coded Visualization: To keep the chart clean and readable, different types of levels are assigned specific colors (e.g., Blue for Resistance, Red for Support, Green for Midpoints, and Yellow for Camarilla).
- Real-Time Updates: The script monitors the current day's high and low prices in real-time and updates the displayed data and calculations as the market moves.
- Summary Dashboard: In the corner of your screen, the tool provides a "Good Morning" summary, displaying the previous day's range, today’s current range, and specific high/low values to give you an instant snapshot of market volatility.
Usage Guidelines
To ensure the logic functions correctly, the script is designed to be used on intra-day charts (any timeframe shorter than one full day). If a larger timeframe is selected, the script will notify you that the chart period is too large for these specific daily calculations.
//+------------------------------------------------------------------+
//|                                                        Pivot.mq4 |
//|                      Copyright © 2004, MetaQuotes Software Corp. |
//|                                        http://www.metaquotes.net |
//+------------------------------------------------------------------+
#property copyright "Copyright © 2004, MetaQuotes Software Corp."
#property link      "http://www.metaquotes.net"

#property indicator_chart_window

extern bool pivots = true;
extern bool camarilla = False;
extern bool midpivots = true;

double day_high=0;
double day_low=0;
double yesterday_high=0;
double yesterday_open=0;
double yesterday_low=0;
double yesterday_close=0;
double today_open=0;
double today_high=0;
double today_low=0;
double P=0;
double Q=0;
double R1,R2,R3;
double M0,M1,M2,M3,M4,M5;
double S1,S2,S3;
double H4,H3,L4,L3;
double nQ=0;
double nD=0;
double D=0;
double rates_d1[2][6];

//+------------------------------------------------------------------+
//| Custom indicator initialization function                         |
//+------------------------------------------------------------------+
int init()
  {
//---- indicators
 R1=0; R2=0; R3=0;
 M0=0; M1=0; M2=0; M3=0; M4=0; M5=0;
 S1=0; S2=0; S3=0;
 H4=0; H3=0; L4=0; L3=0;

//----
   return(0);
  }
//+------------------------------------------------------------------+
//| Custor indicator deinitialization function                       |
//+------------------------------------------------------------------+
int deinit()
  {
//---- TODO: add your code here
ObjectDelete("R1 Label");
ObjectDelete("R1 Line");
ObjectDelete("R2 Label");
ObjectDelete("R2 Line");
ObjectDelete("R3 Label");
ObjectDelete("R3 Line");
ObjectDelete("S1 Label");
ObjectDelete("S1 Line");
ObjectDelete("S2 Label");
ObjectDelete("S2 Line");
ObjectDelete("S3 Label");
ObjectDelete("S3 Line");
ObjectDelete("P Label");
ObjectDelete("P Line");
ObjectDelete("H4 Label");
ObjectDelete("H4 Line");
ObjectDelete("H3 Label");
ObjectDelete("H3 Line");
ObjectDelete("L3 Label");
ObjectDelete("L3 Line");
ObjectDelete("L4 Label");
ObjectDelete("L4 Line");
ObjectDelete("M5 Label");
ObjectDelete("M5 Line");
ObjectDelete("M4 Label");
ObjectDelete("M4 Line");
ObjectDelete("M3 Label");
ObjectDelete("M3 Line");
ObjectDelete("M2 Label");
ObjectDelete("M2 Line");
ObjectDelete("M1 Label");
ObjectDelete("M1 Line");
ObjectDelete("M0 Label");
ObjectDelete("M0 Line");
//----
   return(0);
  }
//+------------------------------------------------------------------+
//| Custom indicator iteration function                              |
//+------------------------------------------------------------------+
int start()
  {

//---- TODO: add your code here

//---- exit if period is greater than daily charts
if(Period() > 1440)
{
Print("Error - Chart period is greater than 1 day.");
return(-1); // then exit
}

//---- Get new daily prices

ArrayCopyRates(rates_d1, Symbol(), PERIOD_D1);

yesterday_close = rates_d1[1][4];
yesterday_open = rates_d1[1][1];
today_open = rates_d1[0][1];
yesterday_high = rates_d1[1][3];
yesterday_low = rates_d1[1][2];
day_high = rates_d1[0][3];
day_low = rates_d1[0][2];


//---- Calculate Pivots

D = (day_high - day_low);
Q = (yesterday_high - yesterday_low);
P = (yesterday_high + yesterday_low + yesterday_close) / 3;
R1 = (2*P)-yesterday_low;
S1 = (2*P)-yesterday_high;
R2 = P+(yesterday_high - yesterday_low);
S2 = P-(yesterday_high - yesterday_low);

	H4 = (Q*0.55)+yesterday_close;
	H3 = (Q*0.27)+yesterday_close;
	R3 = (2*P)+(yesterday_high-(2*yesterday_low));
	M5 = (R2+R3)/2;
//	R2 = P-S1+R1;
	M4 = (R1+R2)/2;
//	R1 = (2*P)-yesterday_low;
	M3 = (P+R1)/2;
//	P = (yesterday_high + yesterday_low + yesterday_close)/3;
	M2 = (P+S1)/2;
//	S1 = (2*P)-yesterday_high;
	M1 = (S1+S2)/2;
//	S2 = P-R1+S1;
	S3 = (2*P)-((2* yesterday_high)-yesterday_low);
	L3 = yesterday_close-(Q*0.27);
	L4 = yesterday_close-(Q*0.55);
	M0 = (S2+S3)/2;

if (Q > 5)
{
	nQ = Q;
}
else
{
	nQ = Q*10000;
}

if (D > 5)
{
	nD = D;
}
else
{
	nD = D*10000;
}


Comment("Yesterdays High= ",yesterday_high,"  Todays=  ",day_high,"    Previous Days Range= ",nQ,"\nYesterdays Low= ",yesterday_low,"  Todays=   ",day_low,"    Current Days Range= ",nD,"\nClose= ",yesterday_close, "    Good Morning, Good Luck Trading RICKY Ds System!");

//---- Set line labels on chart window

//---- Pivot Lines
   if (pivots==true)
   {
      if(ObjectFind("R1 label") != 0)
      {
      ObjectCreate("R1 label", OBJ_TEXT, 0, Time[20], R1);
      ObjectSetText("R1 label", " R1", 8, "Arial", White);
      }
      else
      {
      ObjectMove("R1 label", 0, Time[20], R1);
      }

      if(ObjectFind("R2 label") != 0)
      {
      ObjectCreate("R2 label", OBJ_TEXT, 0, Time[20], R2);
      ObjectSetText("R2 label", " R2", 8, "Arial", White);
      }
      else
      {
      ObjectMove("R2 label", 0, Time[20], R2);
      }

      if(ObjectFind("R3 label") != 0)
      {
      ObjectCreate("R3 label", OBJ_TEXT, 0, Time[20], R3);
      ObjectSetText("R3 label", " R3", 8, "Arial", White);
      }
      else
      {
      ObjectMove("R3 label", 0, Time[20], R3);
      }

      if(ObjectFind("P label") != 0)
      {
      ObjectCreate("P label", OBJ_TEXT, 0, Time[20], P);
      ObjectSetText("P label", "Pivot", 8, "Arial", White);
      }
      else
      {
      ObjectMove("P label", 0, Time[20], P);
      }

      if(ObjectFind("S1 label") != 0)
      {
      ObjectCreate("S1 label", OBJ_TEXT, 0, Time[20], S1);
      ObjectSetText("S1 label", "S1", 8, "Arial", White);
      }
      else
      {
      ObjectMove("S1 label", 0, Time[20], S1);
      }

      if(ObjectFind("S2 label") != 0)
      {
      ObjectCreate("S2 label", OBJ_TEXT, 0, Time[20], S2);
      ObjectSetText("S2 label", "S2", 8, "Arial", White);
      }
      else
      {
      ObjectMove("S2 label", 0, Time[20], S2);
      }

      if(ObjectFind("S3 label") != 0)
      {
      ObjectCreate("S3 label", OBJ_TEXT, 0, Time[20], S3);
      ObjectSetText("S3 label", "S3", 8, "Arial", White);
      }
      else
      {
      ObjectMove("S3 label", 0, Time[20], S3);
      }

//---  Draw  Pivot lines on chart
      if(ObjectFind("S1 line") != 0)
      {
      ObjectCreate("S1 line", OBJ_HLINE, 0, Time[40], S1);
      ObjectSet("S1 line", OBJPROP_STYLE, STYLE_DASHDOTDOT);
      ObjectSet("S1 line", OBJPROP_COLOR, Red);
      }
      else
      {
      ObjectMove("S1 line", 0, Time[40], S1);
      }

      if(ObjectFind("S2 line") != 0)
      {
      ObjectCreate("S2 line", OBJ_HLINE, 0, Time[40], S2);
      ObjectSet("S2 line", OBJPROP_STYLE, STYLE_DASHDOTDOT);
      ObjectSet("S2 line", OBJPROP_COLOR, Red);
      }
      else
      {
      ObjectMove("S2 line", 0, Time[40], S2);
      }

      if(ObjectFind("S3 line") != 0)
      {
      ObjectCreate("S3 line", OBJ_HLINE, 0, Time[40], S3);
      ObjectSet("S3 line", OBJPROP_STYLE, STYLE_DASHDOTDOT);
      ObjectSet("S3 line", OBJPROP_COLOR, Red);
      }
      else
      {
      ObjectMove("S3 line", 0, Time[40], S3);
      }

      if(ObjectFind("P line") != 0)
      {
      ObjectCreate("P line", OBJ_HLINE, 0, Time[40], P);
      ObjectSet("P line", OBJPROP_STYLE, STYLE_DOT);
      ObjectSet("P line", OBJPROP_COLOR, Magenta);
      }
      else
      {
      ObjectMove("P line", 0, Time[40], P);
      }

      if(ObjectFind("R1 line") != 0)
      {
      ObjectCreate("R1 line", OBJ_HLINE, 0, Time[40], R1);
      ObjectSet("R1 line", OBJPROP_STYLE, STYLE_DASHDOTDOT);
      ObjectSet("R1 line", OBJPROP_COLOR, Blue);
      }
      else
      {
      ObjectMove("R1 line", 0, Time[40], R1);
      }

      if(ObjectFind("R2 line") != 0)
      {
      ObjectCreate("R2 line", OBJ_HLINE, 0, Time[40], R2);
      ObjectSet("R2 line", OBJPROP_STYLE, STYLE_DASHDOTDOT);
      ObjectSet("R2 line", OBJPROP_COLOR, Blue);
      }
      else
      {
      ObjectMove("R2 line", 0, Time[40], R2);
      }

      if(ObjectFind("R3 line") != 0)
      {
      ObjectCreate("R3 line", OBJ_HLINE, 0, Time[40], R3);
      ObjectSet("R3 line", OBJPROP_STYLE, STYLE_DASHDOTDOT);
      ObjectSet("R3 line", OBJPROP_COLOR, Blue);
      }
      else
      {
      ObjectMove("R3 line", 0, Time[40], R3);
      }
   }
//---- End of Pivot Line Draw


//----- Camarilla Lines

   if (camarilla==true)
   {
      if(ObjectFind("H4 label") != 0)
      {
      ObjectCreate("H4 label", OBJ_TEXT, 0, Time[20], H4);
      ObjectSetText("H4 label", " H4", 8, "Arial", White);
      }
      else
      {
      ObjectMove("H4 label", 0, Time[20], H4);
      }

      if(ObjectFind("H3 label") != 0)
      {
      ObjectCreate("H3 label", OBJ_TEXT, 0, Time[20], H3);
      ObjectSetText("H3 label", " H3", 8, "Arial", White);
      }
      else
      {
      ObjectMove("H3 label", 0, Time[20], H3);
      }

      if(ObjectFind("L3 label") != 0)
      {
      ObjectCreate("L3 label", OBJ_TEXT, 0, Time[20], L3);
      ObjectSetText("L3 label", " L3", 8, "Arial", White);
      }
      else
      {
      ObjectMove("L3 label", 0, Time[20], L3);
      }

      if(ObjectFind("L4 label") != 0)
      {
      ObjectCreate("L4 label", OBJ_TEXT, 0, Time[20], L4);
      ObjectSetText("L4 label", " L4", 8, "Arial", White);
      }
      else
      {
      ObjectMove("L4 label", 0, Time[20], L4);
      }

//---- Draw Camarilla lines on Chart
      if(ObjectFind("H4 line") != 0)
      {
      ObjectCreate("H4 line", OBJ_HLINE, 0, Time[40], H4);
      ObjectSet("H4 line", OBJPROP_STYLE, STYLE_DASHDOTDOT);
      ObjectSet("H4 line", OBJPROP_COLOR, Yellow);
      }
      else
      {
      ObjectMove("H4 line", 0, Time[40], H4);
      }

      if(ObjectFind("H3 line") != 0)
      {
      ObjectCreate("H3 line", OBJ_HLINE, 0, Time[40], H3);
      ObjectSet("H3 line", OBJPROP_STYLE, STYLE_DASHDOTDOT);
      ObjectSet("H3 line", OBJPROP_COLOR, Yellow);
      }
      else
      {
      ObjectMove("H3 line", 0, Time[40], H3);
      }

      if(ObjectFind("L3 line") != 0)
      {
      ObjectCreate("L3 line", OBJ_HLINE, 0, Time[40], L3);
      ObjectSet("L3 line", OBJPROP_STYLE, STYLE_DASHDOTDOT);
      ObjectSet("L3 line", OBJPROP_COLOR, Yellow);
      }
      else
      {
      ObjectMove("L3 line", 0, Time[40], L3);
      }

      if(ObjectFind("L4 line") != 0)
      {
      ObjectCreate("L4 line", OBJ_HLINE, 0, Time[40], L4);
      ObjectSet("L4 line", OBJPROP_STYLE, STYLE_DASHDOTDOT);
      ObjectSet("L4 line", OBJPROP_COLOR, Yellow);
      }
      else
      {
      ObjectMove("L4 line", 0, Time[40], L4);
      }
   }
//-------End of Draw Camarilla Lines

//------ Midpoints Pivots

   if (midpivots==true)
   {

      if(ObjectFind("M5 label") != 0)
      {
      ObjectCreate("M5 label", OBJ_TEXT, 0, Time[20], M5);
      ObjectSetText("M5 label", " M5", 8, "Arial", White);
      }
      else
      {
      ObjectMove("M5 label", 0, Time[20], M5);
      }

      if(ObjectFind("M4 label") != 0)
      {
      ObjectCreate("M4 label", OBJ_TEXT, 0, Time[20], M4);
      ObjectSetText("M4 label", " M4", 8, "Arial", White);
      }
      else
      {
      ObjectMove("M4 label", 0, Time[20], M4);
      }

      if(ObjectFind("M3 label") != 0)
      {
      ObjectCreate("M3 label", OBJ_TEXT, 0, Time[20], M3);
      ObjectSetText("M3 label", " M3", 8, "Arial", White);
      }
      else
      {
      ObjectMove("M3 label", 0, Time[20], M3);
      }

      if(ObjectFind("M2 label") != 0)
      {
      ObjectCreate("M2 label", OBJ_TEXT, 0, Time[20], M2);
      ObjectSetText("M2 label", " M2", 8, "Arial", White);
      }
      else
      {
      ObjectMove("M2 label", 0, Time[20], M2);
      }

      if(ObjectFind("M1 label") != 0)
      {
      ObjectCreate("M1 label", OBJ_TEXT, 0, Time[20], M1);
      ObjectSetText("M1 label", " M1", 8, "Arial", White);
      }
      else
      {
      ObjectMove("M1 label", 0, Time[20], M1);
      }

      if(ObjectFind("M0 label") != 0)
      {
      ObjectCreate("M0 label", OBJ_TEXT, 0, Time[20], M0);
      ObjectSetText("M0 label", " M0", 8, "Arial", White);
      }
      else
      {
      ObjectMove("M0 label", 0, Time[20], M0);
      }

//---- Draw Midpoint Pivots on Chart
      if(ObjectFind("M5 line") != 0)
      {
      ObjectCreate("M5 line", OBJ_HLINE, 0, Time[40], M5);
      ObjectSet("M5 line", OBJPROP_STYLE, STYLE_DASHDOTDOT);
      ObjectSet("M5 line", OBJPROP_COLOR, Green);
      }
      else
      {
      ObjectMove("M5 line", 0, Time[40], M5);
      }

      if(ObjectFind("M4 line") != 0)
      {
      ObjectCreate("M4 line", OBJ_HLINE, 0, Time[40], M4);
      ObjectSet("M4 line", OBJPROP_STYLE, STYLE_DASHDOTDOT);
      ObjectSet("M4 line", OBJPROP_COLOR, Green);
      }
      else
      {
      ObjectMove("M4 line", 0, Time[40], M4);
      }

      if(ObjectFind("M3 line") != 0)
      {
      ObjectCreate("M3 line", OBJ_HLINE, 0, Time[40], M3);
      ObjectSet("M3 line", OBJPROP_STYLE, STYLE_DASHDOTDOT);
      ObjectSet("M3 line", OBJPROP_COLOR, Green);
      }
      else
      {
      ObjectMove("M3 line", 0, Time[40], M3);
      }

      if(ObjectFind("M2 line") != 0)
      {
      ObjectCreate("M2 line", OBJ_HLINE, 0, Time[40], M2);
      ObjectSet("M2 line", OBJPROP_STYLE, STYLE_DASHDOTDOT);
      ObjectSet("M2 line", OBJPROP_COLOR, Green);
      }
      else
      {
      ObjectMove("M2 line", 0, Time[40], M2);
      }

      if(ObjectFind("M1 line") != 0)
      {
      ObjectCreate("M1 line", OBJ_HLINE, 0, Time[40], M1);
      ObjectSet("M1 line", OBJPROP_STYLE, STYLE_DASHDOTDOT);
      ObjectSet("M1 line", OBJPROP_COLOR, Green);
      }
      else
      {
      ObjectMove("M1 line", 0, Time[40], M1);
      }

      if(ObjectFind("M0 line") != 0)
      {
      ObjectCreate("M0 line", OBJ_HLINE, 0, Time[40], M0);
      ObjectSet("M0 line", OBJPROP_STYLE, STYLE_DASHDOTDOT);
      ObjectSet("M0 line", OBJPROP_COLOR, Green);
      }
      else
      {
      ObjectMove("M0 line", 0, Time[40], M0);
      }

   }
//----End of Midpoint Pivots Draw

//---- End Of Program
   return(0);
  }
//+------------------------------------------------------------------+
Comments