pipsutorEURUSD
Download script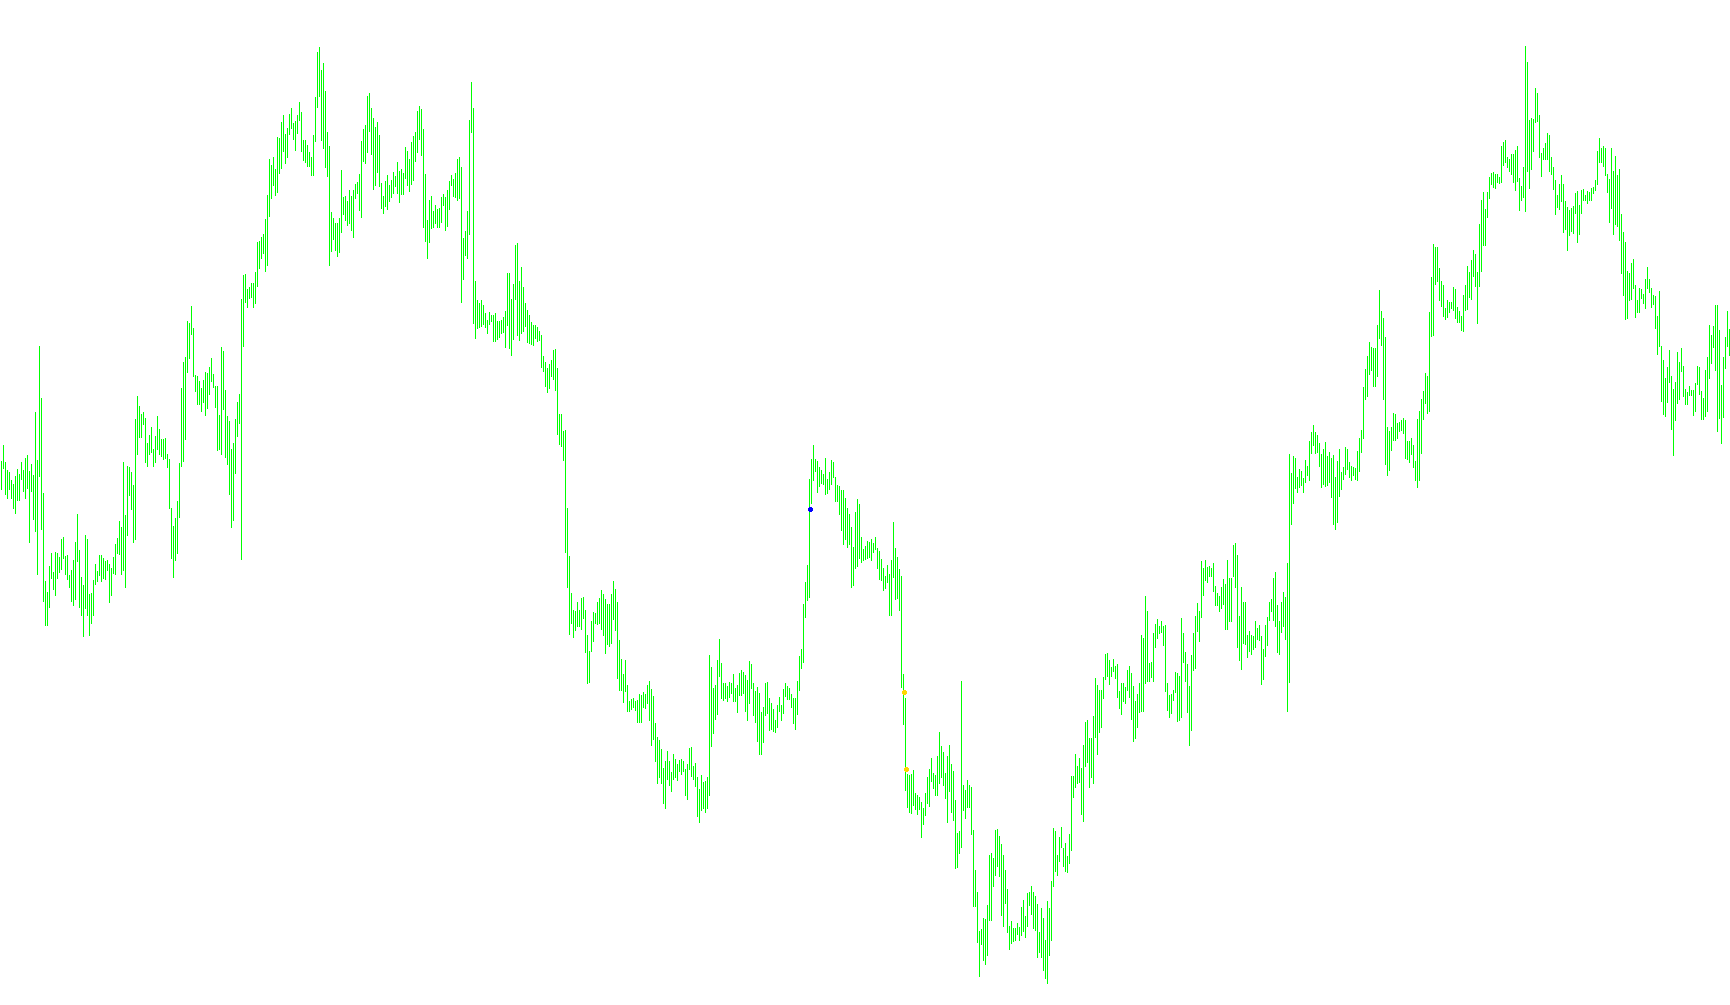
This script is designed as a visual market analysis tool for the MetaTrader platform. Its primary purpose is to identify specific momentum shifts in price action and display them as clear visual signals directly on your trading chart.
How the Logic Works
The tool functions by calculating the underlying "power" of both buying and selling pressures within the market. It looks at recent price movements to determine whether the current trend is being driven more by aggressive buyers or sellers.
Key components of the logic include:
- Momentum Tracking: The script continuously monitors two specific metrics: the "Bulls Power" (買いの勢い) and the "Bears Power" (売りの勢い). By combining these two forces, the tool creates a consolidated sentiment value.
- Signal Thresholds: Rather than reacting to every minor fluctuation, the script uses specific numerical thresholds. It looks for significant deviations in market power:
- If the selling pressure becomes sufficiently dominant (dropping below a certain negative threshold), the script identifies a potential bearish condition.
- If the buying pressure becomes sufficiently dominant (rising above a certain positive threshold), the script identifies a potential bullish condition.
- Visual Feedback: Once these conditions are met, the script places specific markers on your chart:
- Bearish Signals: These appear as arrows placed slightly above the high of a price candle, highlighting areas where downward pressure is taking hold.
- Bullish Signals: These appear as arrows placed slightly below the low of a price candle, highlighting areas where upward momentum is increasing.
User Experience
The script is designed to filter out market "noise" by focusing only on high-conviction momentum shifts. Instead of providing a constant line or trend, it acts as a signaling device, providing you with immediate visual confirmation of when the market's underlying power has shifted significantly in one direction or the other. This allows you to see potential trend reversals or continuations at a glance.
//+------------------------------------------------------------------+
//| BykovTrend_Sig.mq4
//| Ramdass - Conversion only
//+------------------------------------------------------------------+

#property indicator_chart_window
#property indicator_buffers 2
#property indicator_color1 Magenta
#property indicator_color2 Aqua

//---- input parameters
extern int RISK=3;
extern int SSP=9;
extern int CountBars=500;

//---- buffers
double val1[];
double val2[];

//+------------------------------------------------------------------+
//| Custom indicator initialization function                         |
//+------------------------------------------------------------------+
int init()
  {
   string short_name;
//---- indicator line
   IndicatorBuffers(2);
   SetIndexStyle(0,DRAW_ARROW);
   SetIndexArrow(0,159);
   SetIndexStyle(1,DRAW_ARROW);
   SetIndexArrow(1,159);
   SetIndexBuffer(0,val1);
   SetIndexBuffer(1,val2);

//----
   return(0);
  }
//+------------------------------------------------------------------+
//| BykovTrend_Sig                                                   |
//+------------------------------------------------------------------+
int start()
  {
   SetIndexDrawBegin(0,Bars-CountBars+SSP+1);
   SetIndexDrawBegin(1,Bars-CountBars+SSP+1);
   int i,counted_bars=IndicatorCounted();
   int K;
   bool uptrend,old;
   double wpr;

   K=33-RISK;
//----
   if(Bars<=SSP+1) return(0);
//---- initial zero
   if(counted_bars<SSP+1)
   {
      for(i=1;i<=0;i++) val1[CountBars-i]=0.0;
      for(i=1;i<=0;i++) val2[CountBars-i]=0.0;
   }
//----
   i=CountBars-SSP-1;
   if(counted_bars>=SSP+1) i=CountBars-counted_bars-1;
   while(i>=0)
     {

   wpr=iBearsPower(NULL, 0, 5,PRICE_TYPICAL,i)+iBullsPower(NULL, 0, 5,PRICE_TYPICAL,i);
   val1[i]=0.0; val2[i]=0.0;
   if (wpr<(-0.0035)) {val1[i]=High[i]+15*Point;};
   if (wpr>0.0035) {val2[i]=Low[i]-15*Point;}
   //if ((! uptrend==old) && uptrend==true) {val2[i]=Low[i]-15*Point;}
   //if ((! uptrend==old) && uptrend==false) {val1[i]=High[i]+15*Point;}
   old=uptrend;

      i--;
     }
   return(0);
  }
//+------------------------------------------------------------------+
Comments