Pivot Lines Timezone_v5
Download script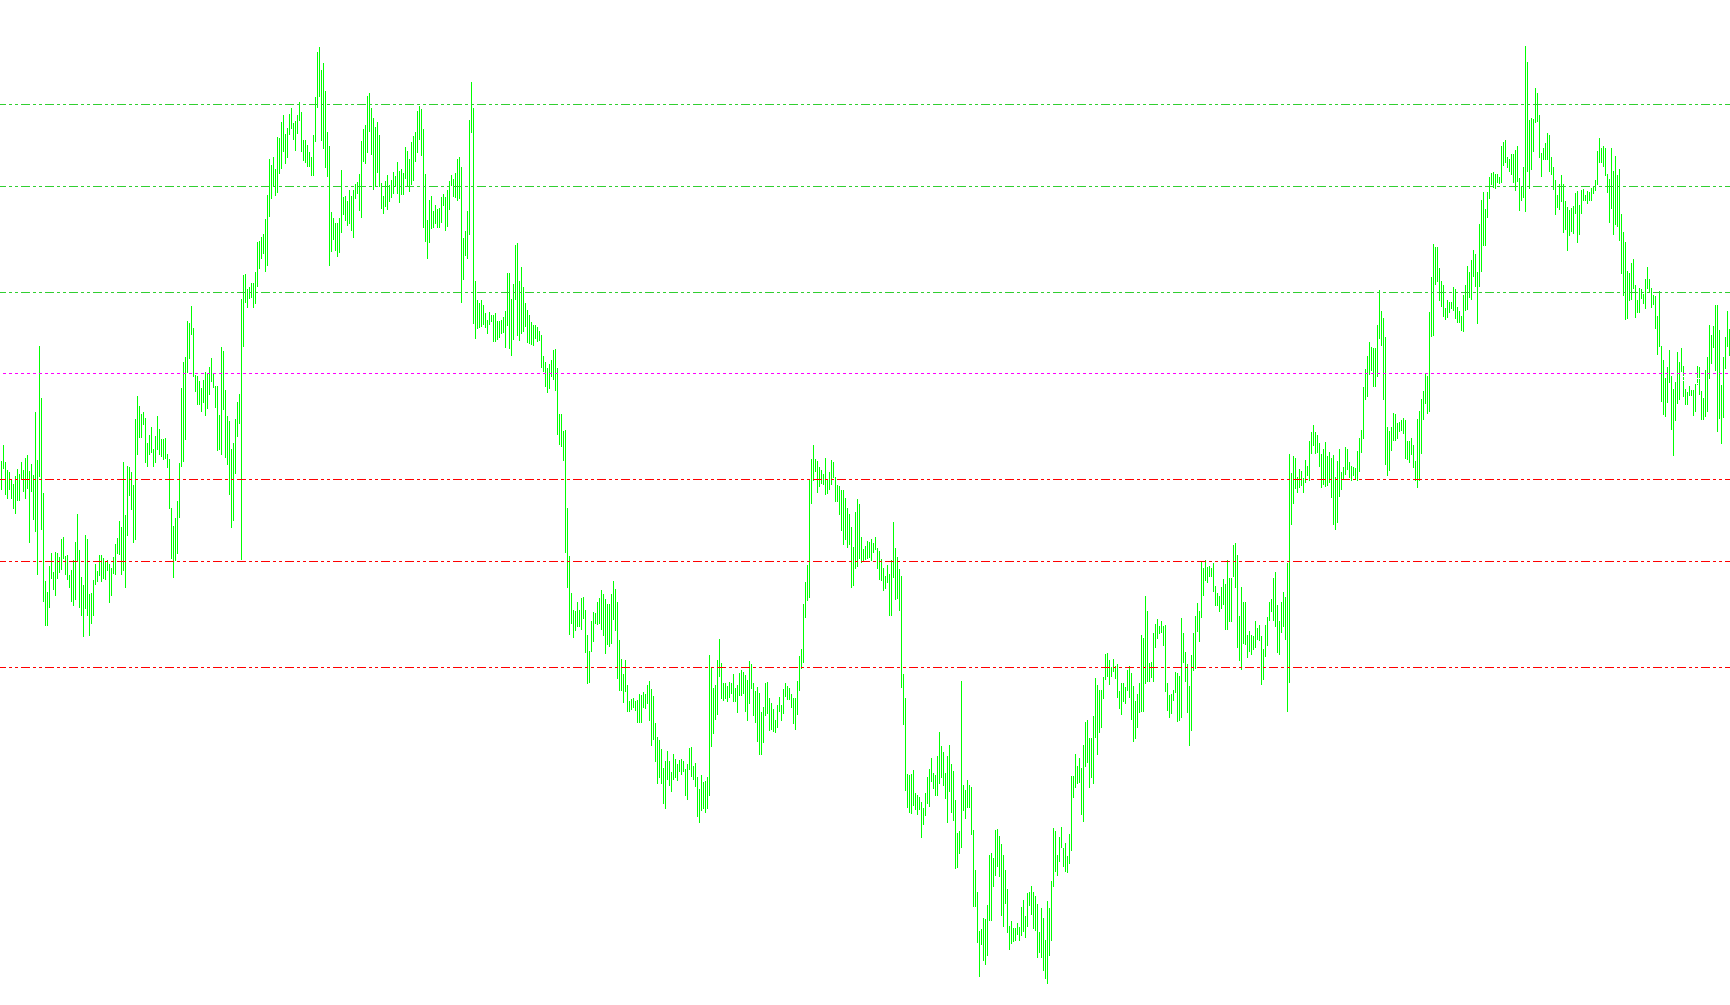
This script is a specialized technical analysis tool designed for the MetaTrader platform. Its primary purpose is to automatically calculate and display key price levels—known as Pivot Points, Camarilla Breaks, and Midpoints—directly on your trading charts based on historical price data.
By using these levels, traders can better identify potential areas of support (where prices might stop falling) and resistance (where prices might stop rising).
Core Functionality
The logic of the script follows a structured process to turn raw market data into visual trading guides:
1. Data Gathering & Filtering
- Timeframe Check: The script first ensures that you are viewing a chart smaller than one day (e.g., 1-hour, 15-minute, or 1-minute charts). If the timeframe is too large, it will notify you and stop, as the calculations require specific hourly and daily granularity.
- Historical Retrieval: It automatically pulls high, low, open, and close prices from both the previous day and the current day. It also specifically looks for "yesterday’s" data to use as the foundation for today's calculations.
2. Mathematical Calculations The script performs several distinct sets of calculations depending on your preferences:
- Standard Pivot Points: These are the most common levels used by traders. The script calculates a central "Pivot" (the average of yesterday's high, low, and close) and then derives Resistance (R1, R2, R3) and Support (S1, S2, S3) levels based on that center point.
- Camarilla Breaks: These are specialized price levels often used by breakout traders. The script calculates four specific lines (H3, H4, L3, L4) which represent potential "breakout" zones for the day.
- Midpoint Pivots: This adds a layer of extra detail by breaking down the space between the main Pivot and Support/Resistance levels into smaller sub-levels (M0 through M5). This helps identify "mini" zones within the larger trends.
3. Dynamic Visual Mapping Once the numbers are calculated, the script handles all the visual heavy lifting:
- Automatic Drawing: It creates horizontal lines on your chart for every level you have enabled.
- Dynamic Labeling: It places text labels (like "R1", "P", or "M3") next to the lines so you can immediately identify which price level is which.
- Real-Time Updates: The script is designed to move these lines automatically as new price data comes in, ensuring the levels remain accurate as the market fluctuates throughout the trading session.
User Experience Features
- Color Coding: The script distinguishes between different types of levels using colors (e.g., Green for Resistance, Red for Support, Magenta for Pivots, and Yellow/Blue for specialized breaks).
- Customization: Through the settings menu, you can toggle these three different systems on or off, allowing you to keep your chart clean by only displaying the specific logic that fits your trading style.
- On-Screen Dashboard: It provides a small text comment on the chart that displays current high/low values and the "range" (the distance between high and low) for both yesterday and today, giving you a quick snapshot of market volatility at a glance.
//+-------------------------------------------------------------------+
//|                                          Pivot Lines TimeZone.mq4 |
//|                       Copyright © 2004, MetaQuotes Software Corp. |
//|                                         http://www.metaquotes.net |
//|                                Made/Modified by Alejandro Galindo |
//|                                                                   |
//|                                                                   |
//|                                       help me to continue coding  |
//|                                PayPal donation to ag@elcactus.com |
//+-------------------------------------------------------------------+
#property copyright "Copyright © 2004, MetaQuotes Software Corp."
#property link      "http://www.metaquotes.net"
#property indicator_buffers 5
#property indicator_chart_window
//----
extern int TimeZone=0;
extern bool pivots=true;
extern bool camarilla=false;
extern bool midpivots=false;
//----
double day_high=0;
double day_low=0;
double yesterday_high=0;
double yesterday_open=0;
double yesterday_low=0;
double yesterday_close=0;
double today_open=0;
double today_high=0;
double today_low=0;
double P=0;
double Q=0;
double R1,R2,R3;
double M0,M1,M2,M3,M4,M5;
double S1,S2,S3;
double H4,H3,L4,L3;
double nQ=0;
double nD=0;
double D=0;
double rates_h1[2][6];
double rates_d1[2][6];
double pivotbuffer[];
double s1buffer[];
double r1buffer[];
double s2buffer[];
double r2buffer[];
//+------------------------------------------------------------------+
//| Custom indicator initialization function                         |
//+------------------------------------------------------------------+
int init()
  {
//---- indicators
   R1=0; R2=0; R3=0;
   M0=0; M1=0; M2=0; M3=0; M4=0; M5=0;
   S1=0; S2=0; S3=0;
   H4=0; H3=0; L4=0; L3=0;
//----
   SetIndexStyle(0,DRAW_LINE,EMPTY);
   SetIndexBuffer(0, pivotbuffer);
   SetIndexStyle(1,DRAW_LINE,EMPTY);
   SetIndexBuffer(1, s1buffer);
   SetIndexStyle(2,DRAW_LINE,EMPTY);
   SetIndexBuffer(2, r1buffer);
   SetIndexStyle(3,DRAW_LINE,EMPTY);
   SetIndexBuffer(4, s2buffer);
   SetIndexStyle(5,DRAW_LINE,EMPTY);
   SetIndexBuffer(5, r2buffer);
//----
   return(0);
  }
//+------------------------------------------------------------------+
//| Custor indicator deinitialization function                       |
//+------------------------------------------------------------------+
int deinit()
  {
//---- TODO: add your code here
   ObjectDelete("R1 Label");
   ObjectDelete("R1 Line");
   ObjectDelete("R2 Label");
   ObjectDelete("R2 Line");
   ObjectDelete("R3 Label");
   ObjectDelete("R3 Line");
   ObjectDelete("S1 Label");
   ObjectDelete("S1 Line");
   ObjectDelete("S2 Label");
   ObjectDelete("S2 Line");
   ObjectDelete("S3 Label");
   ObjectDelete("S3 Line");
   ObjectDelete("P Label");
   ObjectDelete("P Line");
   ObjectDelete("H4 Label");
   ObjectDelete("H4 Line");
   ObjectDelete("H3 Label");
   ObjectDelete("H3 Line");
   ObjectDelete("L3 Label");
   ObjectDelete("L3 Line");
   ObjectDelete("L4 Label");
   ObjectDelete("L4 Line");
   ObjectDelete("M5 Label");
   ObjectDelete("M5 Line");
   ObjectDelete("M4 Label");
   ObjectDelete("M4 Line");
   ObjectDelete("M3 Label");
   ObjectDelete("M3 Line");
   ObjectDelete("M2 Label");
   ObjectDelete("M2 Line");
   ObjectDelete("M1 Label");
   ObjectDelete("M1 Line");
   ObjectDelete("M0 Label");
   ObjectDelete("M0 Line");
//----
   return(0);
  }
//+------------------------------------------------------------------+
//| Custom indicator iteration function                              |
//+------------------------------------------------------------------+
int start()
  {
   int i=0, j=0;
//---- TODO: add your code here
//---- exit if period is greater than daily charts
   if(Period() > 1440)
     {
      Print("Error - Chart period is greater than 1 day.");
      return(-1); // then exit
     }
//---- Get new daily prices
   ArrayCopyRates(rates_d1, Symbol(), PERIOD_D1);
   yesterday_high=rates_d1[1][3];
   yesterday_low=rates_d1[1][2];
   day_high=rates_d1[0][3];
   day_low=rates_d1[0][2];
//----
   ArrayCopyRates(rates_h1, Symbol(), PERIOD_H1);
   for(i=0;i<=25;i++)
     {
      if (TimeMinute(rates_h1[i][0])==0 && (TimeHour(rates_h1[i][0])-TimeZone)==0)
        {
         yesterday_close=rates_h1[i+1][4];
         yesterday_open=rates_h1[i+24][1];
         today_open=rates_h1[i][1];
         break;
        }
     }
//---- Calculate Pivots
   D=(day_high - day_low);
   Q=(yesterday_high - yesterday_low);
   P=(yesterday_high + yesterday_low + yesterday_close)/3;
   R1=(2*P)-yesterday_low;
   S1=(2*P)-yesterday_high;
   R2=P+(yesterday_high - yesterday_low);
   S2=P-(yesterday_high - yesterday_low);
//----
   H4=(Q*0.55)+yesterday_close;
   H3=(Q*0.27)+yesterday_close;
   R3=(2*P)+(yesterday_high-(2*yesterday_low));
   M5=(R2+R3)/2;
   //	R2 = P-S1+R1;
   M4=(R1+R2)/2;
   //	R1 = (2*P)-yesterday_low;
   M3=(P+R1)/2;
   //	P = (yesterday_high + yesterday_low + yesterday_close)/3;
   M2=(P+S1)/2;
   //	S1 = (2*P)-yesterday_high;
   M1=(S1+S2)/2;
   //	S2 = P-R1+S1;
   S3=(2*P)-((2* yesterday_high)-yesterday_low);
   L3=yesterday_close-(Q*0.27);
   L4=yesterday_close-(Q*0.55);
   M0=(S2+S3)/2;
//----
   if (Q > 5)
     {
      nQ=Q;
     }
   else
     {
      nQ=Q*10000;
     }
   if (D > 5)
     {
      nD=D;
     }
   else
     {
      nD=D*10000;
     }
   Comment("High= ",yesterday_high,"    Previous Days Range= ",nQ,"\nLow= ",yesterday_low,"    Current Days Range= ",nD,"\nClose= ",yesterday_close,"\nOpen= ",yesterday_open);
//---- Set line labels on chart window
//---- Pivot Lines
   if (pivots==true)
     {
      if(ObjectFind("R1 label")!=0)
        {
         ObjectCreate("R1 label", OBJ_TEXT, 0, Time[20], R1);
         ObjectSetText("R1 label", " R1", 8, "Arial", White);
        }
      else
        {
         ObjectMove("R1 label", 0, Time[20], R1);
        }
      r1buffer[0]=R1;
//----
      if(ObjectFind("R2 label")!=0)
        {
         ObjectCreate("R2 label", OBJ_TEXT, 0, Time[20], R2);
         ObjectSetText("R2 label", " R2", 8, "Arial", White);
        }
      else
        {
         ObjectMove("R2 label", 0, Time[20], R2);
        }
      r2buffer[0]=R2;
//----
      if(ObjectFind("R3 label")!=0)
        {
         ObjectCreate("R3 label", OBJ_TEXT, 0, Time[20], R3);
         ObjectSetText("R3 label", " R3", 8, "Arial", White);
        }
      else
        {
         ObjectMove("R3 label", 0, Time[20], R3);
        }
      if(ObjectFind("P label")!=0)
        {
         ObjectCreate("P label", OBJ_TEXT, 0, Time[20], P);
         ObjectSetText("P label", "Pivot", 8, "Arial", White);
        }
      else
        {
         ObjectMove("P label", 0, Time[20], P);
        }
      pivotbuffer[0]=P;
//----
      if(ObjectFind("S1 label")!=0)
        {
         ObjectCreate("S1 label", OBJ_TEXT, 0, Time[20], S1);
         ObjectSetText("S1 label", "S1", 8, "Arial", White);
        }
      else
        {
         ObjectMove("S1 label", 0, Time[20], S1);
        }
      s1buffer[0]=S1;
//----
      if(ObjectFind("S2 label")!=0)
        {
         ObjectCreate("S2 label", OBJ_TEXT, 0, Time[20], S2);
         ObjectSetText("S2 label", "S2", 8, "Arial", White);
        }
      else
        {
         ObjectMove("S2 label", 0, Time[20], S2);
        }
      s2buffer[0]=S2;
//----
      if(ObjectFind("S3 label")!=0)
        {
         ObjectCreate("S3 label", OBJ_TEXT, 0, Time[20], S3);
         ObjectSetText("S3 label", "S3", 8, "Arial", White);
        }
      else
        {
         ObjectMove("S3 label", 0, Time[20], S3);
        }
      //---  Draw  Pivot lines on chart
      if(ObjectFind("S1 line")!=0)
        {
         ObjectCreate("S1 line", OBJ_HLINE, 0, Time[40], S1);
         ObjectSet("S1 line", OBJPROP_STYLE, STYLE_DASHDOTDOT);
         ObjectSet("S1 line", OBJPROP_COLOR, Red);
        }
      else
        {
         ObjectMove("S1 line", 0, Time[40], S1);
        }
      if(ObjectFind("S2 line")!=0)
        {
         ObjectCreate("S2 line", OBJ_HLINE, 0, Time[40], S2);
         ObjectSet("S2 line", OBJPROP_STYLE, STYLE_DASHDOTDOT);
         ObjectSet("S2 line", OBJPROP_COLOR, Red);
        }
      else
        {
         ObjectMove("S2 line", 0, Time[40], S2);
        }
      if(ObjectFind("S3 line")!=0)
        {
         ObjectCreate("S3 line", OBJ_HLINE, 0, Time[40], S3);
         ObjectSet("S3 line", OBJPROP_STYLE, STYLE_DASHDOTDOT);
         ObjectSet("S3 line", OBJPROP_COLOR, Red);
        }
      else
        {
         ObjectMove("S3 line", 0, Time[40], S3);
        }
      if(ObjectFind("P line")!=0)
        {
         ObjectCreate("P line", OBJ_HLINE, 0, Time[40], P);
         ObjectSet("P line", OBJPROP_STYLE, STYLE_DOT);
         ObjectSet("P line", OBJPROP_COLOR, Magenta);
        }
      else
        {
         ObjectMove("P line", 0, Time[40], P);
        }
      if(ObjectFind("R1 line")!=0)
        {
         ObjectCreate("R1 line", OBJ_HLINE, 0, Time[40], R1);
         ObjectSet("R1 line", OBJPROP_STYLE, STYLE_DASHDOTDOT);
         ObjectSet("R1 line", OBJPROP_COLOR, LimeGreen);
        }
      else
        {
         ObjectMove("R1 line", 0, Time[40], R1);
        }
      if(ObjectFind("R2 line")!=0)
        {
         ObjectCreate("R2 line", OBJ_HLINE, 0, Time[40], R2);
         ObjectSet("R2 line", OBJPROP_STYLE, STYLE_DASHDOTDOT);
         ObjectSet("R2 line", OBJPROP_COLOR, LimeGreen);
        }
      else
        {
         ObjectMove("R2 line", 0, Time[40], R2);
        }
      if(ObjectFind("R3 line")!=0)
        {
         ObjectCreate("R3 line", OBJ_HLINE, 0, Time[40], R3);
         ObjectSet("R3 line", OBJPROP_STYLE, STYLE_DASHDOTDOT);
         ObjectSet("R3 line", OBJPROP_COLOR, LimeGreen);
        }
      else
        {
         ObjectMove("R3 line", 0, Time[40], R3);
        }
     }
//---- End of Pivot Line Draw
//----- Camarilla Lines
   if (camarilla==true)
     {
      if(ObjectFind("H4 label")!=0)
        {
         ObjectCreate("H4 label", OBJ_TEXT, 0, Time[20], H4);
         ObjectSetText("H4 label", " H4", 8, "Arial", White);
        }
      else
        {
         ObjectMove("H4 label", 0, Time[20], H4);
        }
      if(ObjectFind("H3 label")!=0)
        {
         ObjectCreate("H3 label", OBJ_TEXT, 0, Time[20], H3);
         ObjectSetText("H3 label", " H3", 8, "Arial", White);
        }
      else
        {
         ObjectMove("H3 label", 0, Time[20], H3);
        }
      if(ObjectFind("L3 label")!=0)
        {
         ObjectCreate("L3 label", OBJ_TEXT, 0, Time[20], L3);
         ObjectSetText("L3 label", " L3", 8, "Arial", White);
        }
      else
        {
         ObjectMove("L3 label", 0, Time[20], L3);
        }
      if(ObjectFind("L4 label")!=0)
        {
         ObjectCreate("L4 label", OBJ_TEXT, 0, Time[20], L4);
         ObjectSetText("L4 label", " L4", 8, "Arial", White);
        }
      else
        {
         ObjectMove("L4 label", 0, Time[20], L4);
        }
      //---- Draw Camarilla lines on Chart
      if(ObjectFind("H4 line")!=0)
        {
         ObjectCreate("H4 line", OBJ_HLINE, 0, Time[40], H4);
         ObjectSet("H4 line", OBJPROP_STYLE, STYLE_DASHDOTDOT);
         ObjectSet("H4 line", OBJPROP_COLOR, Yellow);
        }
      else
        {
         ObjectMove("H4 line", 0, Time[40], H4);
        }
      if(ObjectFind("H3 line")!=0)
        {
         ObjectCreate("H3 line", OBJ_HLINE, 0, Time[40], H3);
         ObjectSet("H3 line", OBJPROP_STYLE, STYLE_DASHDOTDOT);
         ObjectSet("H3 line", OBJPROP_COLOR, Yellow);
        }
      else
        {
         ObjectMove("H3 line", 0, Time[40], H3);
        }
      if(ObjectFind("L3 line")!=0)
        {
         ObjectCreate("L3 line", OBJ_HLINE, 0, Time[40], L3);
         ObjectSet("L3 line", OBJPROP_STYLE, STYLE_DASHDOTDOT);
         ObjectSet("L3 line", OBJPROP_COLOR, Yellow);
        }
      else
        {
         ObjectMove("L3 line", 0, Time[40], L3);
        }
      if(ObjectFind("L4 line")!=0)
        {
         ObjectCreate("L4 line", OBJ_HLINE, 0, Time[40], L4);
         ObjectSet("L4 line", OBJPROP_STYLE, STYLE_DASHDOTDOT);
         ObjectSet("L4 line", OBJPROP_COLOR, Yellow);
        }
      else
        {
         ObjectMove("L4 line", 0, Time[40], L4);
        }
     }
//-------End of Draw Camarilla Lines
//------ Midpoints Pivots
   if (midpivots==true)
     {
      if(ObjectFind("M5 label")!=0)
        {
         ObjectCreate("M5 label", OBJ_TEXT, 0, Time[20], M5);
         ObjectSetText("M5 label", " M5", 8, "Arial", White);
        }
      else
        {
         ObjectMove("M5 label", 0, Time[20], M5);
        }
      if(ObjectFind("M4 label")!=0)
        {
         ObjectCreate("M4 label", OBJ_TEXT, 0, Time[20], M4);
         ObjectSetText("M4 label", " M4", 8, "Arial", White);
        }
      else
        {
         ObjectMove("M4 label", 0, Time[20], M4);
        }
      if(ObjectFind("M3 label")!=0)
        {
         ObjectCreate("M3 label", OBJ_TEXT, 0, Time[20], M3);
         ObjectSetText("M3 label", " M3", 8, "Arial", White);
        }
      else
        {
         ObjectMove("M3 label", 0, Time[20], M3);
        }
      if(ObjectFind("M2 label")!=0)
        {
         ObjectCreate("M2 label", OBJ_TEXT, 0, Time[20], M2);
         ObjectSetText("M2 label", " M2", 8, "Arial", White);
        }
      else
        {
         ObjectMove("M2 label", 0, Time[20], M2);
        }
      if(ObjectFind("M1 label")!=0)
        {
         ObjectCreate("M1 label", OBJ_TEXT, 0, Time[20], M1);
         ObjectSetText("M1 label", " M1", 8, "Arial", White);
        }
      else
        {
         ObjectMove("M1 label", 0, Time[20], M1);
        }
      if(ObjectFind("M0 label")!=0)
        {
         ObjectCreate("M0 label", OBJ_TEXT, 0, Time[20], M0);
         ObjectSetText("M0 label", " M0", 8, "Arial", White);
        }
      else
        {
         ObjectMove("M0 label", 0, Time[20], M0);
        }
      //---- Draw Midpoint Pivots on Chart
      if(ObjectFind("M5 line")!=0)
        {
         ObjectCreate("M5 line", OBJ_HLINE, 0, Time[40], M5);
         ObjectSet("M5 line", OBJPROP_STYLE, STYLE_DASHDOTDOT);
         ObjectSet("M5 line", OBJPROP_COLOR, Blue);
        }
      else
        {
         ObjectMove("M5 line", 0, Time[40], M5);
        }
      if(ObjectFind("M4 line")!=0)
        {
         ObjectCreate("M4 line", OBJ_HLINE, 0, Time[40], M4);
         ObjectSet("M4 line", OBJPROP_STYLE, STYLE_DASHDOTDOT);
         ObjectSet("M4 line", OBJPROP_COLOR, Blue);
        }
      else
        {
         ObjectMove("M4 line", 0, Time[40], M4);
        }
      if(ObjectFind("M3 line")!=0)
        {
         ObjectCreate("M3 line", OBJ_HLINE, 0, Time[40], M3);
         ObjectSet("M3 line", OBJPROP_STYLE, STYLE_DASHDOTDOT);
         ObjectSet("M3 line", OBJPROP_COLOR, Blue);
        }
      else
        {
         ObjectMove("M3 line", 0, Time[40], M3);
        }
      if(ObjectFind("M2 line")!=0)
        {
         ObjectCreate("M2 line", OBJ_HLINE, 0, Time[40], M2);
         ObjectSet("M2 line", OBJPROP_STYLE, STYLE_DASHDOTDOT);
         ObjectSet("M2 line", OBJPROP_COLOR, Blue);
        }
      else
        {
         ObjectMove("M2 line", 0, Time[40], M2);
        }
      if(ObjectFind("M1 line")!=0)
        {
         ObjectCreate("M1 line", OBJ_HLINE, 0, Time[40], M1);
         ObjectSet("M1 line", OBJPROP_STYLE, STYLE_DASHDOTDOT);
         ObjectSet("M1 line", OBJPROP_COLOR, Blue);
        }
      else
        {
         ObjectMove("M1 line", 0, Time[40], M1);
        }
      if(ObjectFind("M0 line")!=0)
        {
         ObjectCreate("M0 line", OBJ_HLINE, 0, Time[40], M0);
         ObjectSet("M0 line", OBJPROP_STYLE, STYLE_DASHDOTDOT);
         ObjectSet("M0 line", OBJPROP_COLOR, Blue);
        }
      else
        {
         ObjectMove("M0 line", 0, Time[40], M0);
        }
     }
//----End of Midpoint Pivots Draw
//---- End Of Program
   return(0);
  }
//+------------------------------------------------------------------+
Comments