Pivot Lines_v2
Download script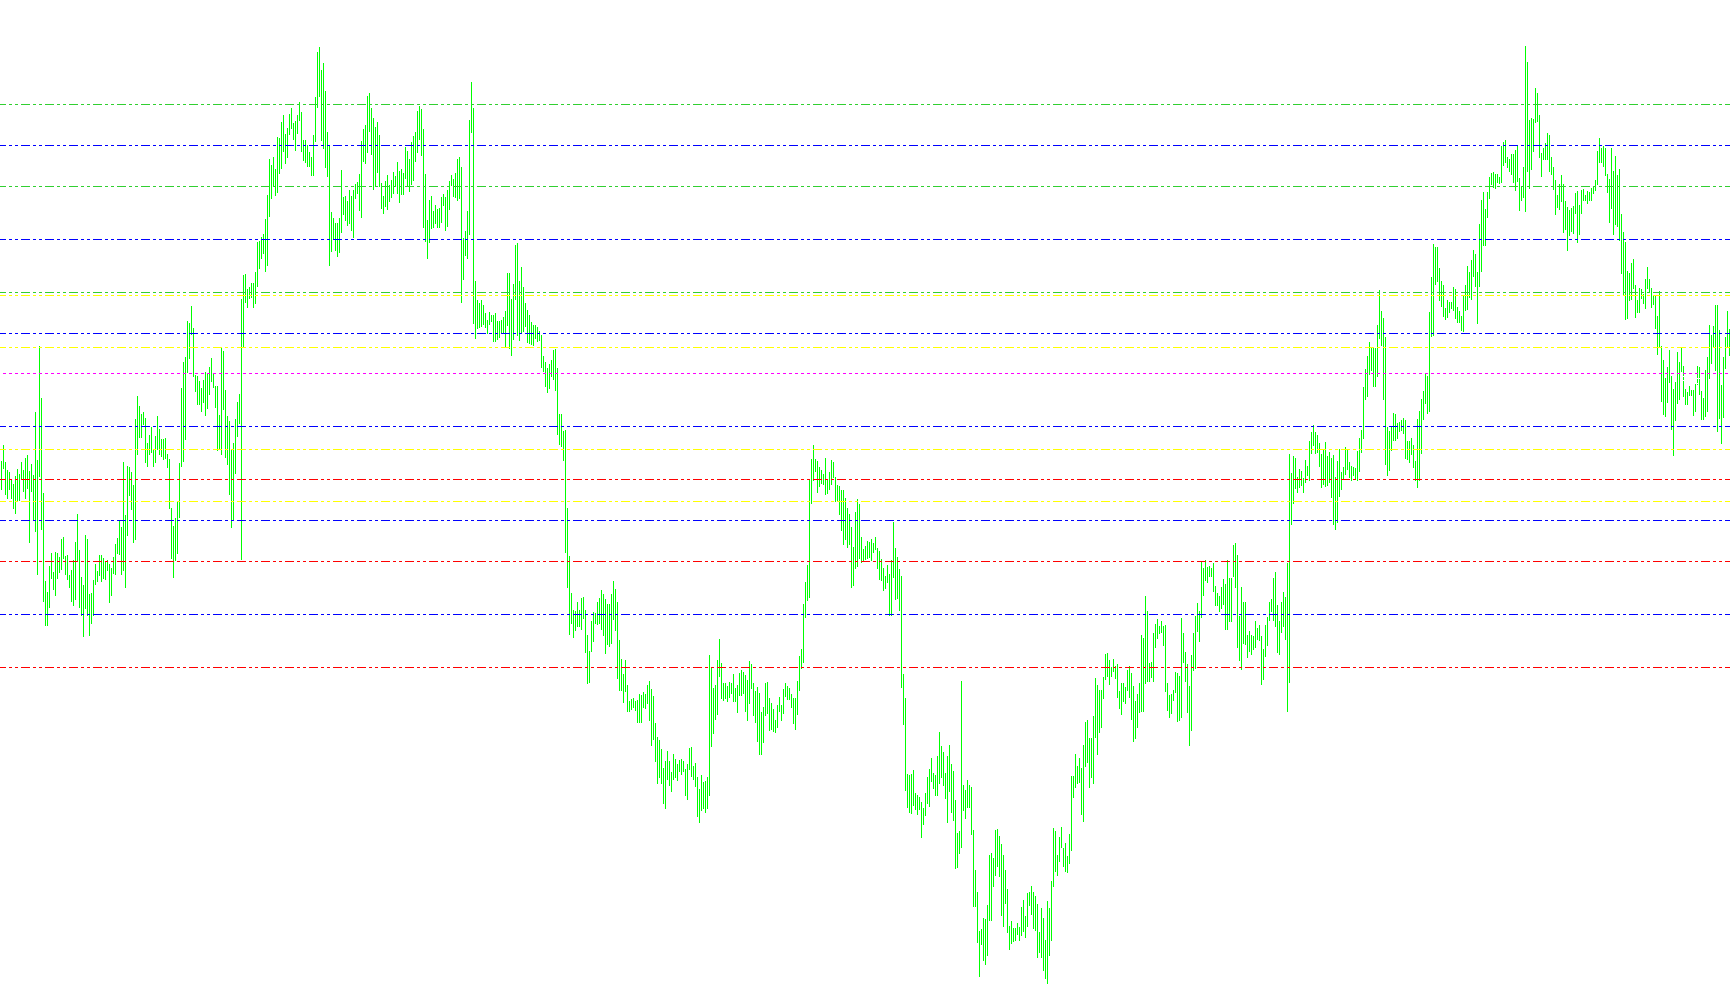
This script is designed as a technical analysis tool for the MetaTrader 4 platform. Its primary purpose is to automatically identify and display various price "levels" on your trading charts based on historical daily price action. By visualizing these levels, traders can better identify potential areas of support, resistance, and equilibrium.
Core Functionality
The script functions by analyzing the high, low, open, and closing prices from previous trading sessions (specifically looking at yesterday's data). It then performs a series of mathematical calculations to project several distinct types of "Pivot" levels onto your current chart.
Key Components & Features
1. Daily Pivot Points The script calculates standard pivot points which are used to determine the sentiment of the market. It identifies:
- The Main Pivot (P): The central equilibrium point calculated from yesterday's high, low, and close.
- Resistance Levels (R1, R2, R3): Specific price ceilings where upward momentum may stall or face selling pressure.
- Support Levels (S1, S2, S3): Specific price floors where downward momentum may exhaust or find buying interest.
2. Camarilla Levels These are specialized price levels often used by day traders to identify "breakout" zones. The script specifically calculates:
- H3/L3: Levels that often represent the boundaries for range trading.
- H4/L4: Higher-range levels that signal potential breakout points for the current session.
3. Midpoint Pivots The script includes a "Midpoint" calculation logic. This breaks down the space between the major pivot and resistance/support lines into smaller, granular sub-levels (M0 through M5). These provide traders with more precise "micro-zones" to watch for price reactions within larger ranges.
Visual Presentation
To ensure the data is easy to read, the script handles all the heavy lifting regarding the chart's appearance:
- Automatic Drawing: It creates horizontal lines and text labels automatically so you don't have to plot them manually.
- Color Coding: Different levels are assigned distinct colors (such as LimeGreen for Resistance, Red for Support, Yellow for Camarilla, and Blue/Magenta for others) to allow for instant visual recognition.
- Dynamic Updates: The script is designed to update these lines in real-time as new price data becomes available, ensuring the levels stay current with the market.
Operational Constraints
For the logic to work correctly, the script requires the user to be viewing a time frame smaller than one day (such as 1-hour or 15-minute charts). If a larger timeframe is used, the script will notify the user that the period is too large for the calculation to be meaningful.
/*-----------------------------+
|			       |
| Shared by www.Aptrafx.com    |
|			       |
+------------------------------*/

//+------------------------------------------------------------------+
//|                                                        Pivot.mq4 |
//|                      Copyright © 2004, MetaQuotes Software Corp. |
//|                                        http://www.metaquotes.net |
//+------------------------------------------------------------------+
#property copyright "Copyright © 2004, MetaQuotes Software Corp."
#property link      "http://www.metaquotes.net"

#property indicator_chart_window

extern bool pivots = true;
extern bool camarilla = true;
extern bool midpivots = true;

double day_high=0;
double day_low=0;
double yesterday_high=0;
double yesterday_open=0;
double yesterday_low=0;
double yesterday_close=0;
double today_open=0;
double today_high=0;
double today_low=0;
double P=0;
double Q=0;
double R1,R2,R3;
double M0,M1,M2,M3,M4,M5;
double S1,S2,S3;
double H4,H3,L4,L3;
double nQ=0;
double nD=0;
double D=0;
double rates_d1[2][6];

//+------------------------------------------------------------------+
//| Custom indicator initialization function                         |
//+------------------------------------------------------------------+
int init()
  {
//---- indicators
 R1=0; R2=0; R3=0;
 M0=0; M1=0; M2=0; M3=0; M4=0; M5=0;
 S1=0; S2=0; S3=0;
 H4=0; H3=0; L4=0; L3=0;

//----
   return(0);
  }
//+------------------------------------------------------------------+
//| Custor indicator deinitialization function                       |
//+------------------------------------------------------------------+
int deinit()
  {
//---- TODO: add your code here
ObjectDelete("R1 Label");
ObjectDelete("R1 Line");
ObjectDelete("R2 Label");
ObjectDelete("R2 Line");
ObjectDelete("R3 Label");
ObjectDelete("R3 Line");
ObjectDelete("S1 Label");
ObjectDelete("S1 Line");
ObjectDelete("S2 Label");
ObjectDelete("S2 Line");
ObjectDelete("S3 Label");
ObjectDelete("S3 Line");
ObjectDelete("P Label");
ObjectDelete("P Line");
ObjectDelete("H4 Label");
ObjectDelete("H4 Line");
ObjectDelete("H3 Label");
ObjectDelete("H3 Line");
ObjectDelete("L3 Label");
ObjectDelete("L3 Line");
ObjectDelete("L4 Label");
ObjectDelete("L4 Line");
ObjectDelete("M5 Label");
ObjectDelete("M5 Line");
ObjectDelete("M4 Label");
ObjectDelete("M4 Line");
ObjectDelete("M3 Label");
ObjectDelete("M3 Line");
ObjectDelete("M2 Label");
ObjectDelete("M2 Line");
ObjectDelete("M1 Label");
ObjectDelete("M1 Line");
ObjectDelete("M0 Label");
ObjectDelete("M0 Line");
//----
   return(0);
  }
//+------------------------------------------------------------------+
//| Custom indicator iteration function                              |
//+------------------------------------------------------------------+
int start()
  {

//---- TODO: add your code here

//---- exit if period is greater than daily charts
if(Period() > 1440)
{
Print("Error - Chart period is greater than 1 day.");
return(-1); // then exit
}

//---- Get new daily prices

ArrayCopyRates(rates_d1, Symbol(), PERIOD_D1);

yesterday_close = rates_d1[1][4];
yesterday_open = rates_d1[1][1];
today_open = rates_d1[0][1];
yesterday_high = rates_d1[1][3];
yesterday_low = rates_d1[1][2];
day_high = rates_d1[0][3];
day_low = rates_d1[0][2];


//---- Calculate Pivots

D = (day_high - day_low);
Q = (yesterday_high - yesterday_low);
P = (yesterday_high + yesterday_low + yesterday_close) / 3;
R1 = (2*P)-yesterday_low;
S1 = (2*P)-yesterday_high;
R2 = P+(yesterday_high - yesterday_low);
S2 = P-(yesterday_high - yesterday_low);

	H4 = (Q*0.55)+yesterday_close;
	H3 = (Q*0.27)+yesterday_close;
	R3 = (2*P)+(yesterday_high-(2*yesterday_low));
	M5 = (R2+R3)/2;
//	R2 = P-S1+R1;
	M4 = (R1+R2)/2;
//	R1 = (2*P)-yesterday_low;
	M3 = (P+R1)/2;
//	P = (yesterday_high + yesterday_low + yesterday_close)/3;
	M2 = (P+S1)/2;
//	S1 = (2*P)-yesterday_high;
	M1 = (S1+S2)/2;
//	S2 = P-R1+S1;
	S3 = (2*P)-((2* yesterday_high)-yesterday_low);
	L3 = yesterday_close-(Q*0.27);
	L4 = yesterday_close-(Q*0.55);
	M0 = (S2+S3)/2;

if (Q > 5)
{
	nQ = Q;
}
else
{
	nQ = Q*10000;
};

if (D > 5)
{
	nD = D;
}
else
{
	nD = D*10000;
};


Comment("High= ",yesterday_high,"    Previous Days Range= ",nQ,"\nLow= ",yesterday_low,"    Current Days Range= ",nD,"\nClose= ",yesterday_close);

//---- Set line labels on chart window

//---- Pivot Lines
   if (pivots==true)
   {
      if(ObjectFind("R1 label") != 0)
      {
      ObjectCreate("R1 label", OBJ_TEXT, 0, Time[20], R1);
      ObjectSetText("R1 label", " R1", 8, "Arial", White);
      }
      else
      {
      ObjectMove("R1 label", 0, Time[20], R1);
      }

      if(ObjectFind("R2 label") != 0)
      {
      ObjectCreate("R2 label", OBJ_TEXT, 0, Time[20], R2);
      ObjectSetText("R2 label", " R2", 8, "Arial", White);
      }
      else
      {
      ObjectMove("R2 label", 0, Time[20], R2);
      }

      if(ObjectFind("R3 label") != 0)
      {
      ObjectCreate("R3 label", OBJ_TEXT, 0, Time[20], R3);
      ObjectSetText("R3 label", " R3", 8, "Arial", White);
      }
      else
      {
      ObjectMove("R3 label", 0, Time[20], R3);
      }

      if(ObjectFind("P label") != 0)
      {
      ObjectCreate("P label", OBJ_TEXT, 0, Time[20], P);
      ObjectSetText("P label", "Pivot", 8, "Arial", White);
      }
      else
      {
      ObjectMove("P label", 0, Time[20], P);
      }

      if(ObjectFind("S1 label") != 0)
      {
      ObjectCreate("S1 label", OBJ_TEXT, 0, Time[20], S1);
      ObjectSetText("S1 label", "S1", 8, "Arial", White);
      }
      else
      {
      ObjectMove("S1 label", 0, Time[20], S1);
      }

      if(ObjectFind("S2 label") != 0)
      {
      ObjectCreate("S2 label", OBJ_TEXT, 0, Time[20], S2);
      ObjectSetText("S2 label", "S2", 8, "Arial", White);
      }
      else
      {
      ObjectMove("S2 label", 0, Time[20], S2);
      }

      if(ObjectFind("S3 label") != 0)
      {
      ObjectCreate("S3 label", OBJ_TEXT, 0, Time[20], S3);
      ObjectSetText("S3 label", "S3", 8, "Arial", White);
      }
      else
      {
      ObjectMove("S3 label", 0, Time[20], S3);
      }

//---  Draw  Pivot lines on chart
      if(ObjectFind("S1 line") != 0)
      {
      ObjectCreate("S1 line", OBJ_HLINE, 0, Time[40], S1);
      ObjectSet("S1 line", OBJPROP_STYLE, STYLE_DASHDOTDOT);
      ObjectSet("S1 line", OBJPROP_COLOR, Red);
      }
      else
      {
      ObjectMove("S1 line", 0, Time[40], S1);
      }

      if(ObjectFind("S2 line") != 0)
      {
      ObjectCreate("S2 line", OBJ_HLINE, 0, Time[40], S2);
      ObjectSet("S2 line", OBJPROP_STYLE, STYLE_DASHDOTDOT);
      ObjectSet("S2 line", OBJPROP_COLOR, Red);
      }
      else
      {
      ObjectMove("S2 line", 0, Time[40], S2);
      }

      if(ObjectFind("S3 line") != 0)
      {
      ObjectCreate("S3 line", OBJ_HLINE, 0, Time[40], S3);
      ObjectSet("S3 line", OBJPROP_STYLE, STYLE_DASHDOTDOT);
      ObjectSet("S3 line", OBJPROP_COLOR, Red);
      }
      else
      {
      ObjectMove("S3 line", 0, Time[40], S3);
      }

      if(ObjectFind("P line") != 0)
      {
      ObjectCreate("P line", OBJ_HLINE, 0, Time[40], P);
      ObjectSet("P line", OBJPROP_STYLE, STYLE_DOT);
      ObjectSet("P line", OBJPROP_COLOR, Magenta);
      }
      else
      {
      ObjectMove("P line", 0, Time[40], P);
      }

      if(ObjectFind("R1 line") != 0)
      {
      ObjectCreate("R1 line", OBJ_HLINE, 0, Time[40], R1);
      ObjectSet("R1 line", OBJPROP_STYLE, STYLE_DASHDOTDOT);
      ObjectSet("R1 line", OBJPROP_COLOR, LimeGreen);
      }
      else
      {
      ObjectMove("R1 line", 0, Time[40], R1);
      }

      if(ObjectFind("R2 line") != 0)
      {
      ObjectCreate("R2 line", OBJ_HLINE, 0, Time[40], R2);
      ObjectSet("R2 line", OBJPROP_STYLE, STYLE_DASHDOTDOT);
      ObjectSet("R2 line", OBJPROP_COLOR, LimeGreen);
      }
      else
      {
      ObjectMove("R2 line", 0, Time[40], R2);
      }

      if(ObjectFind("R3 line") != 0)
      {
      ObjectCreate("R3 line", OBJ_HLINE, 0, Time[40], R3);
      ObjectSet("R3 line", OBJPROP_STYLE, STYLE_DASHDOTDOT);
      ObjectSet("R3 line", OBJPROP_COLOR, LimeGreen);
      }
      else
      {
      ObjectMove("R3 line", 0, Time[40], R3);
      }
   }
//---- End of Pivot Line Draw


//----- Camarilla Lines

   if (camarilla==true)
   {
      if(ObjectFind("H4 label") != 0)
      {
      ObjectCreate("H4 label", OBJ_TEXT, 0, Time[20], H4);
      ObjectSetText("H4 label", " H4", 8, "Arial", White);
      }
      else
      {
      ObjectMove("H4 label", 0, Time[20], H4);
      }

      if(ObjectFind("H3 label") != 0)
      {
      ObjectCreate("H3 label", OBJ_TEXT, 0, Time[20], H3);
      ObjectSetText("H3 label", " H3", 8, "Arial", White);
      }
      else
      {
      ObjectMove("H3 label", 0, Time[20], H3);
      }

      if(ObjectFind("L3 label") != 0)
      {
      ObjectCreate("L3 label", OBJ_TEXT, 0, Time[20], L3);
      ObjectSetText("L3 label", " L3", 8, "Arial", White);
      }
      else
      {
      ObjectMove("L3 label", 0, Time[20], L3);
      }

      if(ObjectFind("L4 label") != 0)
      {
      ObjectCreate("L4 label", OBJ_TEXT, 0, Time[20], L4);
      ObjectSetText("L4 label", " L4", 8, "Arial", White);
      }
      else
      {
      ObjectMove("L4 label", 0, Time[20], L4);
      }

//---- Draw Camarilla lines on Chart
      if(ObjectFind("H4 line") != 0)
      {
      ObjectCreate("H4 line", OBJ_HLINE, 0, Time[40], H4);
      ObjectSet("H4 line", OBJPROP_STYLE, STYLE_DASHDOTDOT);
      ObjectSet("H4 line", OBJPROP_COLOR, Yellow);
      }
      else
      {
      ObjectMove("H4 line", 0, Time[40], H4);
      }

      if(ObjectFind("H3 line") != 0)
      {
      ObjectCreate("H3 line", OBJ_HLINE, 0, Time[40], H3);
      ObjectSet("H3 line", OBJPROP_STYLE, STYLE_DASHDOTDOT);
      ObjectSet("H3 line", OBJPROP_COLOR, Yellow);
      }
      else
      {
      ObjectMove("H3 line", 0, Time[40], H3);
      }

      if(ObjectFind("L3 line") != 0)
      {
      ObjectCreate("L3 line", OBJ_HLINE, 0, Time[40], L3);
      ObjectSet("L3 line", OBJPROP_STYLE, STYLE_DASHDOTDOT);
      ObjectSet("L3 line", OBJPROP_COLOR, Yellow);
      }
      else
      {
      ObjectMove("L3 line", 0, Time[40], L3);
      }

      if(ObjectFind("L4 line") != 0)
      {
      ObjectCreate("L4 line", OBJ_HLINE, 0, Time[40], L4);
      ObjectSet("L4 line", OBJPROP_STYLE, STYLE_DASHDOTDOT);
      ObjectSet("L4 line", OBJPROP_COLOR, Yellow);
      }
      else
      {
      ObjectMove("L4 line", 0, Time[40], L4);
      }
   }
//-------End of Draw Camarilla Lines

//------ Midpoints Pivots

   if (midpivots==true)
   {

      if(ObjectFind("M5 label") != 0)
      {
      ObjectCreate("M5 label", OBJ_TEXT, 0, Time[20], M5);
      ObjectSetText("M5 label", " M5", 8, "Arial", White);
      }
      else
      {
      ObjectMove("M5 label", 0, Time[20], M5);
      }

      if(ObjectFind("M4 label") != 0)
      {
      ObjectCreate("M4 label", OBJ_TEXT, 0, Time[20], M4);
      ObjectSetText("M4 label", " M4", 8, "Arial", White);
      }
      else
      {
      ObjectMove("M4 label", 0, Time[20], M4);
      }

      if(ObjectFind("M3 label") != 0)
      {
      ObjectCreate("M3 label", OBJ_TEXT, 0, Time[20], M3);
      ObjectSetText("M3 label", " M3", 8, "Arial", White);
      }
      else
      {
      ObjectMove("M3 label", 0, Time[20], M3);
      }

      if(ObjectFind("M2 label") != 0)
      {
      ObjectCreate("M2 label", OBJ_TEXT, 0, Time[20], M2);
      ObjectSetText("M2 label", " M2", 8, "Arial", White);
      }
      else
      {
      ObjectMove("M2 label", 0, Time[20], M2);
      }

      if(ObjectFind("M1 label") != 0)
      {
      ObjectCreate("M1 label", OBJ_TEXT, 0, Time[20], M1);
      ObjectSetText("M1 label", " M1", 8, "Arial", White);
      }
      else
      {
      ObjectMove("M1 label", 0, Time[20], M1);
      }

      if(ObjectFind("M0 label") != 0)
      {
      ObjectCreate("M0 label", OBJ_TEXT, 0, Time[20], M0);
      ObjectSetText("M0 label", " M0", 8, "Arial", White);
      }
      else
      {
      ObjectMove("M0 label", 0, Time[20], M0);
      }

//---- Draw Midpoint Pivots on Chart
      if(ObjectFind("M5 line") != 0)
      {
      ObjectCreate("M5 line", OBJ_HLINE, 0, Time[40], M5);
      ObjectSet("M5 line", OBJPROP_STYLE, STYLE_DASHDOTDOT);
      ObjectSet("M5 line", OBJPROP_COLOR, Blue);
      }
      else
      {
      ObjectMove("M5 line", 0, Time[40], M5);
      }

      if(ObjectFind("M4 line") != 0)
      {
      ObjectCreate("M4 line", OBJ_HLINE, 0, Time[40], M4);
      ObjectSet("M4 line", OBJPROP_STYLE, STYLE_DASHDOTDOT);
      ObjectSet("M4 line", OBJPROP_COLOR, Blue);
      }
      else
      {
      ObjectMove("M4 line", 0, Time[40], M4);
      }

      if(ObjectFind("M3 line") != 0)
      {
      ObjectCreate("M3 line", OBJ_HLINE, 0, Time[40], M3);
      ObjectSet("M3 line", OBJPROP_STYLE, STYLE_DASHDOTDOT);
      ObjectSet("M3 line", OBJPROP_COLOR, Blue);
      }
      else
      {
      ObjectMove("M3 line", 0, Time[40], M3);
      }

      if(ObjectFind("M2 line") != 0)
      {
      ObjectCreate("M2 line", OBJ_HLINE, 0, Time[40], M2);
      ObjectSet("M2 line", OBJPROP_STYLE, STYLE_DASHDOTDOT);
      ObjectSet("M2 line", OBJPROP_COLOR, Blue);
      }
      else
      {
      ObjectMove("M2 line", 0, Time[40], M2);
      }

      if(ObjectFind("M1 line") != 0)
      {
      ObjectCreate("M1 line", OBJ_HLINE, 0, Time[40], M1);
      ObjectSet("M1 line", OBJPROP_STYLE, STYLE_DASHDOTDOT);
      ObjectSet("M1 line", OBJPROP_COLOR, Blue);
      }
      else
      {
      ObjectMove("M1 line", 0, Time[40], M1);
      }

      if(ObjectFind("M0 line") != 0)
      {
      ObjectCreate("M0 line", OBJ_HLINE, 0, Time[40], M0);
      ObjectSet("M0 line", OBJPROP_STYLE, STYLE_DASHDOTDOT);
      ObjectSet("M0 line", OBJPROP_COLOR, Blue);
      }
      else
      {
      ObjectMove("M0 line", 0, Time[40], M0);
      }

   }
//----End of Midpoint Pivots Draw

//---- End Of Program
   return(0);
  }
//+------------------------------------------------------------------+
Comments