Pivot Lines Timezone_v4
Download script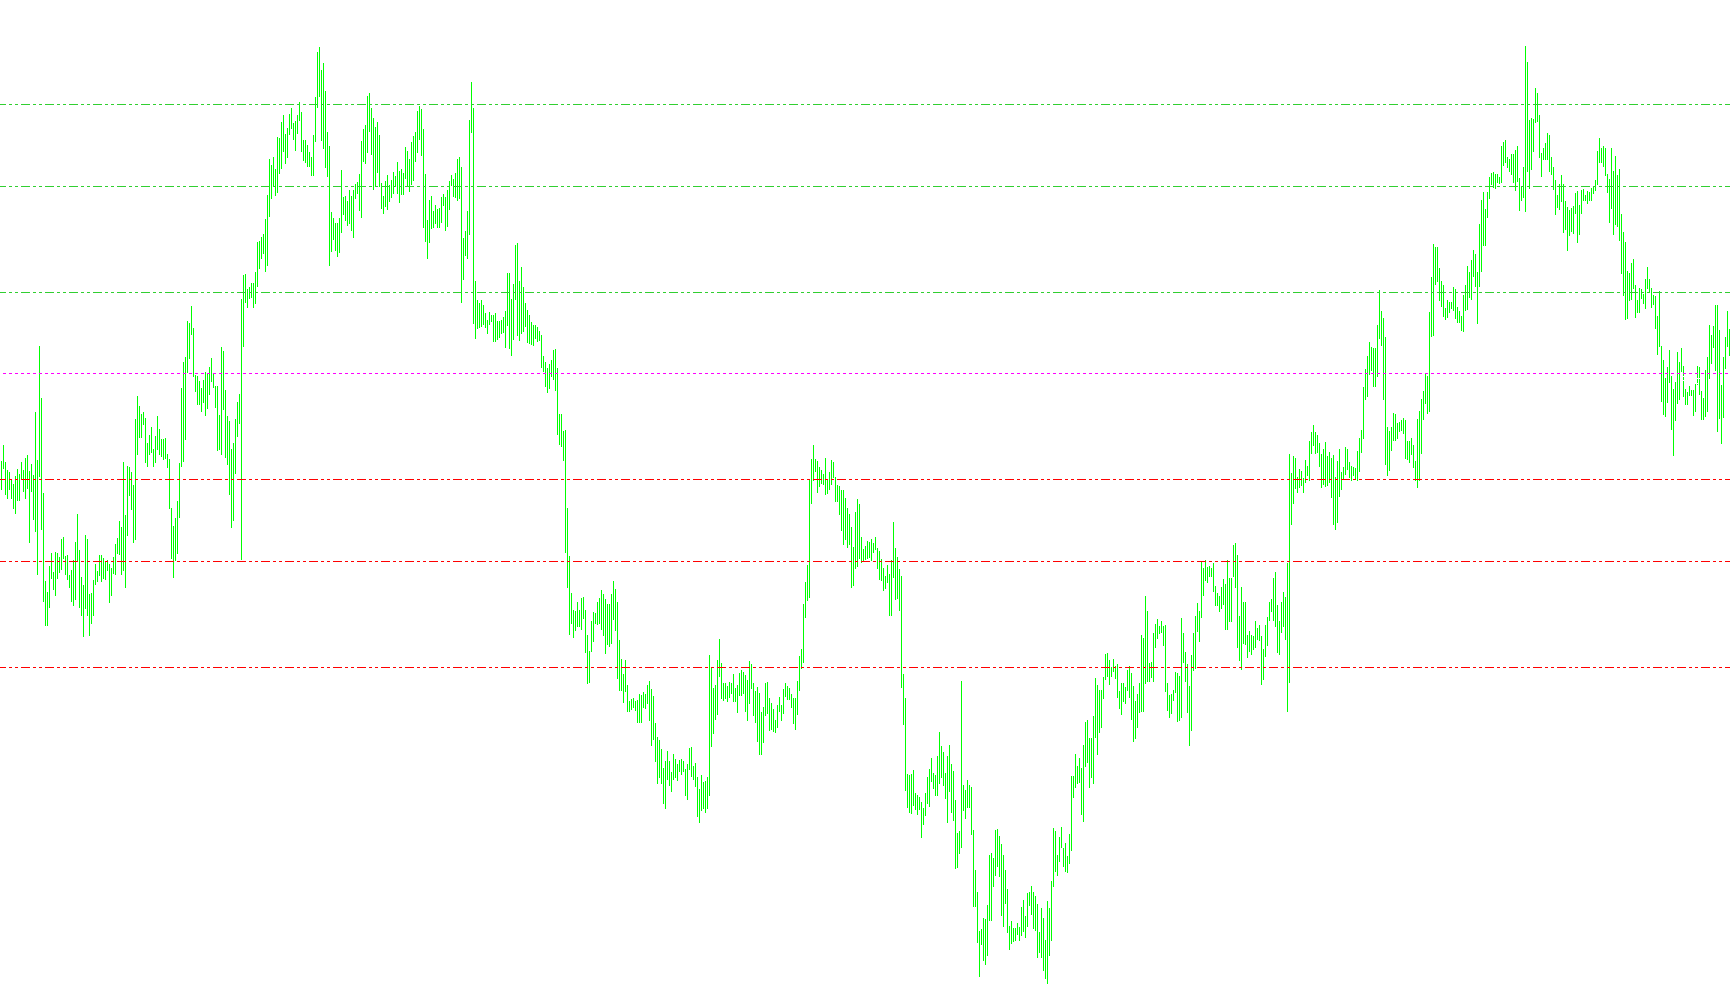
Overview of the Pivot Lines Timezone Tool
This script is designed to automatically calculate and display various mathematical price levels—known as "Pivot Points"—directly on your trading charts. These levels are essential for traders who use technical analysis to identify potential support (where price might stop falling) and resistance (where price might stop rising).
How the Logic Works
The tool operates by gathering historical data from previous trading sessions and applying specific mathematical formulas to project key price zones for the current day. Here is a breakdown of its core logic:
1. Data Collection The script first looks at two main types of data:
- Daily Records: It identifies the highest and lowest prices reached during the previous full day.
- Hourly Records: It scans hourly price movements to pinpoint exactly when the previous day opened, closed, and reached its highs and lows. It uses a "Time Zone" setting to ensure it aligns with your specific local trading time.
2. Automated Calculations Once the data is collected, the script performs several different types of calculations based on your preferences:
- Standard Pivot Points: These are the classic levels (P, R1, R2, R3, S1, S2, S3). The "Pivot" (P) is calculated as the average of the previous day's high, low, and close. The Resistance (R) and Support (S) levels are then derived from that central pivot to show where the price might push higher or lower.
- Camarilla Levels: This is a specific set of volatility-based levels (H3, H4, L3, L4). These are often used by day traders to identify "breakout" points for the current session based on the previous day's range.
- Midpoint Pivots: The script can also calculate intermediate levels between the main pivots (M0 through M5), providing a more granular view of the price action.
3. Dynamic Chart Display Instead of just giving you numbers in a list, the script interacts with your visual chart:
- Automatic Drawing: It draws horizontal lines and text labels automatically.
- Real-Time Updates: As new price data comes in, the script moves these lines to their new correct positions so your chart remains up to date.
- Visual Organization: It uses specific colors (such as LimeGreen for Resistance, Red for Support, Magenta for the Pivot, and Blue/Yellow for specialized levels) to help you distinguish between different types of price zones at a glance.
User Constraints and Features
- Timeframe Awareness: To ensure accuracy, the script includes a safety check. It will notify you if you try to use it on a chart timeframe larger than one day (like weekly or monthly), as the daily pivot logic requires daily data context.
- Customization: You can toggle each specific set of levels (Pivots, Camarilla, or Midpoints) on or off via the settings menu, allowing you to declutter your chart and only see the information relevant to your trading style.
/*-----------------------------+
|			       |
| Shared by www.Aptrafx.com    |
|			       |
+------------------------------*/

//+-------------------------------------------------------------------+
//|                                          Pivot Lines Timezone.mq4 |
//+-------------------------------------------------------------------+
//|                                          Pivot Lines TimeZone.mq4 |
//|                       Copyright © 2004, MetaQuotes Software Corp. |
//|                                         http://www.metaquotes.net |
//|                                Made/Modified by Alejandro Galindo |
//|                                                                   |
//|                                                                   |
//|                                       help me to continue coding  |
//|                                PayPal donation to ag@elcactus.com |
//+-------------------------------------------------------------------+
#property copyright "Copyright © 2004, MetaQuotes Software Corp."
#property link      "http://www.metaquotes.net"
#property indicator_buffers 5
#property indicator_chart_window

extern int TimeZone=0;
extern bool pivots = true;
extern bool camarilla = false;
extern bool midpivots = false;

double day_high=0;
double day_low=0;
double yesterday_high=0;
double yesterday_open=0;
double yesterday_low=0;
double yesterday_close=0;
double today_open=0;
double today_high=0;
double today_low=0;
double P=0;
double Q=0;
double R1,R2,R3;
double M0,M1,M2,M3,M4,M5;
double S1,S2,S3;
double H4,H3,L4,L3;
double nQ=0;
double nD=0;
double D=0;
double rates_h1[2][6];
double rates_d1[2][6];
double pivotbuffer[];
double s1buffer[];
double r1buffer[];
double s2buffer[];
double r2buffer[];

//+------------------------------------------------------------------+
//| Custom indicator initialization function                         |
//+------------------------------------------------------------------+
int init()
  {
//---- indicators
 R1=0; R2=0; R3=0;
 M0=0; M1=0; M2=0; M3=0; M4=0; M5=0;
 S1=0; S2=0; S3=0;
 H4=0; H3=0; L4=0; L3=0;

 SetIndexStyle(0,DRAW_LINE,EMPTY);
 SetIndexBuffer(0, pivotbuffer);
 SetIndexStyle(1,DRAW_LINE,EMPTY);
 SetIndexBuffer(1, s1buffer);
 SetIndexStyle(2,DRAW_LINE,EMPTY);
 SetIndexBuffer(2, r1buffer);
 SetIndexStyle(3,DRAW_LINE,EMPTY);
 SetIndexBuffer(4, s2buffer);
 SetIndexStyle(5,DRAW_LINE,EMPTY);
 SetIndexBuffer(5, r2buffer);


//----
   return(0);
  }
//+------------------------------------------------------------------+
//| Custor indicator deinitialization function                       |
//+------------------------------------------------------------------+
int deinit()
  {
//---- TODO: add your code here
ObjectDelete("R1 Label");
ObjectDelete("R1 Line");
ObjectDelete("R2 Label");
ObjectDelete("R2 Line");
ObjectDelete("R3 Label");
ObjectDelete("R3 Line");
ObjectDelete("S1 Label");
ObjectDelete("S1 Line");
ObjectDelete("S2 Label");
ObjectDelete("S2 Line");
ObjectDelete("S3 Label");
ObjectDelete("S3 Line");
ObjectDelete("P Label");
ObjectDelete("P Line");
ObjectDelete("H4 Label");
ObjectDelete("H4 Line");
ObjectDelete("H3 Label");
ObjectDelete("H3 Line");
ObjectDelete("L3 Label");
ObjectDelete("L3 Line");
ObjectDelete("L4 Label");
ObjectDelete("L4 Line");
ObjectDelete("M5 Label");
ObjectDelete("M5 Line");
ObjectDelete("M4 Label");
ObjectDelete("M4 Line");
ObjectDelete("M3 Label");
ObjectDelete("M3 Line");
ObjectDelete("M2 Label");
ObjectDelete("M2 Line");
ObjectDelete("M1 Label");
ObjectDelete("M1 Line");
ObjectDelete("M0 Label");
ObjectDelete("M0 Line");
//----
   return(0);
  }
//+------------------------------------------------------------------+
//| Custom indicator iteration function                              |
//+------------------------------------------------------------------+
int start()
  {
      int i=0, j=0;
//---- TODO: add your code here

//---- exit if period is greater than daily charts
if(Period() > 1440)
{
Print("Error - Chart period is greater than 1 day.");
return(-1); // then exit
}

//---- Get new daily prices

ArrayCopyRates(rates_d1, Symbol(), PERIOD_D1);
yesterday_high = rates_d1[1][3];
yesterday_low = rates_d1[1][2];
day_high = rates_d1[0][3];
day_low = rates_d1[0][2];

ArrayCopyRates(rates_h1, Symbol(), PERIOD_H1);
for (i=0;i<=25;i++)
{
   if (TimeMinute(rates_h1[i][0])==0 && (TimeHour(rates_h1[i][0])-TimeZone)==0)
   {
      yesterday_close = rates_h1[i+1][4];
      yesterday_open = rates_h1[i+24][1];
      today_open = rates_h1[i][1];
      break;
   }
}

//---- Calculate Pivots

D = (day_high - day_low);
Q = (yesterday_high - yesterday_low);
P = (yesterday_high + yesterday_low + yesterday_close) / 3;
R1 = (2*P)-yesterday_low;
S1 = (2*P)-yesterday_high;
R2 = P+(yesterday_high - yesterday_low);
S2 = P-(yesterday_high - yesterday_low);

	H4 = (Q*0.55)+yesterday_close;
	H3 = (Q*0.27)+yesterday_close;
	R3 = (2*P)+(yesterday_high-(2*yesterday_low));
	M5 = (R2+R3)/2;
//	R2 = P-S1+R1;
	M4 = (R1+R2)/2;
//	R1 = (2*P)-yesterday_low;
	M3 = (P+R1)/2;
//	P = (yesterday_high + yesterday_low + yesterday_close)/3;
	M2 = (P+S1)/2;
//	S1 = (2*P)-yesterday_high;
	M1 = (S1+S2)/2;
//	S2 = P-R1+S1;
	S3 = (2*P)-((2* yesterday_high)-yesterday_low);
	L3 = yesterday_close-(Q*0.27);
	L4 = yesterday_close-(Q*0.55);
	M0 = (S2+S3)/2;

if (Q > 5)
{
	nQ = Q;
}
else
{
	nQ = Q*10000;
}

if (D > 5)
{
	nD = D;
}
else
{
	nD = D*10000;
}


Comment("High= ",yesterday_high,"    Previous Days Range= ",nQ,"\nLow= ",yesterday_low,"    Current Days Range= ",nD,"\nClose= ",yesterday_close,"\nOpen= ",yesterday_open);

//---- Set line labels on chart window

//---- Pivot Lines
   if (pivots==true)
   {
      if(ObjectFind("R1 label") != 0)
      {
      ObjectCreate("R1 label", OBJ_TEXT, 0, Time[20], R1);
      ObjectSetText("R1 label", " R1", 8, "Arial", Black);
      }
      else
      {
      ObjectMove("R1 label", 0, Time[20], R1);
      }
      r1buffer[0]=R1;

      if(ObjectFind("R2 label") != 0)
      {
      ObjectCreate("R2 label", OBJ_TEXT, 0, Time[20], R2);
      ObjectSetText("R2 label", " R2", 8, "Arial", Black);
      }
      else
      {
      ObjectMove("R2 label", 0, Time[20], R2);
      }
      r2buffer[0]=R2;

      if(ObjectFind("R3 label") != 0)
      {
      ObjectCreate("R3 label", OBJ_TEXT, 0, Time[20], R3);
      ObjectSetText("R3 label", " R3", 8, "Arial", Black);
      }
      else
      {
      ObjectMove("R3 label", 0, Time[20], R3);
      }

      if(ObjectFind("P label") != 0)
      {
      ObjectCreate("P label", OBJ_TEXT, 0, Time[20], P);
      ObjectSetText("P label", "Pivot", 8, "Arial", Black);
      }
      else
      {
      ObjectMove("P label", 0, Time[20], P);
      }
      pivotbuffer[0]=P;

      if(ObjectFind("S1 label") != 0)
      {
      ObjectCreate("S1 label", OBJ_TEXT, 0, Time[20], S1);
      ObjectSetText("S1 label", "S1", 8, "Arial", Black);
      }
      else
      {
      ObjectMove("S1 label", 0, Time[20], S1);
      }
      s1buffer[0]=S1;

      if(ObjectFind("S2 label") != 0)
      {
      ObjectCreate("S2 label", OBJ_TEXT, 0, Time[20], S2);
      ObjectSetText("S2 label", "S2", 8, "Arial", Black);
      }
      else
      {
      ObjectMove("S2 label", 0, Time[20], S2);
      }
      s2buffer[0]=S2;

      if(ObjectFind("S3 label") != 0)
      {
      ObjectCreate("S3 label", OBJ_TEXT, 0, Time[20], S3);
      ObjectSetText("S3 label", "S3", 8, "Arial", Black);
      }
      else
      {
      ObjectMove("S3 label", 0, Time[20], S3);
      }

//---  Draw  Pivot lines on chart
      if(ObjectFind("S1 line") != 0)
      {
      ObjectCreate("S1 line", OBJ_HLINE, 0, Time[40], S1);
      ObjectSet("S1 line", OBJPROP_STYLE, STYLE_DASHDOTDOT);
      ObjectSet("S1 line", OBJPROP_COLOR, Red);
      }
      else
      {
      ObjectMove("S1 line", 0, Time[40], S1);
      }

      if(ObjectFind("S2 line") != 0)
      {
      ObjectCreate("S2 line", OBJ_HLINE, 0, Time[40], S2);
      ObjectSet("S2 line", OBJPROP_STYLE, STYLE_DASHDOTDOT);
      ObjectSet("S2 line", OBJPROP_COLOR, Red);
      }
      else
      {
      ObjectMove("S2 line", 0, Time[40], S2);
      }

      if(ObjectFind("S3 line") != 0)
      {
      ObjectCreate("S3 line", OBJ_HLINE, 0, Time[40], S3);
      ObjectSet("S3 line", OBJPROP_STYLE, STYLE_DASHDOTDOT);
      ObjectSet("S3 line", OBJPROP_COLOR, Red);
      }
      else
      {
      ObjectMove("S3 line", 0, Time[40], S3);
      }

      if(ObjectFind("P line") != 0)
      {
      ObjectCreate("P line", OBJ_HLINE, 0, Time[40], P);
      ObjectSet("P line", OBJPROP_STYLE, STYLE_DOT);
      ObjectSet("P line", OBJPROP_COLOR, Magenta);
      }
      else
      {
      ObjectMove("P line", 0, Time[40], P);
      }

      if(ObjectFind("R1 line") != 0)
      {
      ObjectCreate("R1 line", OBJ_HLINE, 0, Time[40], R1);
      ObjectSet("R1 line", OBJPROP_STYLE, STYLE_DASHDOTDOT);
      ObjectSet("R1 line", OBJPROP_COLOR, LimeGreen);
      }
      else
      {
      ObjectMove("R1 line", 0, Time[40], R1);
      }

      if(ObjectFind("R2 line") != 0)
      {
      ObjectCreate("R2 line", OBJ_HLINE, 0, Time[40], R2);
      ObjectSet("R2 line", OBJPROP_STYLE, STYLE_DASHDOTDOT);
      ObjectSet("R2 line", OBJPROP_COLOR, LimeGreen);
      }
      else
      {
      ObjectMove("R2 line", 0, Time[40], R2);
      }

      if(ObjectFind("R3 line") != 0)
      {
      ObjectCreate("R3 line", OBJ_HLINE, 0, Time[40], R3);
      ObjectSet("R3 line", OBJPROP_STYLE, STYLE_DASHDOTDOT);
      ObjectSet("R3 line", OBJPROP_COLOR, LimeGreen);
      }
      else
      {
      ObjectMove("R3 line", 0, Time[40], R3);
      }
   }
//---- End of Pivot Line Draw


//----- Camarilla Lines

   if (camarilla==true)
   {
      if(ObjectFind("H4 label") != 0)
      {
      ObjectCreate("H4 label", OBJ_TEXT, 0, Time[20], H4);
      ObjectSetText("H4 label", " H4", 8, "Arial", Black);
      }
      else
      {
      ObjectMove("H4 label", 0, Time[20], H4);
      }

      if(ObjectFind("H3 label") != 0)
      {
      ObjectCreate("H3 label", OBJ_TEXT, 0, Time[20], H3);
      ObjectSetText("H3 label", " H3", 8, "Arial", Black);
      }
      else
      {
      ObjectMove("H3 label", 0, Time[20], H3);
      }

      if(ObjectFind("L3 label") != 0)
      {
      ObjectCreate("L3 label", OBJ_TEXT, 0, Time[20], L3);
      ObjectSetText("L3 label", " L3", 8, "Arial", Black);
      }
      else
      {
      ObjectMove("L3 label", 0, Time[20], L3);
      }

      if(ObjectFind("L4 label") != 0)
      {
      ObjectCreate("L4 label", OBJ_TEXT, 0, Time[20], L4);
      ObjectSetText("L4 label", " L4", 8, "Arial", Black);
      }
      else
      {
      ObjectMove("L4 label", 0, Time[20], L4);
      }

//---- Draw Camarilla lines on Chart
      if(ObjectFind("H4 line") != 0)
      {
      ObjectCreate("H4 line", OBJ_HLINE, 0, Time[40], H4);
      ObjectSet("H4 line", OBJPROP_STYLE, STYLE_DASHDOTDOT);
      ObjectSet("H4 line", OBJPROP_COLOR, Yellow);
      }
      else
      {
      ObjectMove("H4 line", 0, Time[40], H4);
      }

      if(ObjectFind("H3 line") != 0)
      {
      ObjectCreate("H3 line", OBJ_HLINE, 0, Time[40], H3);
      ObjectSet("H3 line", OBJPROP_STYLE, STYLE_DASHDOTDOT);
      ObjectSet("H3 line", OBJPROP_COLOR, Yellow);
      }
      else
      {
      ObjectMove("H3 line", 0, Time[40], H3);
      }

      if(ObjectFind("L3 line") != 0)
      {
      ObjectCreate("L3 line", OBJ_HLINE, 0, Time[40], L3);
      ObjectSet("L3 line", OBJPROP_STYLE, STYLE_DASHDOTDOT);
      ObjectSet("L3 line", OBJPROP_COLOR, Yellow);
      }
      else
      {
      ObjectMove("L3 line", 0, Time[40], L3);
      }

      if(ObjectFind("L4 line") != 0)
      {
      ObjectCreate("L4 line", OBJ_HLINE, 0, Time[40], L4);
      ObjectSet("L4 line", OBJPROP_STYLE, STYLE_DASHDOTDOT);
      ObjectSet("L4 line", OBJPROP_COLOR, Yellow);
      }
      else
      {
      ObjectMove("L4 line", 0, Time[40], L4);
      }
   }
//-------End of Draw Camarilla Lines

//------ Midpoints Pivots

   if (midpivots==true)
   {

      if(ObjectFind("M5 label") != 0)
      {
      ObjectCreate("M5 label", OBJ_TEXT, 0, Time[20], M5);
      ObjectSetText("M5 label", " M5", 8, "Arial", Black);
      }
      else
      {
      ObjectMove("M5 label", 0, Time[20], M5);
      }

      if(ObjectFind("M4 label") != 0)
      {
      ObjectCreate("M4 label", OBJ_TEXT, 0, Time[20], M4);
      ObjectSetText("M4 label", " M4", 8, "Arial", Black);
      }
      else
      {
      ObjectMove("M4 label", 0, Time[20], M4);
      }

      if(ObjectFind("M3 label") != 0)
      {
      ObjectCreate("M3 label", OBJ_TEXT, 0, Time[20], M3);
      ObjectSetText("M3 label", " M3", 8, "Arial", Black);
      }
      else
      {
      ObjectMove("M3 label", 0, Time[20], M3);
      }

      if(ObjectFind("M2 label") != 0)
      {
      ObjectCreate("M2 label", OBJ_TEXT, 0, Time[20], M2);
      ObjectSetText("M2 label", " M2", 8, "Arial", Black);
      }
      else
      {
      ObjectMove("M2 label", 0, Time[20], M2);
      }

      if(ObjectFind("M1 label") != 0)
      {
      ObjectCreate("M1 label", OBJ_TEXT, 0, Time[20], M1);
      ObjectSetText("M1 label", " M1", 8, "Arial", Black);
      }
      else
      {
      ObjectMove("M1 label", 0, Time[20], M1);
      }

      if(ObjectFind("M0 label") != 0)
      {
      ObjectCreate("M0 label", OBJ_TEXT, 0, Time[20], M0);
      ObjectSetText("M0 label", " M0", 8, "Arial", Black);
      }
      else
      {
      ObjectMove("M0 label", 0, Time[20], M0);
      }

//---- Draw Midpoint Pivots on Chart
      if(ObjectFind("M5 line") != 0)
      {
      ObjectCreate("M5 line", OBJ_HLINE, 0, Time[40], M5);
      ObjectSet("M5 line", OBJPROP_STYLE, STYLE_DASHDOTDOT);
      ObjectSet("M5 line", OBJPROP_COLOR, Blue);
      }
      else
      {
      ObjectMove("M5 line", 0, Time[40], M5);
      }

      if(ObjectFind("M4 line") != 0)
      {
      ObjectCreate("M4 line", OBJ_HLINE, 0, Time[40], M4);
      ObjectSet("M4 line", OBJPROP_STYLE, STYLE_DASHDOTDOT);
      ObjectSet("M4 line", OBJPROP_COLOR, Blue);
      }
      else
      {
      ObjectMove("M4 line", 0, Time[40], M4);
      }

      if(ObjectFind("M3 line") != 0)
      {
      ObjectCreate("M3 line", OBJ_HLINE, 0, Time[40], M3);
      ObjectSet("M3 line", OBJPROP_STYLE, STYLE_DASHDOTDOT);
      ObjectSet("M3 line", OBJPROP_COLOR, Blue);
      }
      else
      {
      ObjectMove("M3 line", 0, Time[40], M3);
      }

      if(ObjectFind("M2 line") != 0)
      {
      ObjectCreate("M2 line", OBJ_HLINE, 0, Time[40], M2);
      ObjectSet("M2 line", OBJPROP_STYLE, STYLE_DASHDOTDOT);
      ObjectSet("M2 line", OBJPROP_COLOR, Blue);
      }
      else
      {
      ObjectMove("M2 line", 0, Time[40], M2);
      }

      if(ObjectFind("M1 line") != 0)
      {
      ObjectCreate("M1 line", OBJ_HLINE, 0, Time[40], M1);
      ObjectSet("M1 line", OBJPROP_STYLE, STYLE_DASHDOTDOT);
      ObjectSet("M1 line", OBJPROP_COLOR, Blue);
      }
      else
      {
      ObjectMove("M1 line", 0, Time[40], M1);
      }

      if(ObjectFind("M0 line") != 0)
      {
      ObjectCreate("M0 line", OBJ_HLINE, 0, Time[40], M0);
      ObjectSet("M0 line", OBJPROP_STYLE, STYLE_DASHDOTDOT);
      ObjectSet("M0 line", OBJPROP_COLOR, Blue);
      }
      else
      {
      ObjectMove("M0 line", 0, Time[40], M0);
      }

   }
//----End of Midpoint Pivots Draw

//---- End Of Program
   return(0);
  }
//+------------------------------------------------------------------+
Comments