Indicator

osmaD1

iOsMA
OsMaDivergence
Indicator

OsMaDivergence

iOsMA
Indicator

osmaH1

iOsMA
Indicator

osmaH4

iOsMA
OsMAII
Indicator

OsMAII

iMAiMAOnArray

Calculates a derivative of the MACD by subtracting its smoothed signal line from the raw difference of dual exponential moving averages.

OsMA_5_bar_rolling_0.4
Indicator

OsMA_5_bar_rolling_0.4

This indicator calculates a modified On Balance Oscillator by sampling price data at five-bar intervals to compute the divergence between dual EMA differentials and their signal averages.

OsMA_Color2Alert
Indicator

OsMA_Color2Alert

iOsMA
OsMA_Color2Alert_001
Indicator

OsMA_Color2Alert_001

iOsMA
OsMA_ColorHist_Alert
Indicator

OsMA_ColorHist_Alert

iMAiMAOnArray

This indicator computes a moving average of the MACD values to generate an oscillating histogram that identifies momentum shifts and zero-line crossovers.

OsMA_ColorHist_AlertNew
Indicator

OsMA_ColorHist_AlertNew

iMAiMAOnArray

This indicator calculates the difference between an exponential moving average and a signal line to visualize momentum shifts through a dual-colored histogram that triggers alerts on zero-line transitions.

OsMA_Divergence_v1
Indicator

OsMA_Divergence_v1

iOsMA
OsMA_In_Color
Indicator

OsMA_In_Color

iMAiMAOnArray

This visual tool bifurcates the Moving Average of Oscillator (MACD) into a dual-colored histogram based on positive and negative deviations from the signal line.

Indicator

OsMA_Lc

iMACDiOsMA
OsMA_v1
Indicator

OsMA_v1

iMAiMAOnArray

This indicator calculates the difference between a smoothed MACD line and its signal average to isolate underlying price momentum.

OsMA_v2
Indicator

OsMA_v2

iMAiMAOnArray

This indicator computes a histogram by subtracting a Signal SMA from the difference between two Exponential Moving Averages.

OsUSD
Indicator

OsUSD

iMA

This indicator calculates a synthetic currency strength index by aggregating the weighted price differentials of EURUSD, GBPUSD, USDCHF, and USDJPY to identify directional USD dominance.

OutQuotings
Indicator

OutQuotings

Extracts historical price action data within a user-defined temporal range and serializes it into a delimited CSV format.
OverLayChart -Point
Indicator

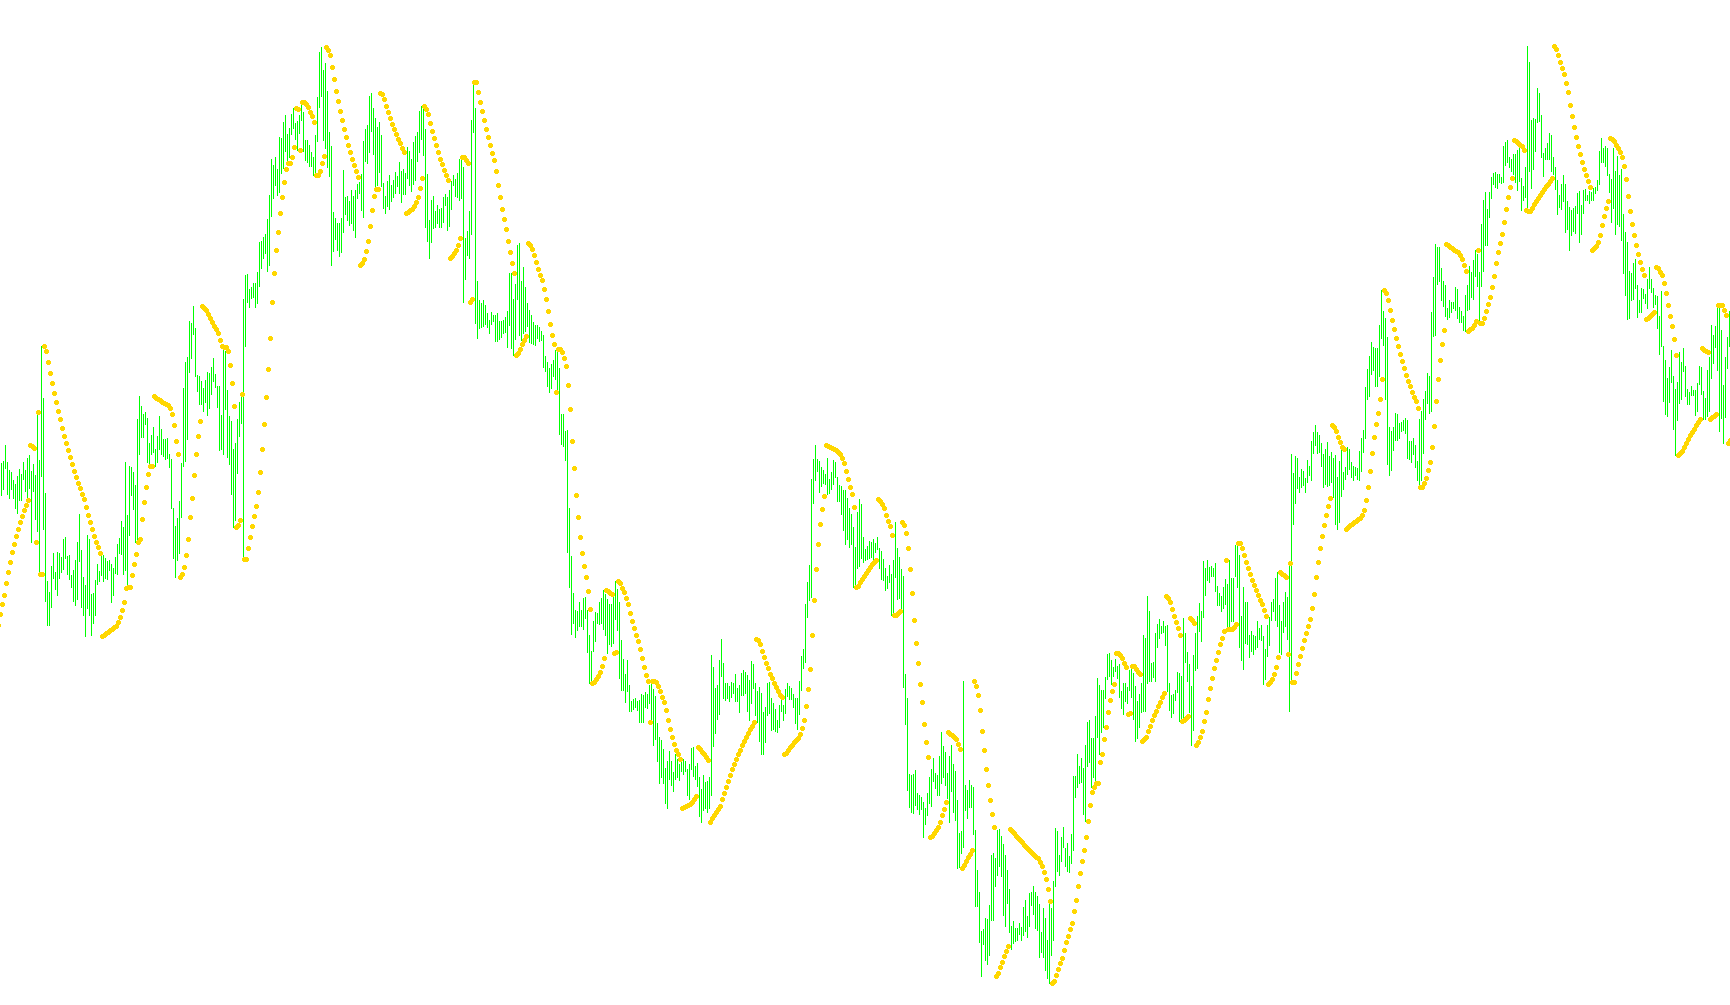
OverLayChart -Point

This indicator projects and scales the price action of a secondary symbol directly onto the primary chart, calculating proportional pip ratios to facilitate simultaneous multi-currency analysis.
OverLayChart-MA
Indicator

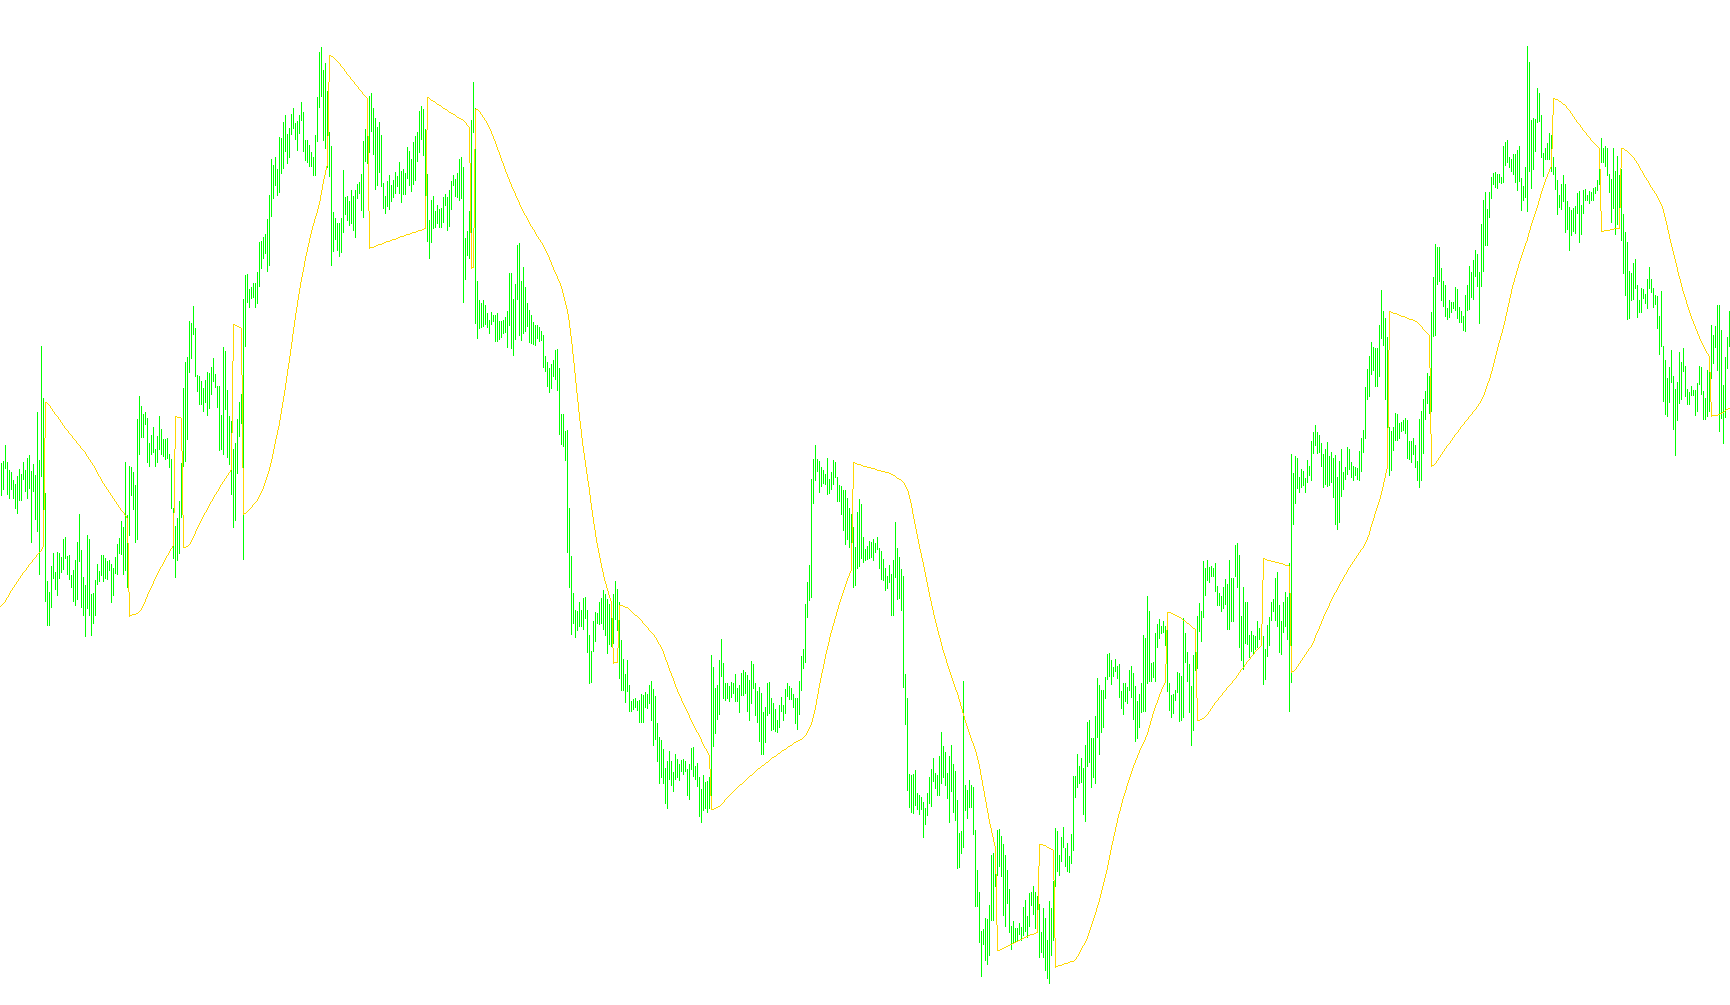
OverLayChart-MA

This indicator projects and scales the price action of a secondary currency pair onto the primary chart, providing real-time correlation visualiation with integrated moving averages and price grids.

OverLayChart
Indicator

OverLayChart

This indicator dynamically maps and visualizes a secondary symbol's price action onto the current chart by normalizing volatility and scale ratios.

OverLayChartLine
Indicator

OverLayChartLine

This indicator overlays the candlestick data of a specified symbol onto the current chart, providing a visual comparison of price action between two different instruments, and draws a dynamic grid based on the overlaid symbol's price range.

OzFX Daily Signals v1
Indicator

OzFX Daily Signals v1

iACiMAiStochastic

This indicator identifies trend reversals by correlating the direction of the Accumulation/Distribution (AC) index with Stochastic oscillator thresholds while overlaying a 200-period Simple Moving Average for structural bias.

OzFx Signals v1.2
Indicator

OzFx Signals v1.2

iACiATRiMAiStochastic

This indicator scans a custom list of currency pairs to identify high-probability long and short entries by synchronizing Awesome Oscillator momentum shifts, Stochastic oscillator crossovers, and SMA trend filtering.

OzFx Signals v1.7
Indicator

OzFx Signals v1.7

iACiAOiATRiStochastic

A multi-currency dashboard that concurrently processes Awesome Oscillator, Stochastic, and ATR metrics across multiple timeframes to identify synchronized momentum shifts and volatility breakouts.

OzFx Signals v1.7_v1
Indicator

OzFx Signals v1.7_v1

iACiAOiATRiStochastic

This multi-currency dashboard identifies bullish and bearish opportunities by synchronizing Awesome Oscillator reversals, Stochastic momentum thresholds, and SMA trend filters across multiple pairs simultaneously.

OzFX smD1 iLines v4
Indicator

OzFX smD1 iLines v4

iACiATRiStochastic

This indicator projects dynamic profit targets and stop-loss levels based on combined Stochastic momentum and AC Oscillator trend filters, featuring built-in performance statistics.

OzFX smD1 iSignals v4
Indicator

OzFX smD1 iSignals v4

iACiATRiMAiStochastic

This indicator synthesizes momentum from the Awesome Oscillator, Stochastic oscillators, and moving averages to trigger three distinct entry methodologies: standard trend confirmation, AES volatility logic, and swing point detection.

OzFX_D1_IndAES_v1.0
Indicator

OzFX_D1_IndAES_v1.0

iACiAOiMAiStochastic

This indicator identifies trend reversals by correlating Awesome Oscillator (AO) momentum shifts with Stochastic crossovers, complemented by optional SMA and RSI trend filtration.

OzFX_D1_IndAES_v1.0_v1
Indicator

OzFX_D1_IndAES_v1.0_v1

iACiAOiMAiStochastic

This indicator identifies bullish and bearish market shifts by correlating smoothed acceleration changes with stochastic momentum thresholds while providing optional moving average and RSI trend filtration.

Indicator

ô¡¿óÑÓßá›_1.69

P&F_v2
Indicator

P&F_v2

Identifies structural trend shifts by monitoring price breaches against specific volatility-based range boundaries and reversal multipliers.

P&F_v2_alerts
Indicator

P&F_v2_alerts

This indicator identifies market trend shifts by monitoring price breaches of predefined volatility zones and signaling potential reversals based on specific multi-bar range deviations.

P-Monthly
Indicator

P-Monthly

This indicator calculates monthly equilibrium levels and multi-layered support and resistance boundaries based on the previous month's price extremes and the current opening volatility.

PA IO detection v2
Indicator

PA IO detection v2

iATRiMAOnArray

This indicator identifies specific candlestick formations by filtering for inside bars, nested multi-bar contractions, and high-momentum outside bars based on ATR-adjusted price ranges.

Painter_v1
Indicator

Painter_v1

This indicator transforms standard price action into Heiken Ashi synthetic candles while highlighting specific volatility bounds outside of user-defined active trading hours.

PairDifference
Indicator

PairDifference

iMA

This indicator calculates the percentage deviation of multiple currency pairs from their respective moving average benchmarks to visualize relative price momentum across different markets simultaneously.

palka
Indicator

palka

This indicator maps a specific historical price point onto the current chart to visualize the correlation between present value and a fixed temporal offset.

palka2
Indicator

palka2

The indicator calculates a dual-point arithmetic mean by averaging current price coordinates with historical offsets to highlight structural shifts.

Parabolic SAR Color - Alert(2)
Indicator

Parabolic SAR Color - Alert(2)

iSAR

This indicator visualizes momentum shifts by dynamically coloring the Parabolic SAR dots based on their position relative to the price's high, triggering alerts on trend reversals.

Parabolic SAR Color - Alert(2)email
Indicator

Parabolic SAR Color - Alert(2)email

iSAR

Dynamically identifies and alerts on momentum shifts by monitoring when the Parabolic SAR value crosses above or below the current bar's high price.

Parabolic SAR Color - Alert
Indicator

Parabolic SAR Color - Alert

iSAR

This indicator visually bifurcates the Parabolic SAR into distinct color-coded channels to identify structural shifts in momentum and price orientation.

Parabolic SAR Color - Alerts
Indicator

Parabolic SAR Color - Alerts

iSAR

This indicator identifies trend reversals by dynamically switching between dual-colored channels based on the price's interaction with the parabolic SAR calculation.

Parabolic Sub
Indicator

Parabolic Sub

This indicator calculates a trailing stop-loss based on price momentum and extreme points, resetting the acceleration factor upon trend reversals to identify structural shifts.

Parabolic-close
Indicator

Parabolic-close

This indicator calculates an adaptive trend line that dynamically adjusts its acceleration based on price extremes to identify structural shifts and momentum exhaustion points.

Parabolic
Indicator

Parabolic

This indicator calculates a dynamic trailing stop level that accelerates based on price momentum and identifies trend reversal points by detecting breaches of the extrapolated parabolic boundary.

ParabolicM
Indicator

ParabolicM

This algorithm calculates an accelerating trailing boundary that detects trend exhaustion and price reversals by monitoring expansion limits and extreme value shifts.

Indicator

ParabolicRegression_StopAndReverse

Parabolic_4cNK
Indicator

Parabolic_4cNK

iSAR

This indicator identifies high-momentum trend shifts by filtering Parabolic Stop and Reverse signals through a minimum price velocity threshold.

Parabolic_Alert
Indicator

Parabolic_Alert

This indicator dynamically calculates Parabolic SAR trajectories and triggers audible alerts whenever price action breaches the projected trailing support or resistance levels.

Parabolic_Alert_Mod
Indicator

Parabolic_Alert_Mod

This indicator dynamically calculates parabolic SAR values to identify trend exhaustion and triggers real-time audio and email notifications upon momentum shifts.