Pivot (Midnight to Midnight)_V2_001
Download script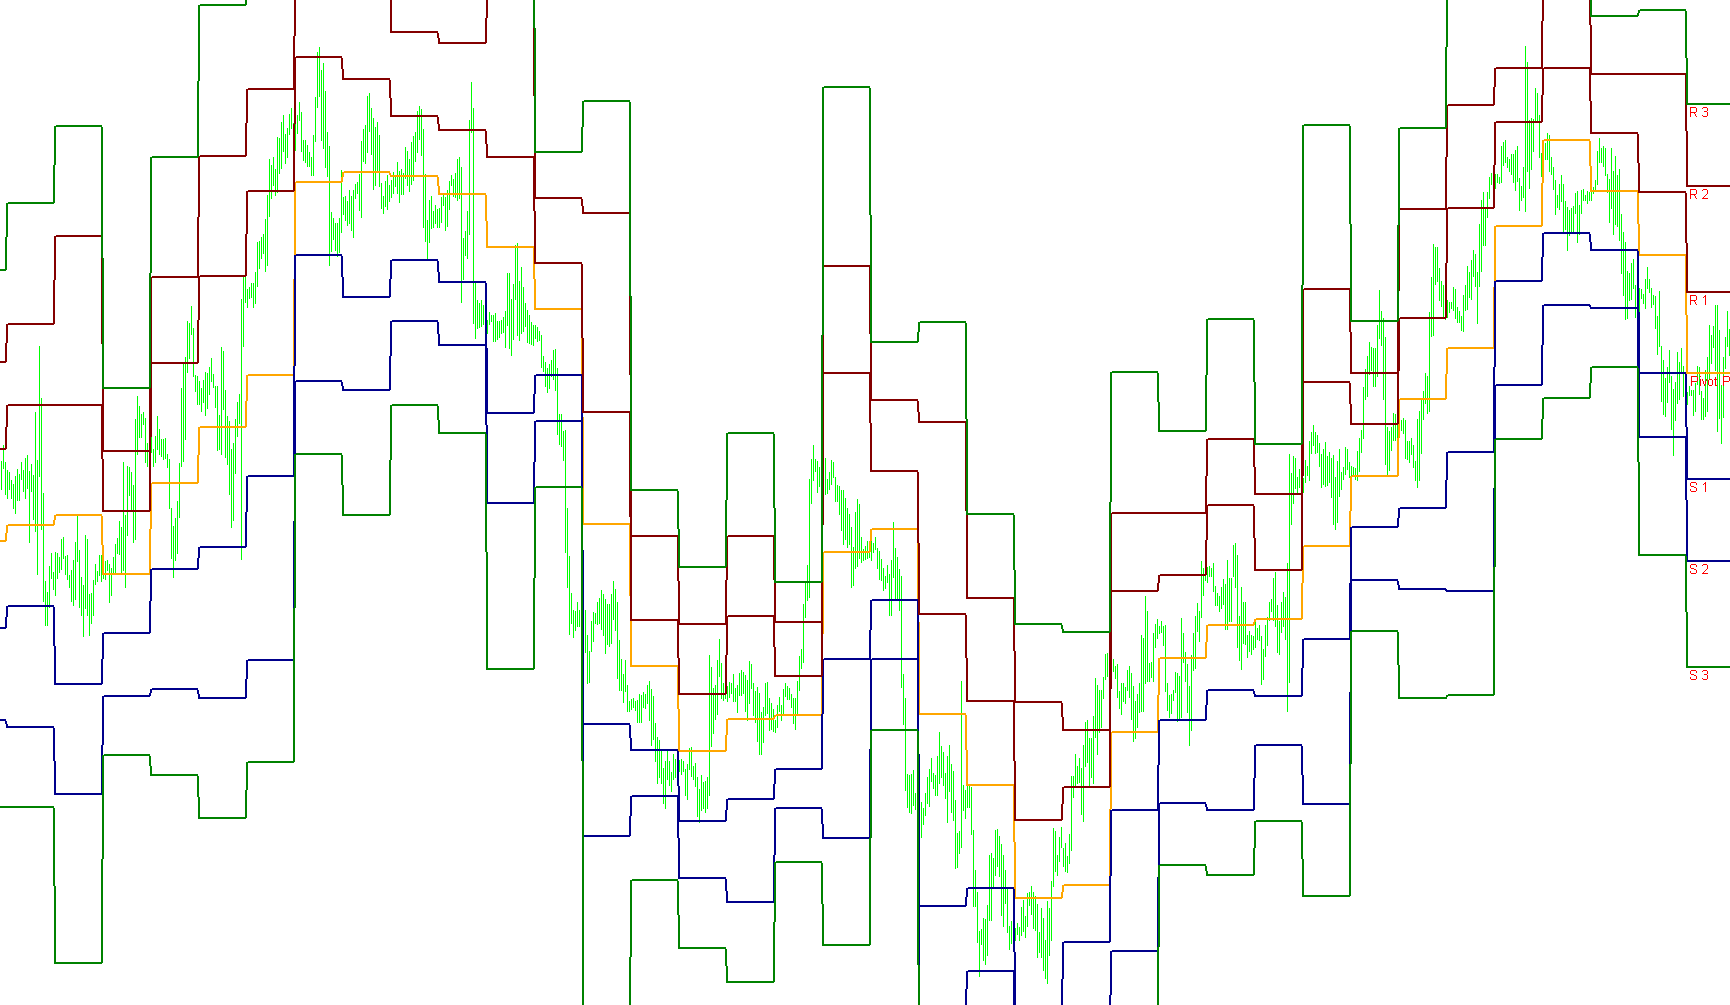
This script is a technical analysis tool designed to automatically calculate and display "Pivot Points" on a trading chart. Pivot points are used by traders to identify potential support and resistance levels—specific price areas where the market might encounter difficulty moving higher or lower.
How the Logic Works
The script operates by analyzing historical price data to establish three distinct types of markers:
1. The Core Calculation (The Pivot) The tool looks at the price movement of the previous trading day. It identifies the highest price reached, the lowest price reached, and the closing price of that period. By averaging these three values, it determines the "Pivot Point." This acts as the central equilibrium for the current trading session.
2. Support and Resistance Levels Based on the central Pivot Point, the script automatically calculates several surrounding levels to help traders anticipate price boundaries:
- Resistance Levels (R1, R2, R3): These represent "ceilings." They are calculated as prices above the Pivot Point where the market might face selling pressure.
- Support Levels (S1, S2, S3): These represent "floors." They are calculated as prices below the Pivot Point where the market might find a base to bounce back up.
3. Dynamic Updating The logic is designed to be reactive to time. Every time the calendar day changes, the script refreshes its data. It captures the extreme highs and lows of the completed session and instantly recalculates the new levels for the current day.
Visual Representation
On your chart, the script performs the following actions:
- Line Plotting: It draws visual lines for the Pivot Point (Orange), Support levels (Dark Blue/Green), and Resistance levels (Maroon/Green). This allows you to see these boundaries clearly as price moves.
- Text Labeling: To ensure clarity, the script places text labels directly on the chart (e.g., "S 1", "R 2", etc.). This identifies exactly which level is which, so you don't have to guess what a specific line represents.
- Historical Tracking: The tool doesn't just show today's data; it calculates these levels retroactively for past days, allowing you to see how price reacted to previous support and resistance zones.
Summary for the User
In simple terms, this script takes the "memory" of yesterday's price action and translates it into a roadmap for today. It tells you where the most important "turning points" are likely to occur, helping you visualize where the market might stall or reverse.
//+------------------------------------------------------------------+
//|                                                        Pivot.mq4 |
//|                               Copyright © 2004, Poul_Trade_Forum |
//|                                                         Aborigen |
//|                                          http://forex.kbpauk.ru/ |
//+------------------------------------------------------------------+
#property copyright "Poul Trade Forum"
#property link      "http://forex.kbpauk.ru/"

#property indicator_chart_window
//#property indicator_separate_window
#property indicator_buffers 7
#property indicator_color1 Orange
#property indicator_color2 DarkBlue
#property indicator_color3 Maroon
#property indicator_color4 DarkBlue
#property indicator_color5 Maroon
#property indicator_color6 Green
#property indicator_color7 Green
//---- input parameters

//---- buffers
double PBuffer[];
double S1Buffer[];
double R1Buffer[];
double S2Buffer[];
double R2Buffer[];
double S3Buffer[];
double R3Buffer[];
string Pivot="Pivot Point",Sup1="S 1", Res1="R 1";
string Sup2="S 2", Res2="R 2", Sup3="S 3", Res3="R 3";
int fontsize=10;
double P,S1,R1,S2,R2,S3,R3;
double LastHigh,LastLow,x;

//+------------------------------------------------------------------+
//| Custor indicator deinitialization function                       |
//+------------------------------------------------------------------+
int deinit()
  {
//---- TODO: add your code here

   ObjectDelete("Pivot");
   ObjectDelete("Sup1");
   ObjectDelete("Res1");
   ObjectDelete("Sup2");
   ObjectDelete("Res2");
   ObjectDelete("Sup3");
   ObjectDelete("Res3");

//----
   return(0);
  }
//+------------------------------------------------------------------+
//| Custom indicator initialization function                         |
//+------------------------------------------------------------------+
int init()
  {
   string short_name;

   IndicatorBuffers(7);
//---- indicator line
   SetIndexStyle(0,DRAW_LINE,0,2,Orange);
   SetIndexStyle(1,DRAW_LINE,0,2,DarkBlue);
   SetIndexStyle(2,DRAW_LINE,0,2,Maroon);
   SetIndexStyle(3,DRAW_LINE,0,2,DarkBlue);
   SetIndexStyle(4,DRAW_LINE,0,2,Maroon);
   SetIndexStyle(5,DRAW_LINE,0,2,Green);
   SetIndexStyle(6,DRAW_LINE,0,2,Green);
   SetIndexBuffer(0,PBuffer);
   SetIndexBuffer(1,S1Buffer);
   SetIndexBuffer(2,R1Buffer);
   SetIndexBuffer(3,S2Buffer);
   SetIndexBuffer(4,R2Buffer);
   SetIndexBuffer(5,S3Buffer);
   SetIndexBuffer(6,R3Buffer);


//---- name for DataWindow and indicator subwindow label
   short_name="Pivot Point";
   IndicatorShortName(short_name);
   SetIndexLabel(0,short_name);

//----
   SetIndexDrawBegin(0,1);
//----


//----
   return(0);
  }

//+------------------------------------------------------------------+
//| Custom indicator iteration function                              |
//+------------------------------------------------------------------+
int start()

  {
   int    counted_bars=IndicatorCounted();

   int limit, i;
//---- indicator calculation
if (counted_bars==0)
{
   x=Period();
   if (x>240) return(-1);
   ObjectCreate("Pivot", OBJ_TEXT, 0, 0,0);
   ObjectSetText("Pivot", "                 Pivot Point",fontsize,"Arial",Red);
   ObjectCreate("Sup1", OBJ_TEXT, 0, 0, 0);
   ObjectSetText("Sup1", "      S 1",fontsize,"Arial",Red);
   ObjectCreate("Res1", OBJ_TEXT, 0, 0, 0);
   ObjectSetText("Res1", "      R 1",fontsize,"Arial",Red);
   ObjectCreate("Sup2", OBJ_TEXT, 0, 0, 0);
   ObjectSetText("Sup2", "      S 2",fontsize,"Arial",Red);
   ObjectCreate("Res2", OBJ_TEXT, 0, 0, 0);
   ObjectSetText("Res2", "      R 2",fontsize,"Arial",Red);
   ObjectCreate("Sup3", OBJ_TEXT, 0, 0, 0);
   ObjectSetText("Sup3", "      S 3",fontsize,"Arial",Red);
   ObjectCreate("Res3", OBJ_TEXT, 0, 0, 0);
   ObjectSetText("Res3", "      R 3",fontsize,"Arial",Red);
}
   if(counted_bars<0) return(-1);
//---- last counted bar will be recounted
//   if(counted_bars>0) counted_bars--;
   limit=(Bars-counted_bars)-1;


for (i=limit; i>=0;i--)
{

if (High[i+1]>LastHigh) LastHigh=High[i+1];
if (Low[i+1]<LastLow) LastLow=Low[i+1];

if (TimeDay(Time[i])!=TimeDay(Time[i+1]))
   {
   P=(LastHigh+LastLow+Close[i+1])/3;
   R1 = (2*P)-LastLow;
   S1 = (2*P)-LastHigh;
   R2 = P+(LastHigh - LastLow);
   S2 = P-(LastHigh - LastLow);
   R3 = (2*P)+(LastHigh-(2*LastLow));
   S3 = (2*P)-((2* LastHigh)-LastLow);
   LastLow=Open[i]; LastHigh=Open[i];

   ObjectMove("Pivot", 0, Time[i],P);
   ObjectMove("Sup1", 0, Time[i],S1);
   ObjectMove("Res1", 0, Time[i],R1);
   ObjectMove("Sup2", 0, Time[i],S2);
   ObjectMove("Res2", 0, Time[i],R2);
   ObjectMove("Sup3", 0, Time[i],S3);
   ObjectMove("Res3", 0, Time[i],R3);

   }

    PBuffer[i]=P;
    S1Buffer[i]=S1;
    R1Buffer[i]=R1;
    S2Buffer[i]=S2;
    R2Buffer[i]=R2;
    S3Buffer[i]=S3;
    R3Buffer[i]=R3;

}

//----
   return(0);
  }
//+------------------------------------------------------------------+
Comments