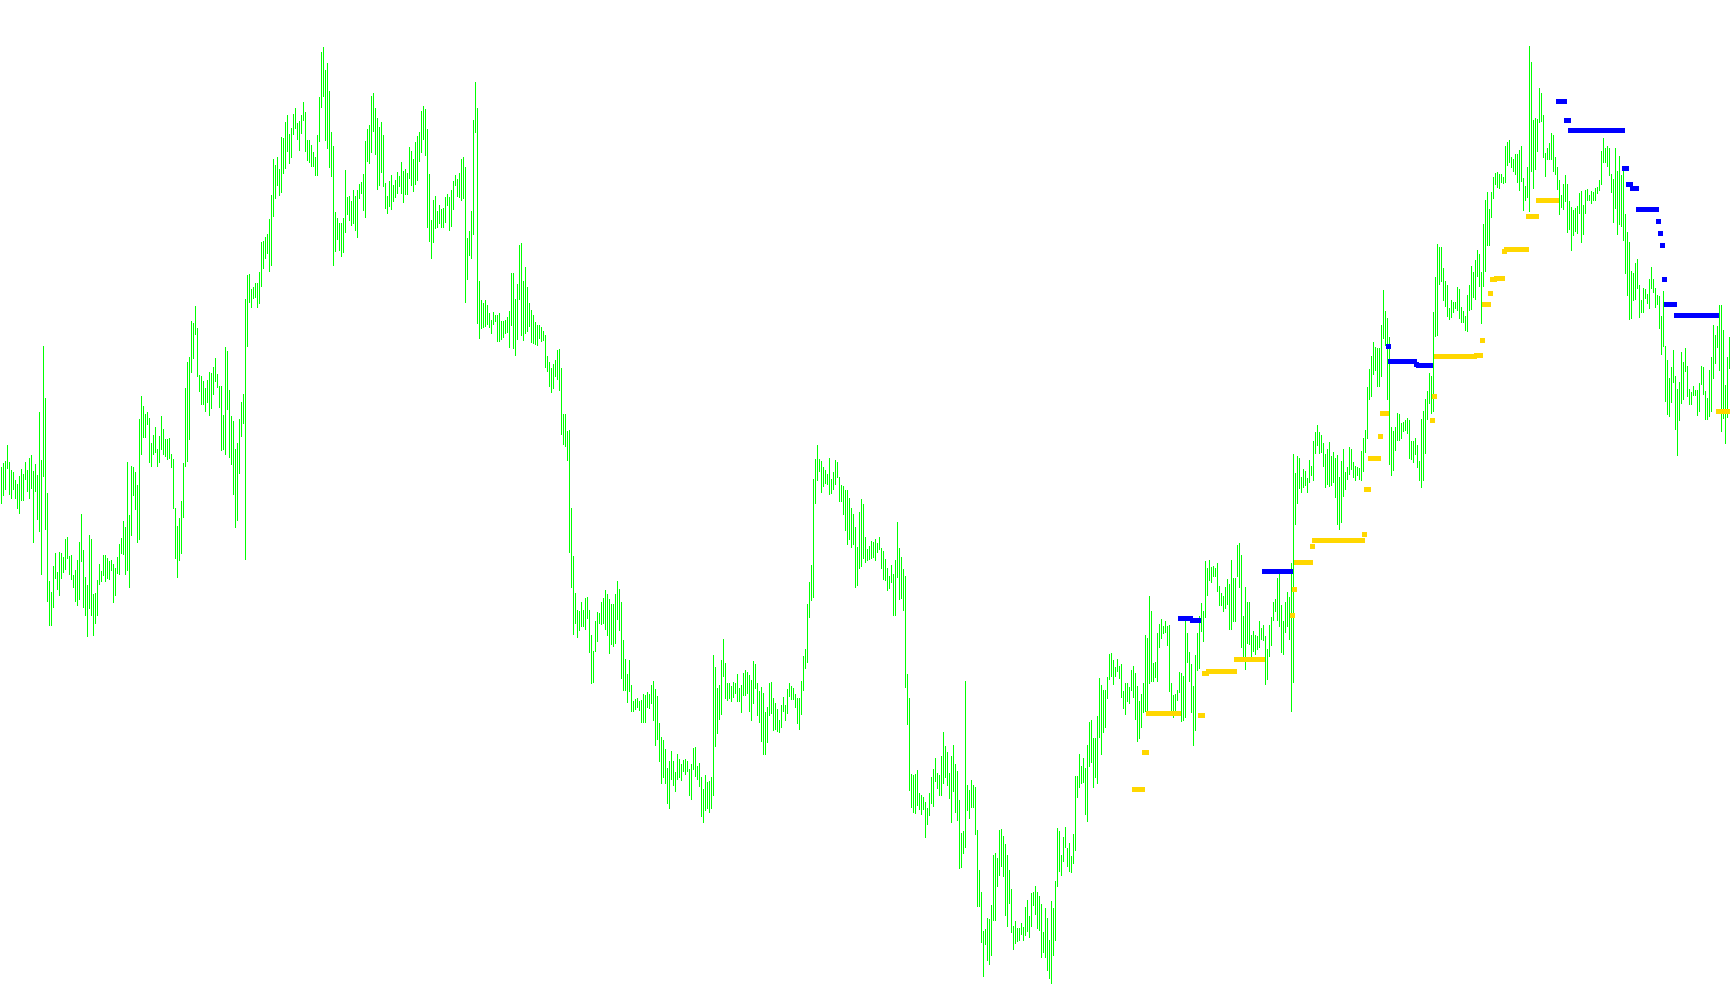
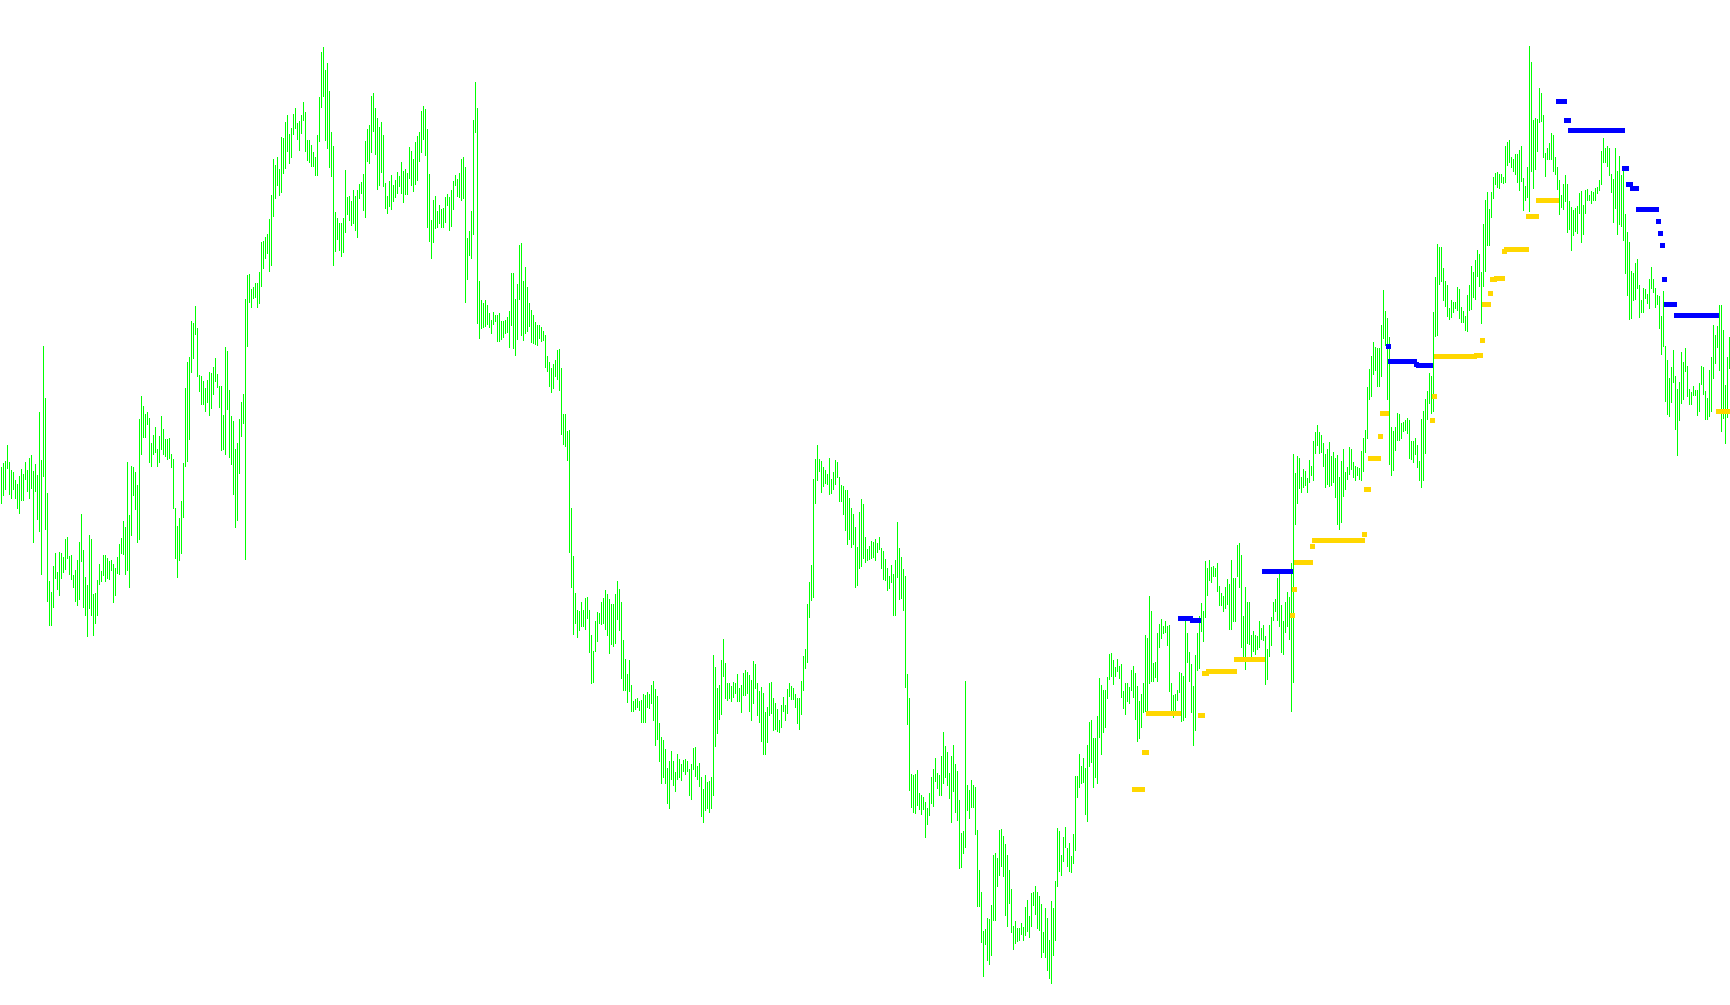
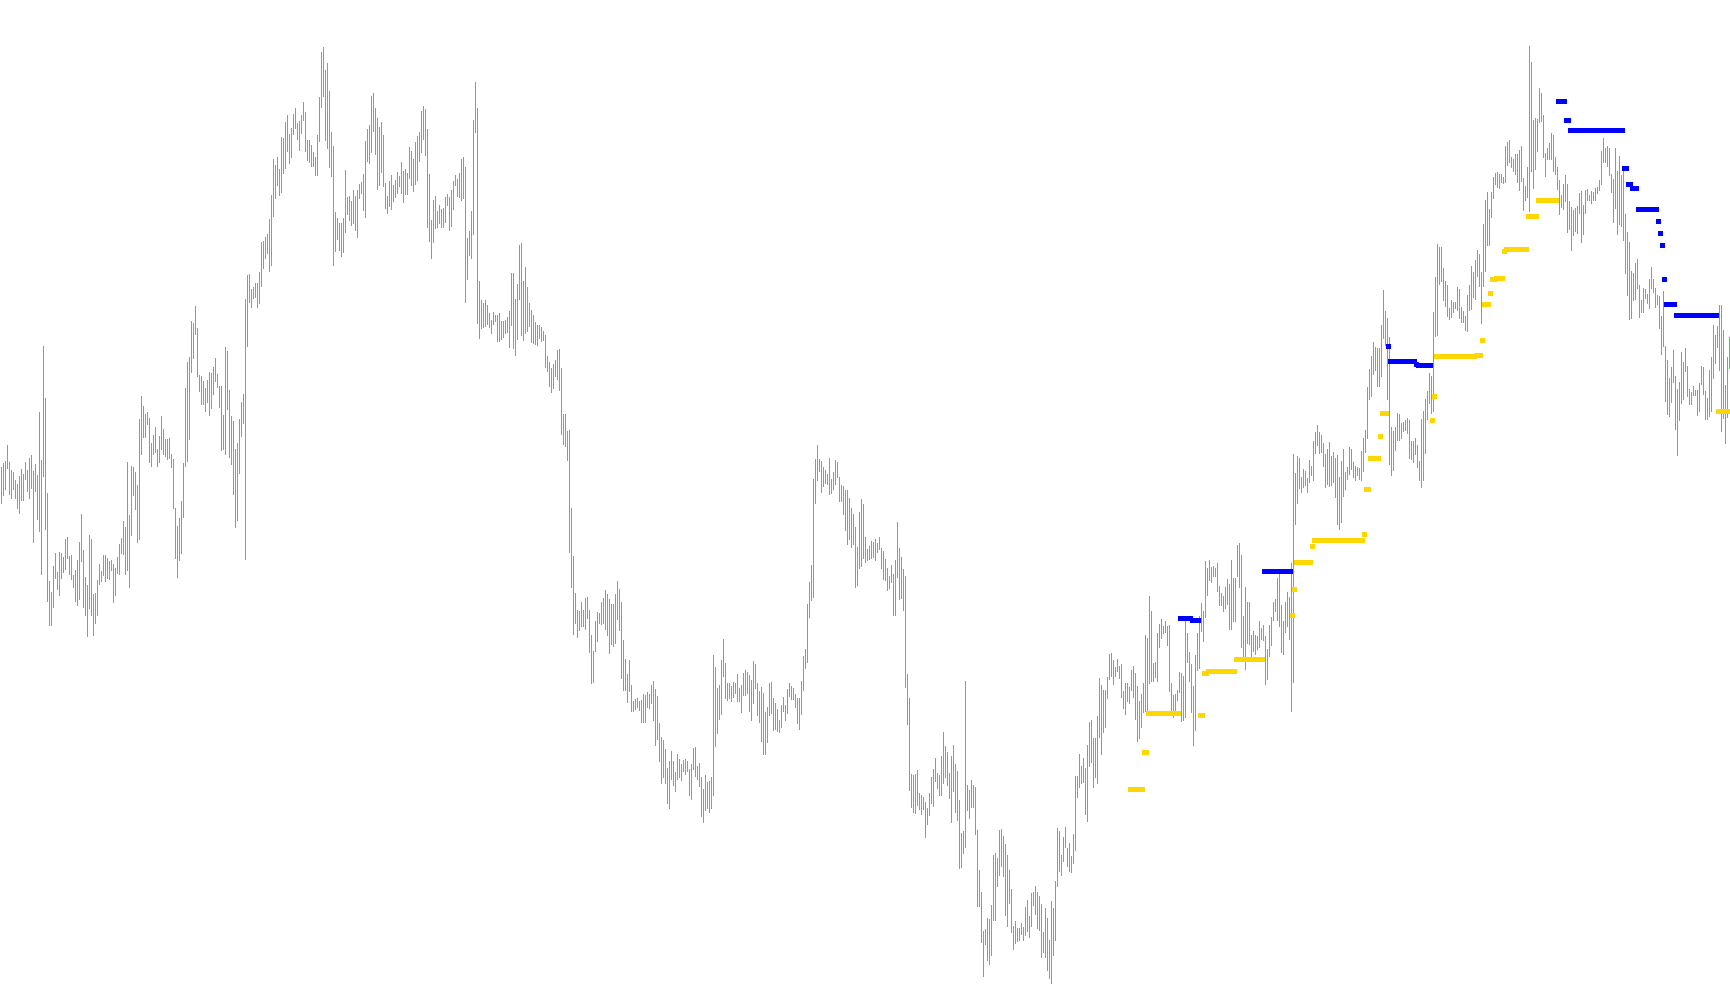
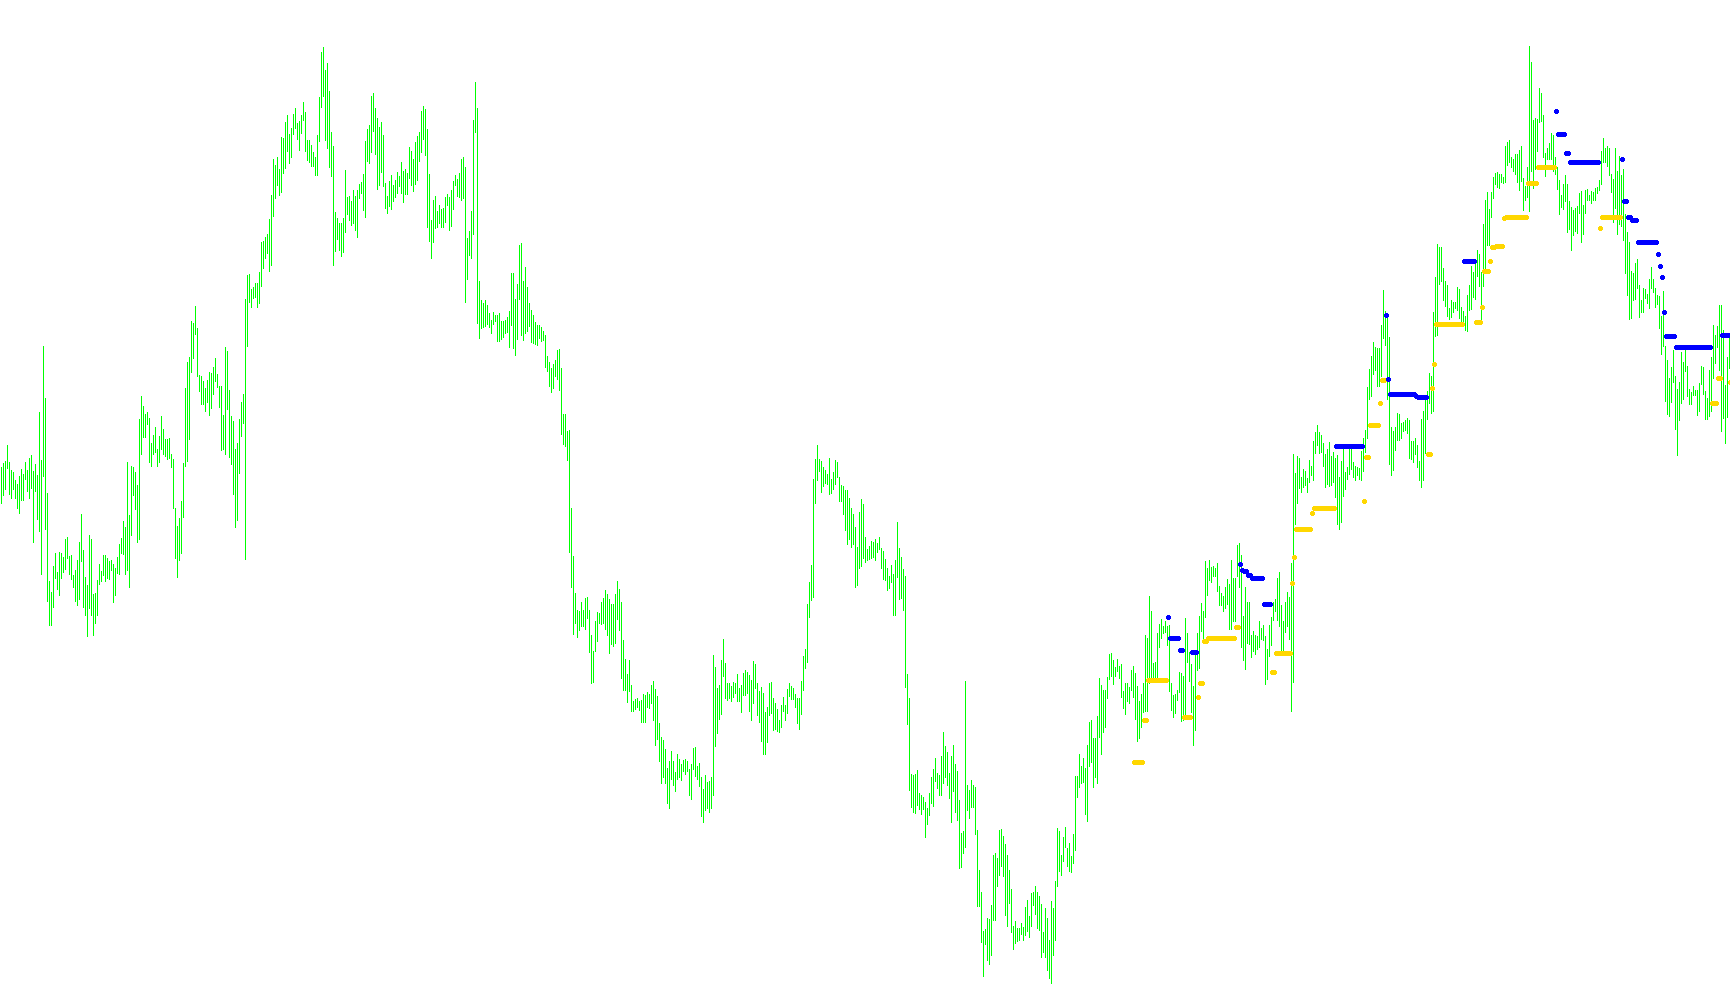
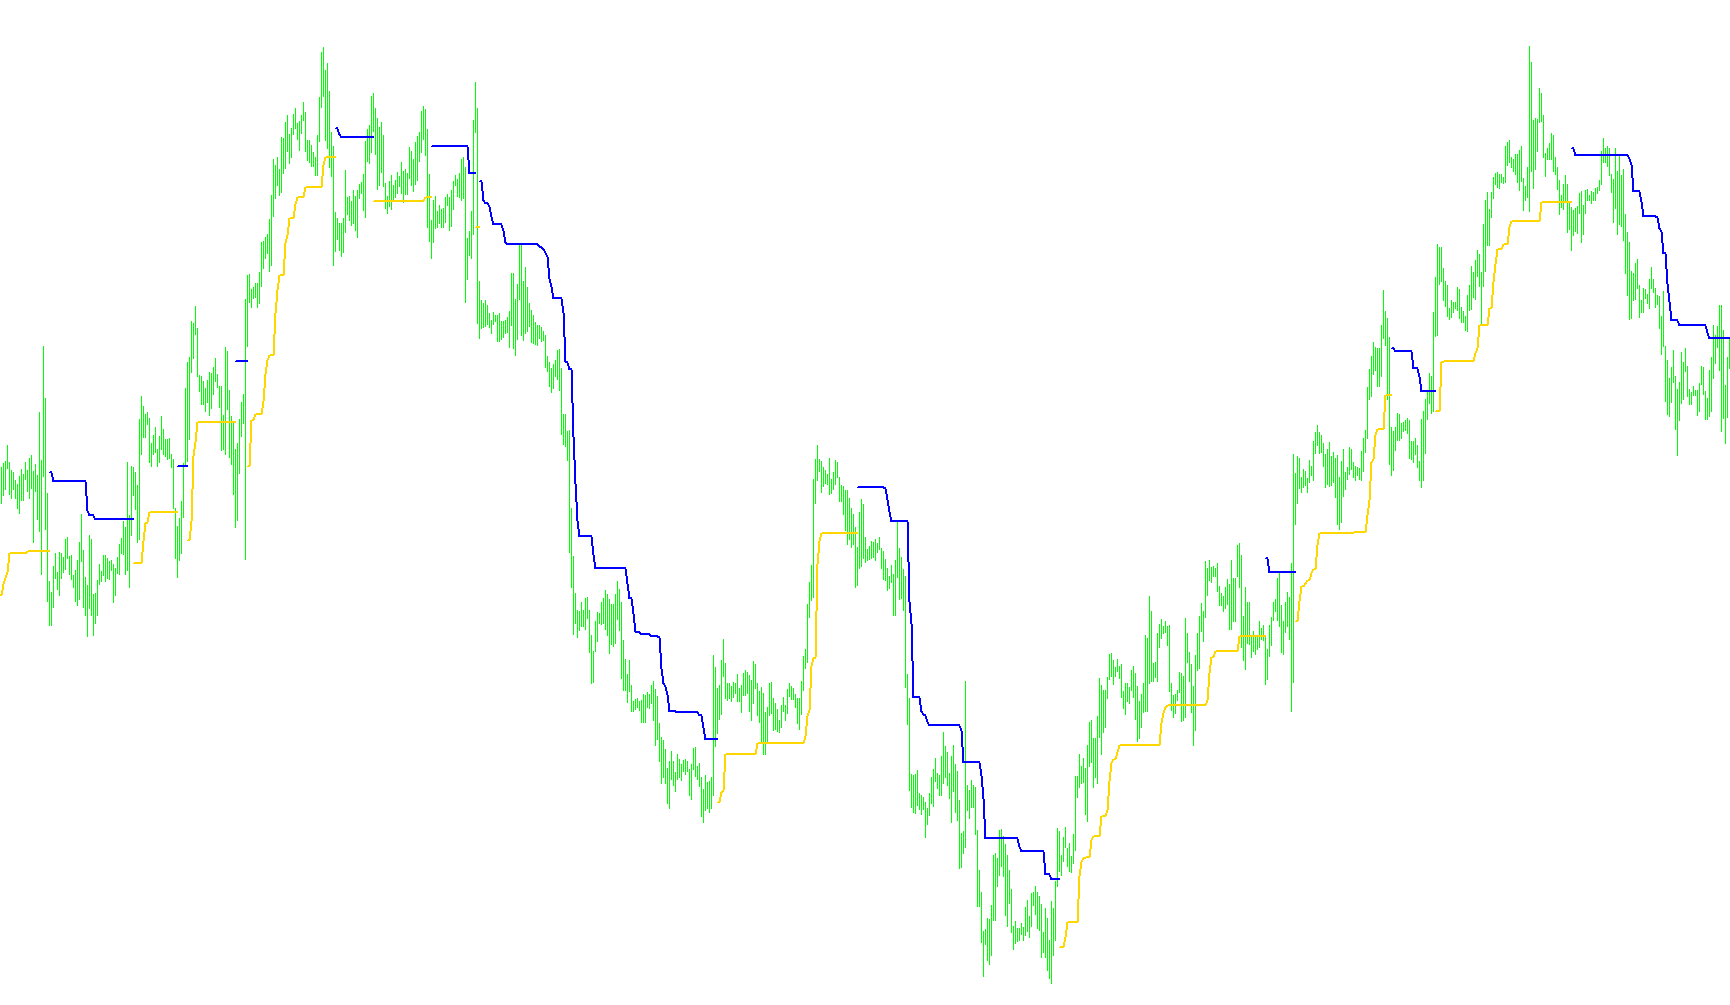
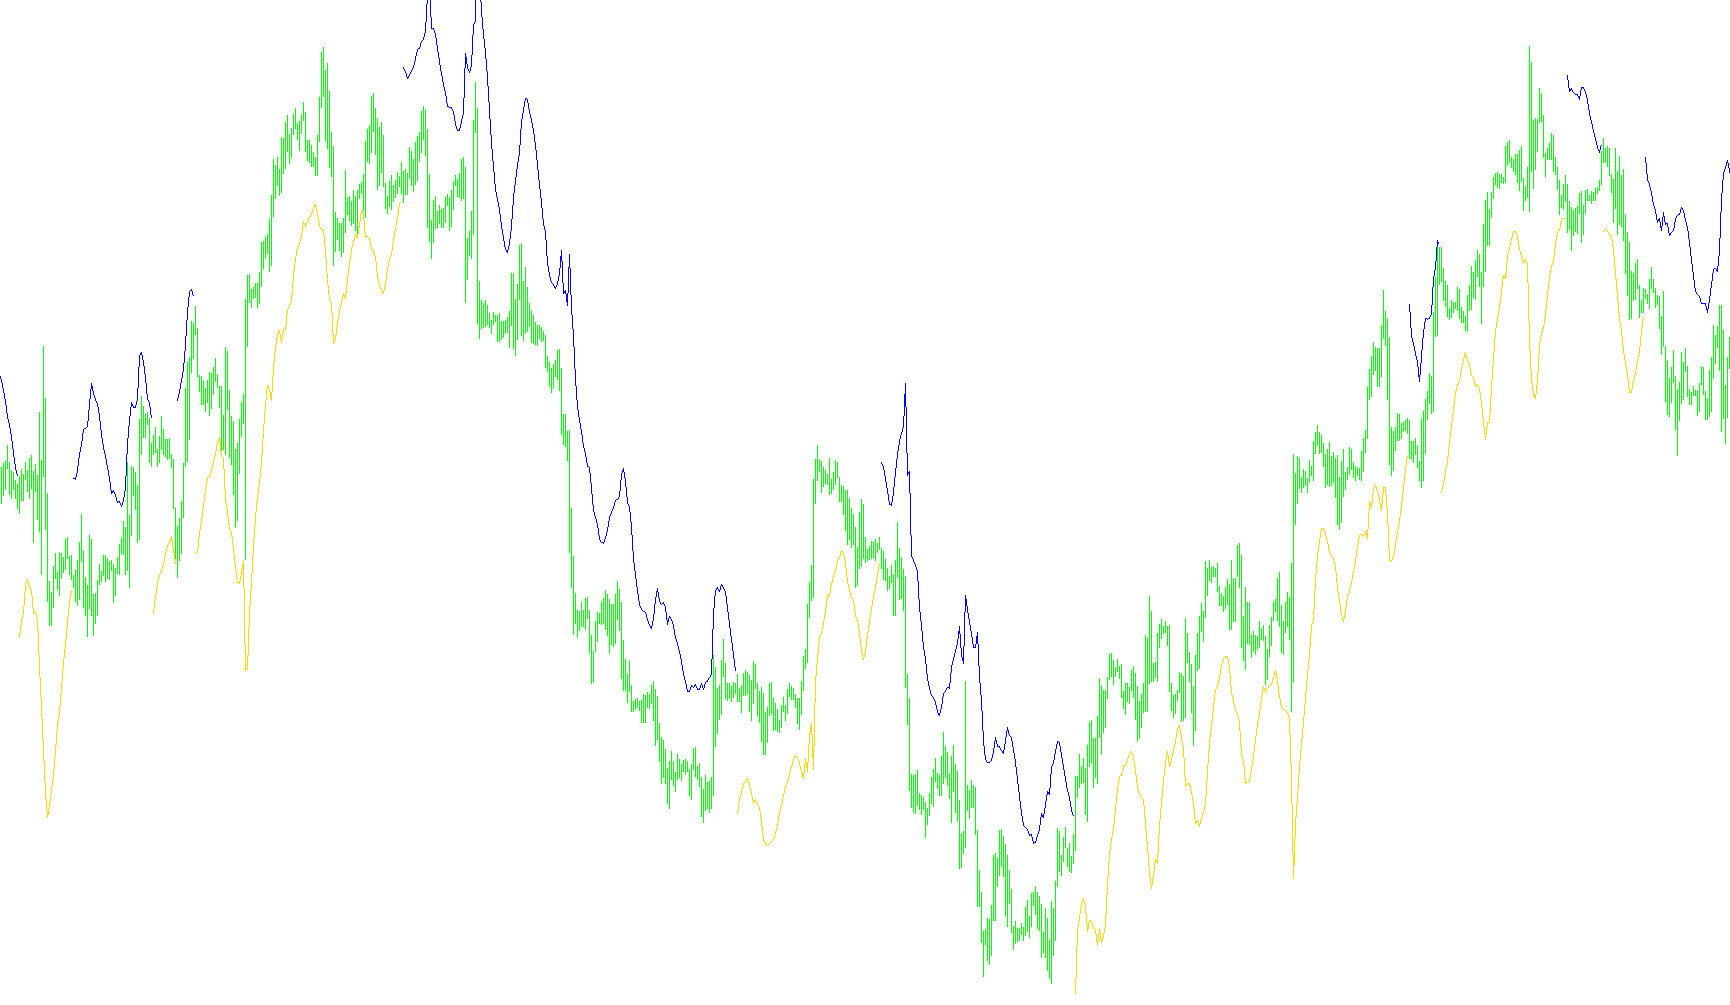
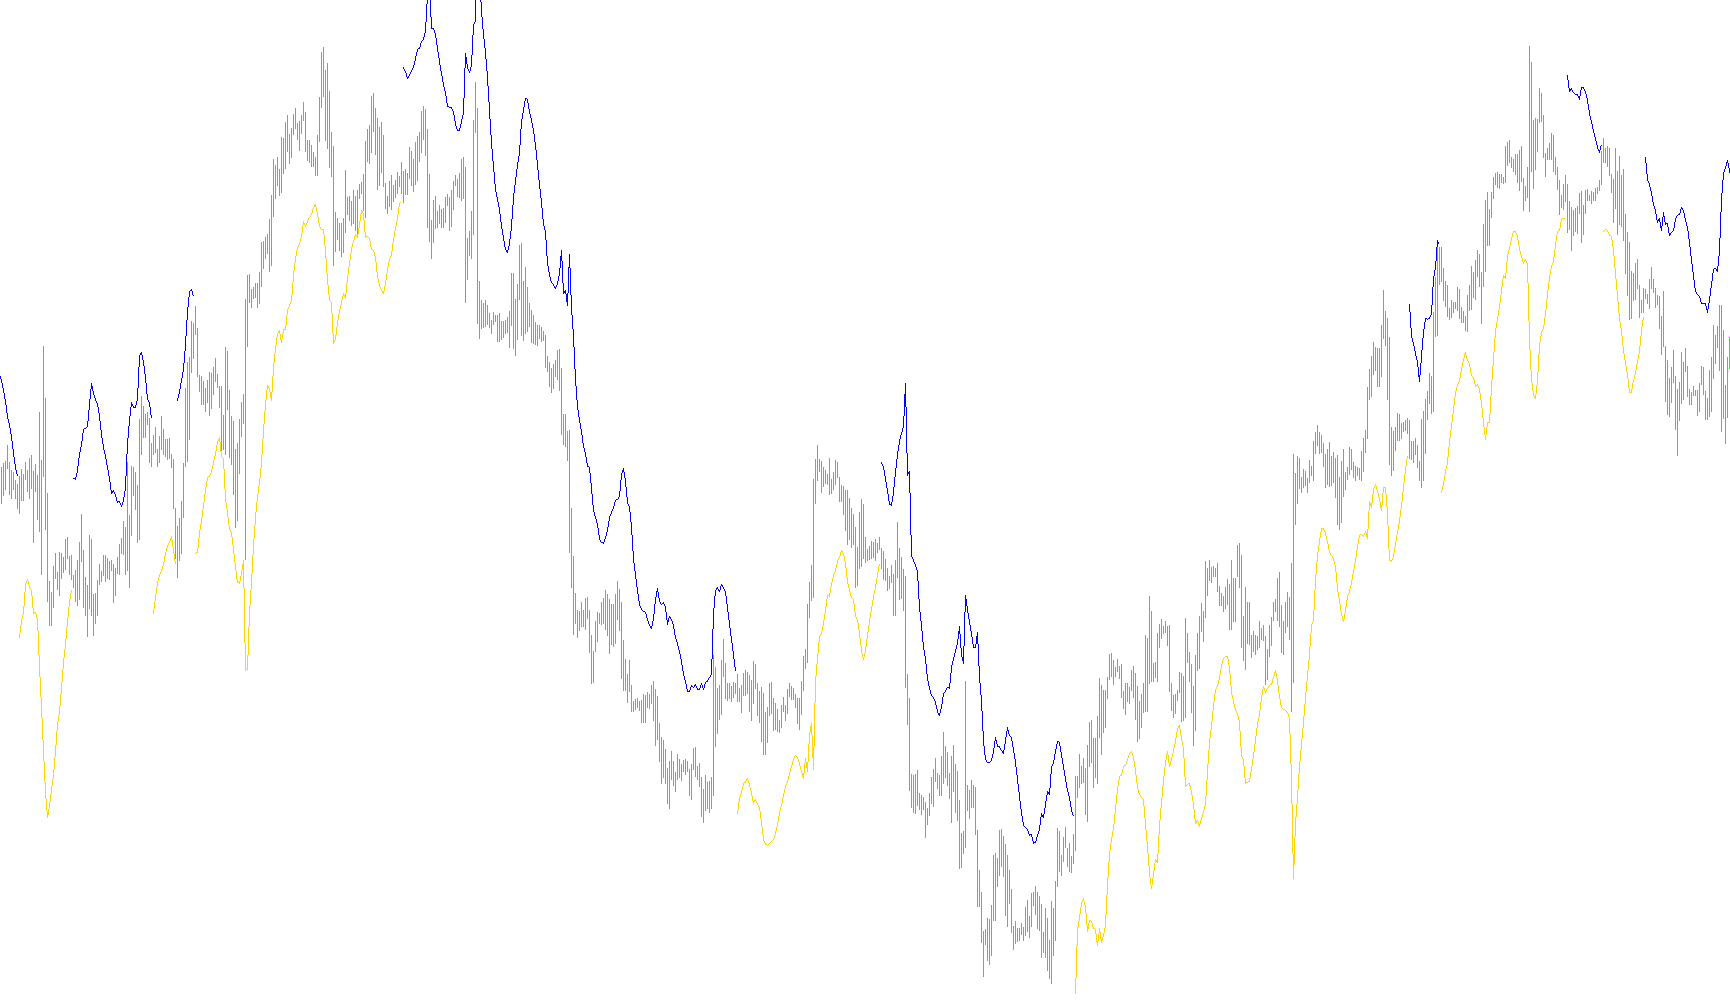
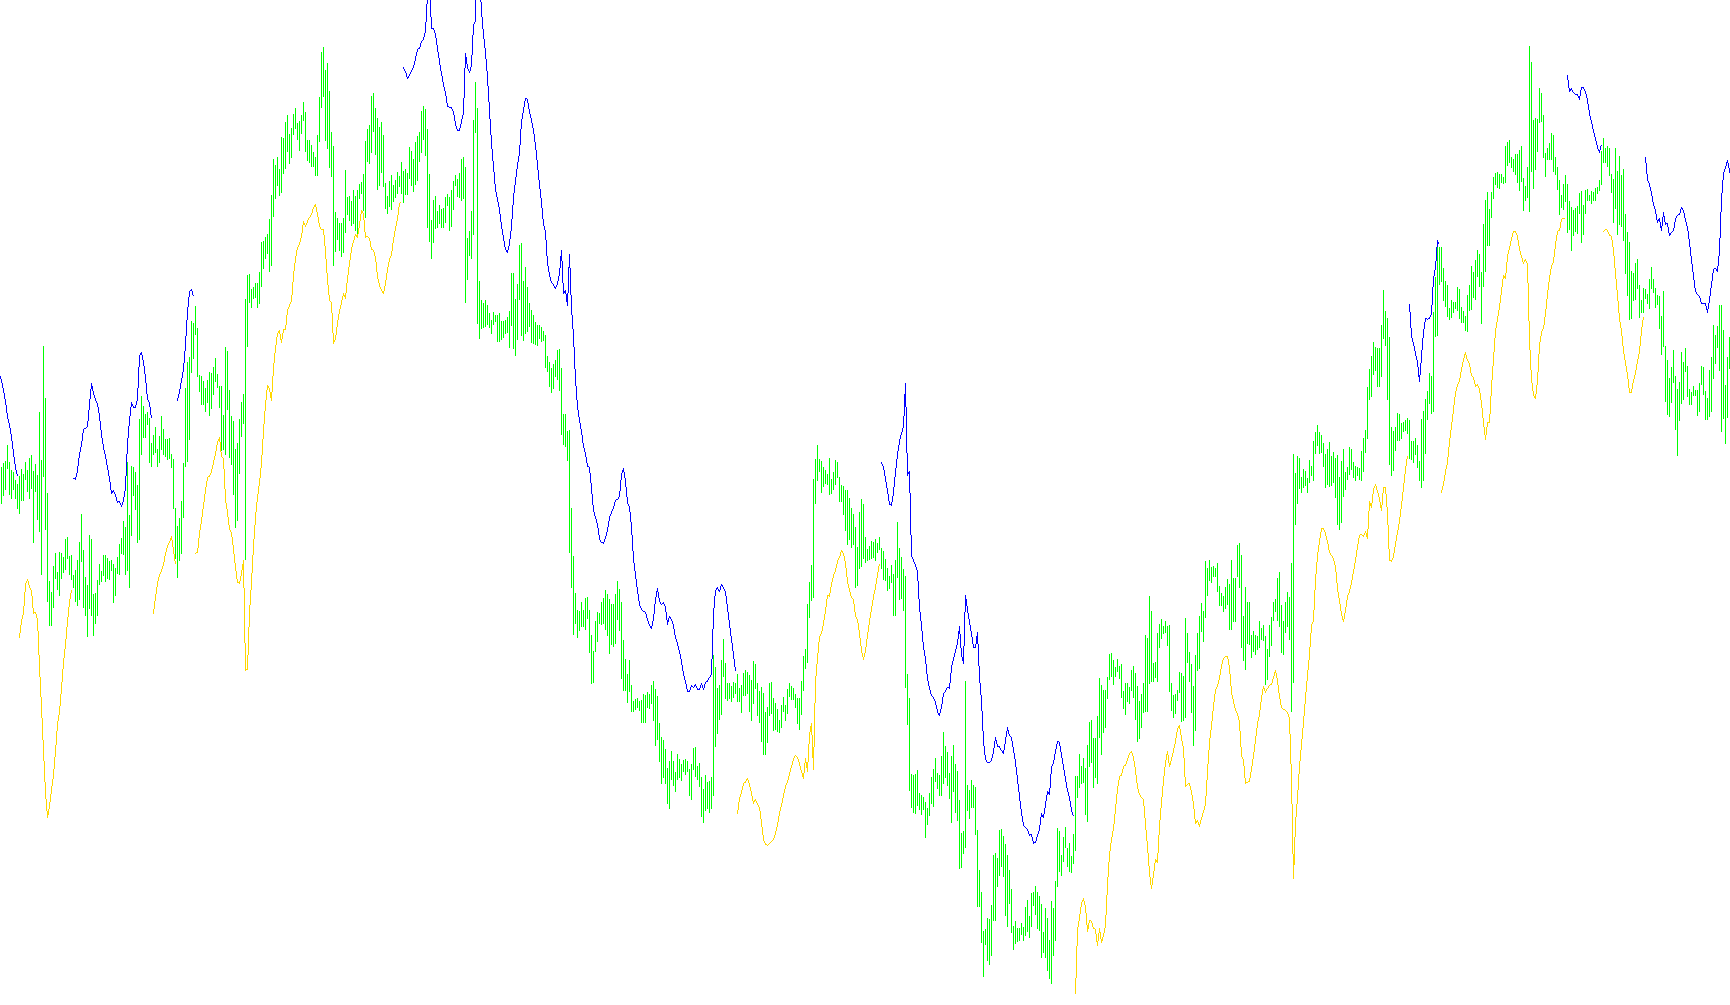
nr4id-atr_761
Indicator

nr4id-atr_761

iATR

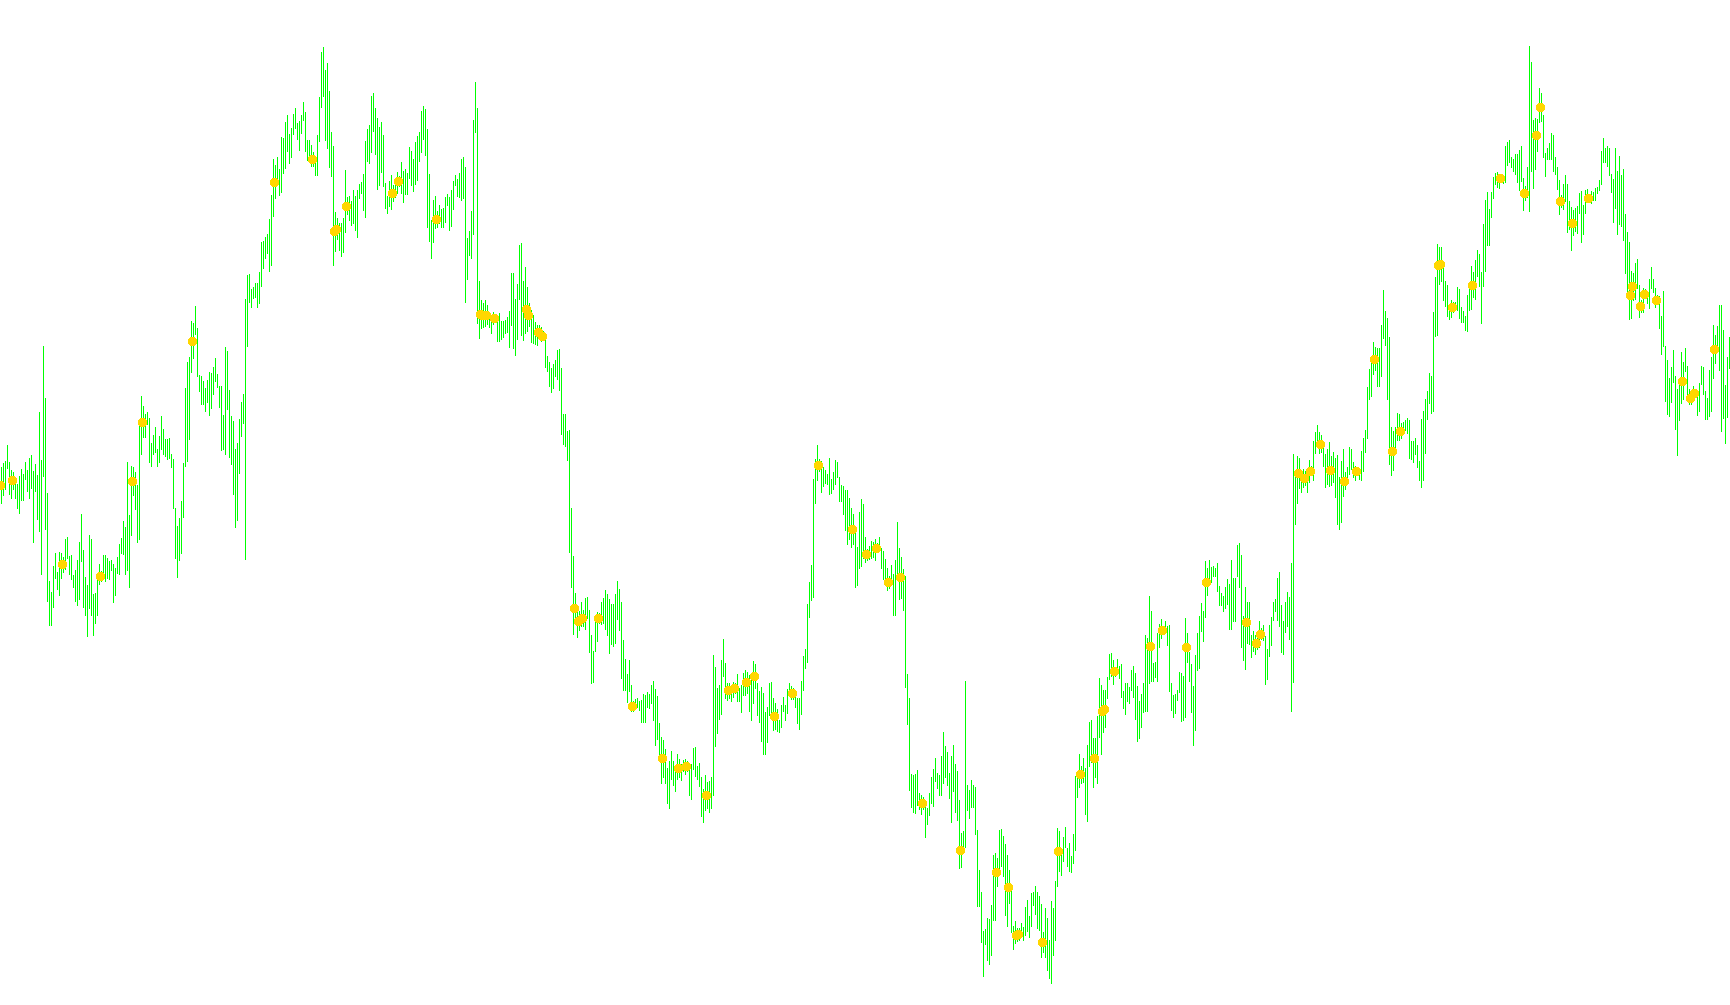
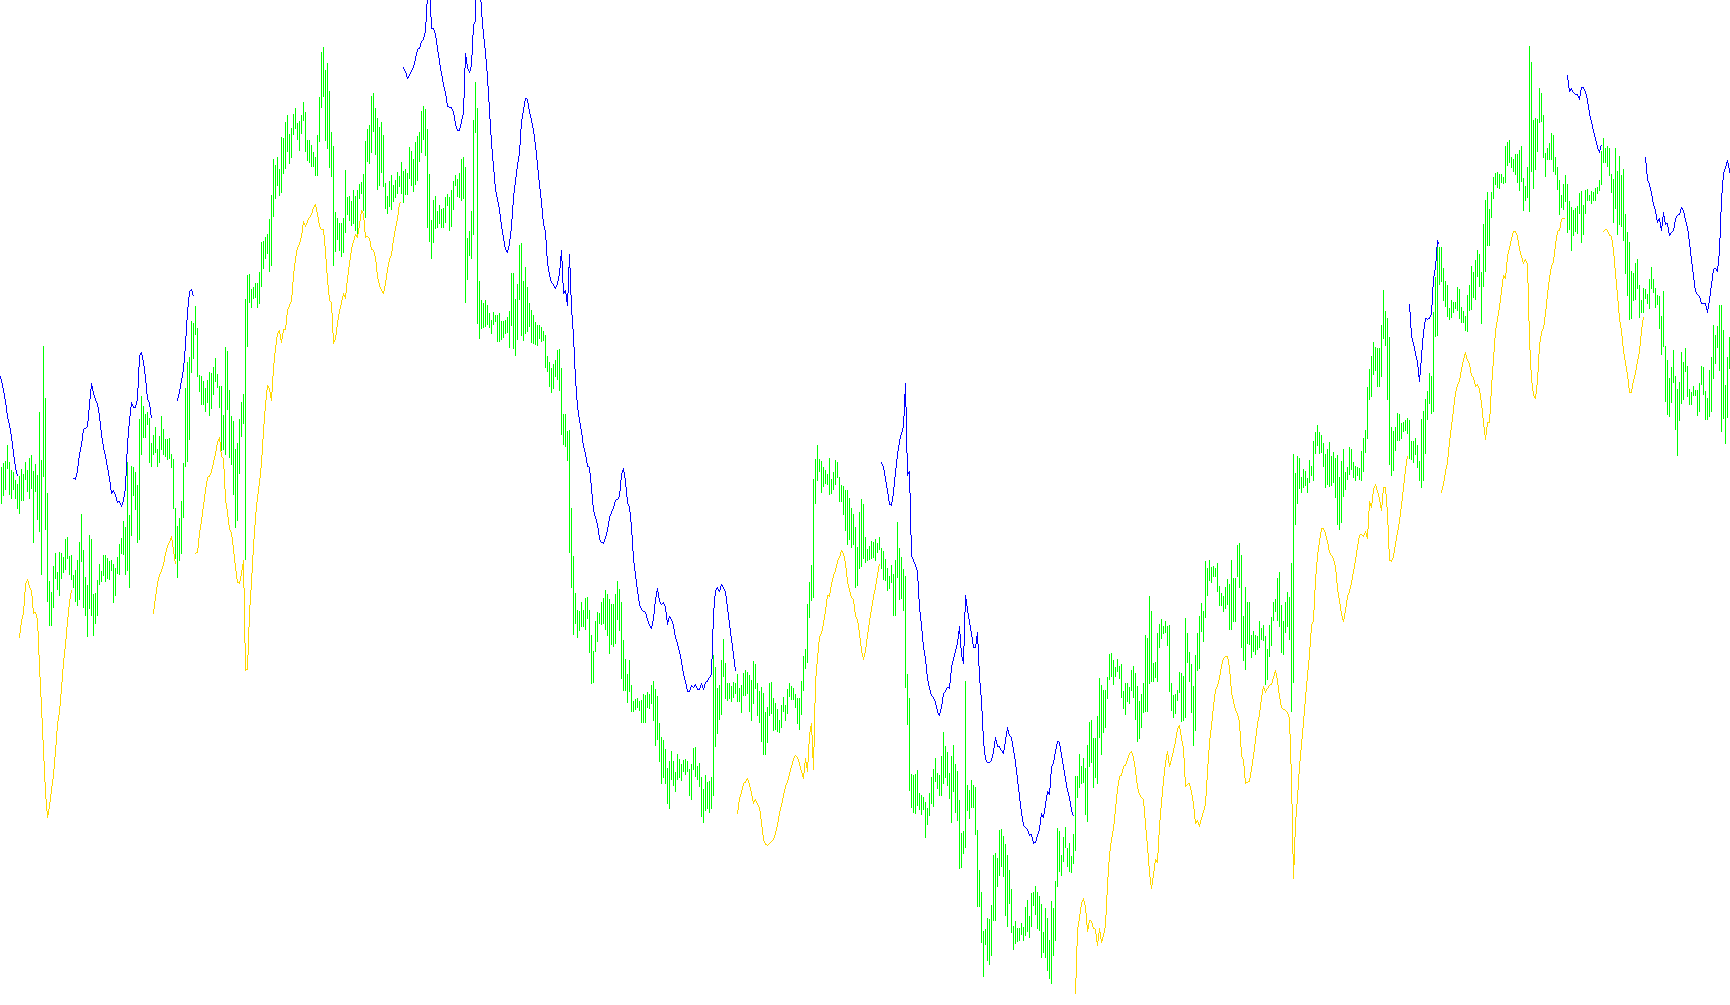
The logic identifies internal bar patterns where the price action is contained within previous highs and lows, specifically signaling a reversal or consolidation point when the current Average True Range reaches a local minimum over a defined historical lookback.

NR7-NR4
Indicator

NR7-NR4

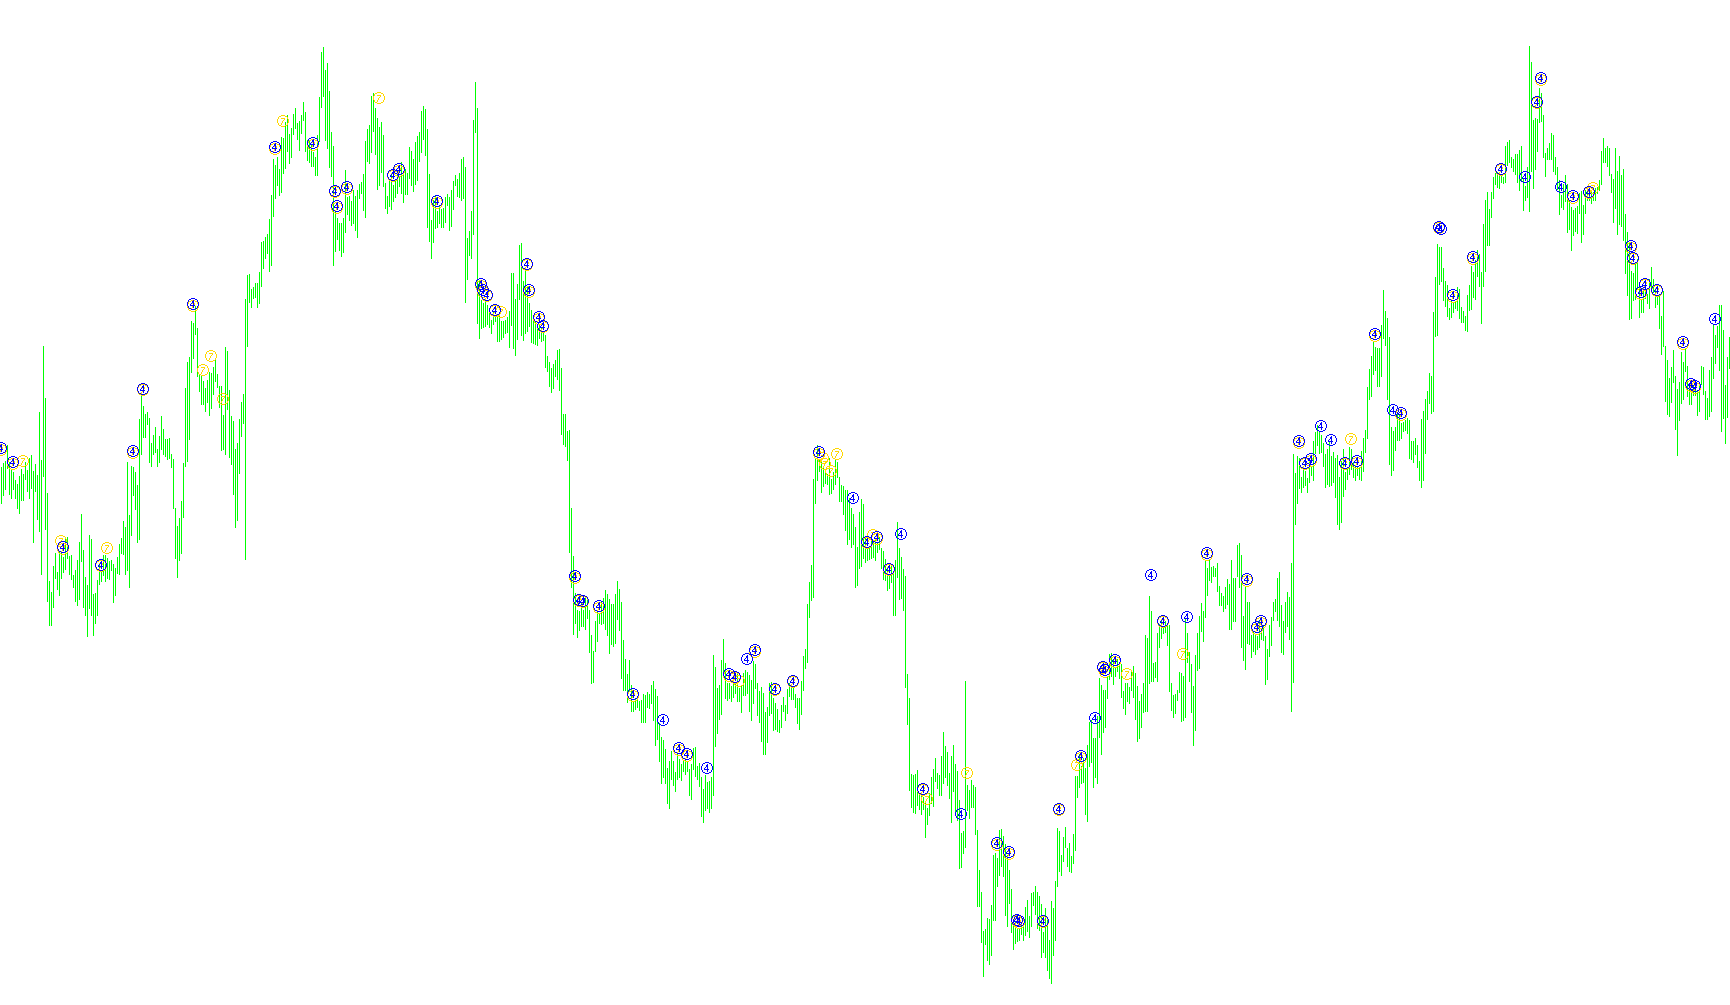
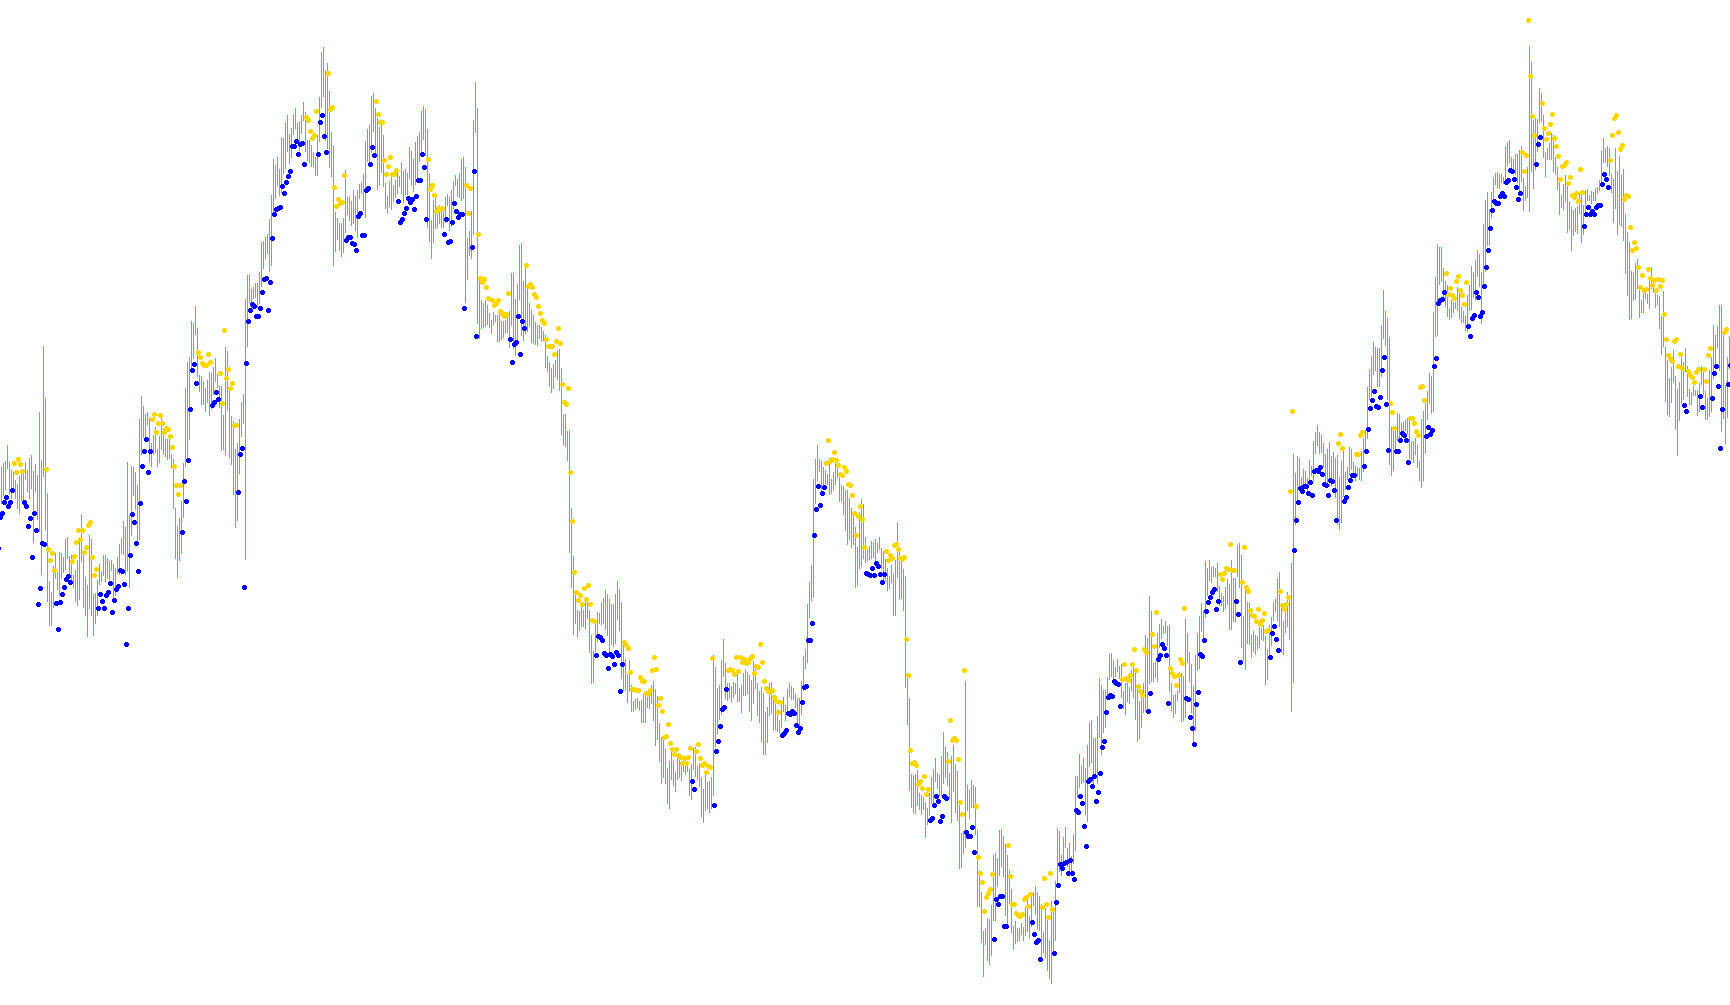
The indicator identifies localized momentum shifts by detecting price bars with the largest relative range compared to preceding short-term windows.

NRMA
Indicator

NRMA

iMAOnArray

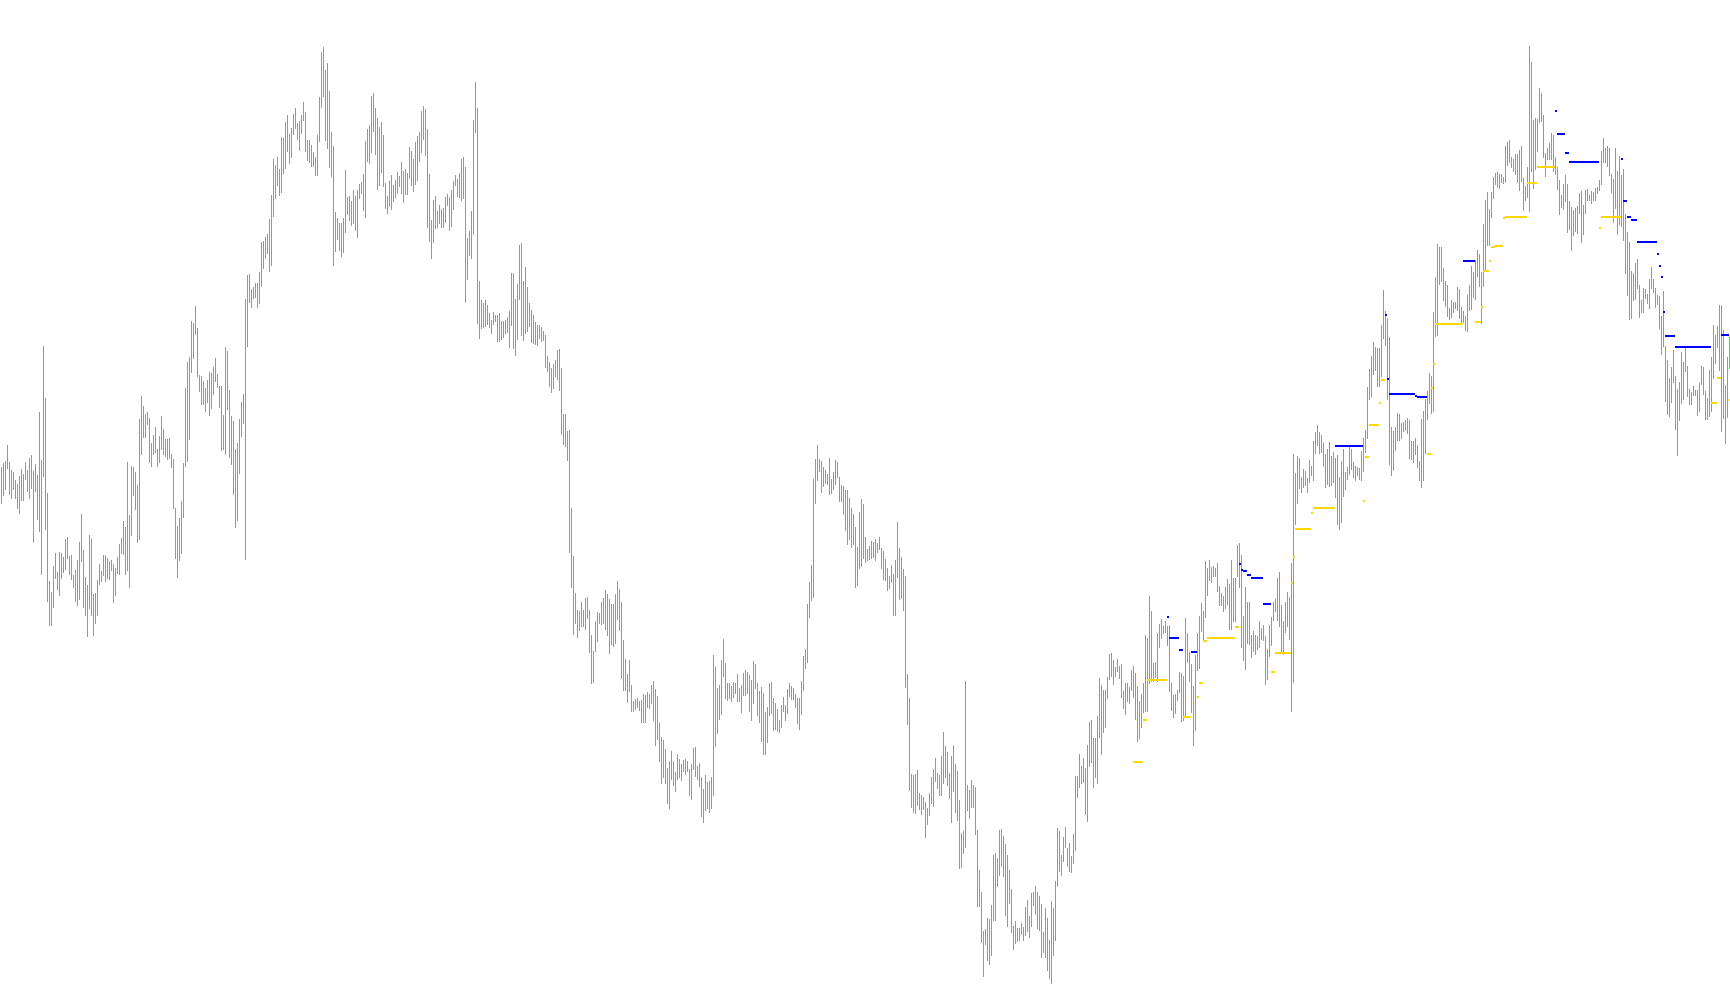
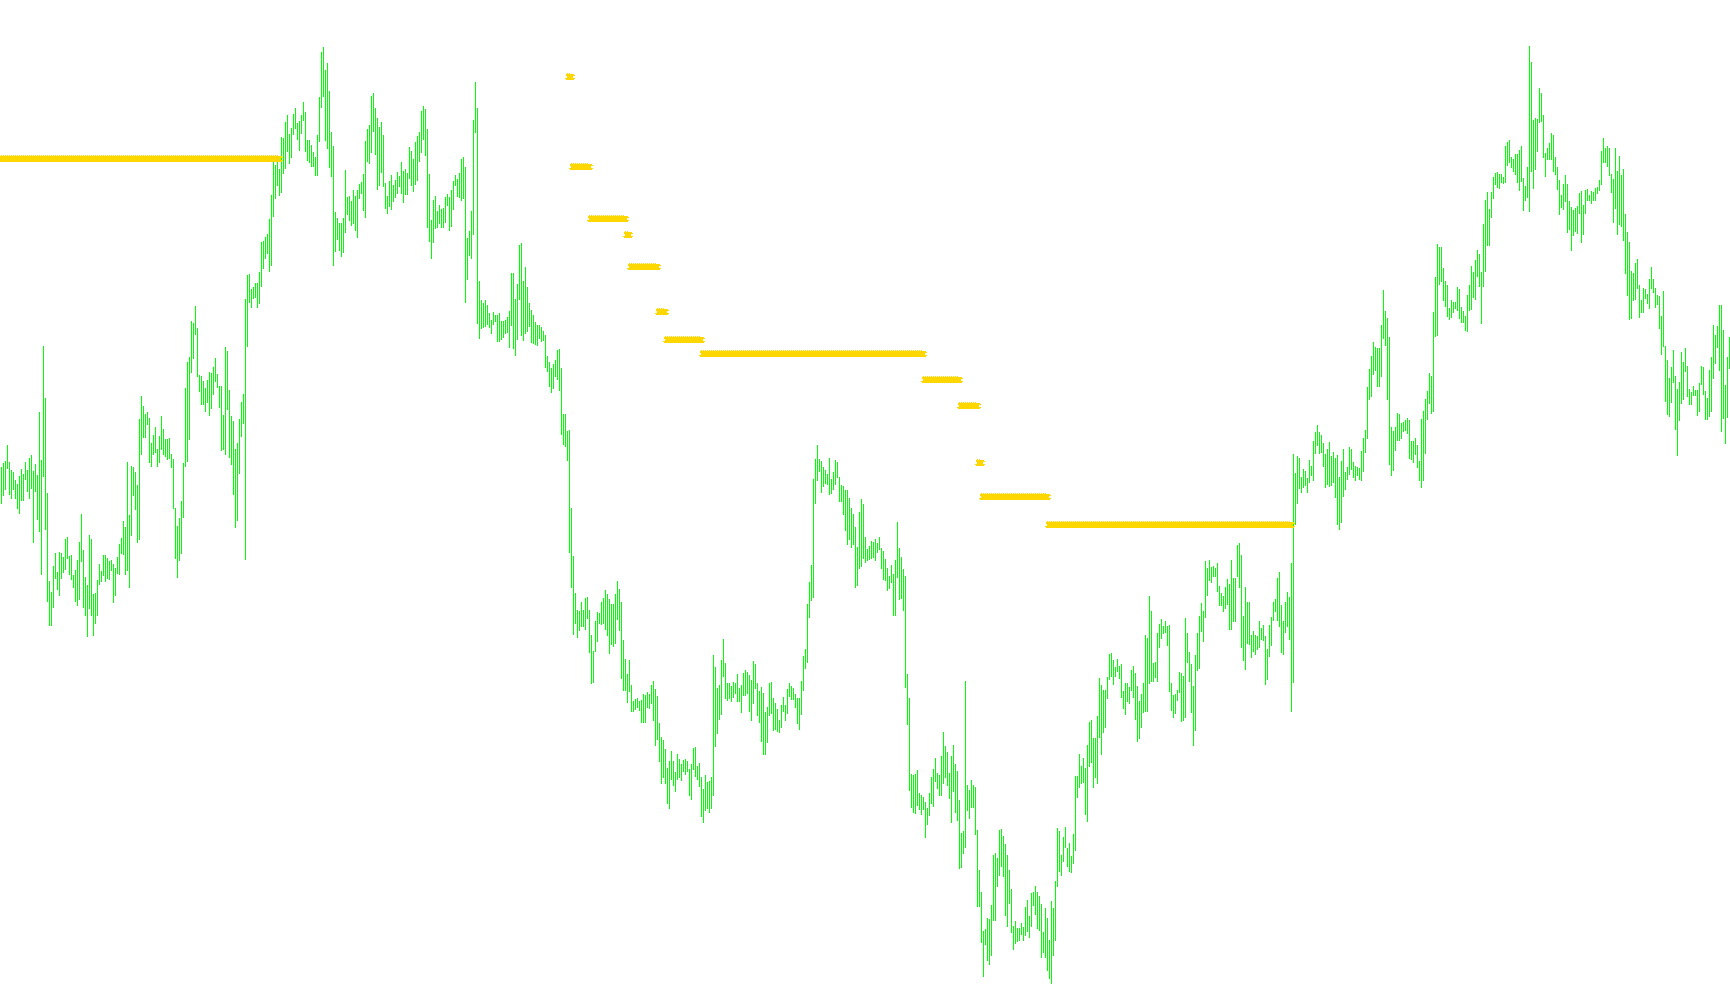
This indicator identifies momentum shifts by calculating price deviation thresholds and applying a smoothed power-ratio to generate a dynamic trend mapping.

NRTR 1
Indicator

NRTR 1

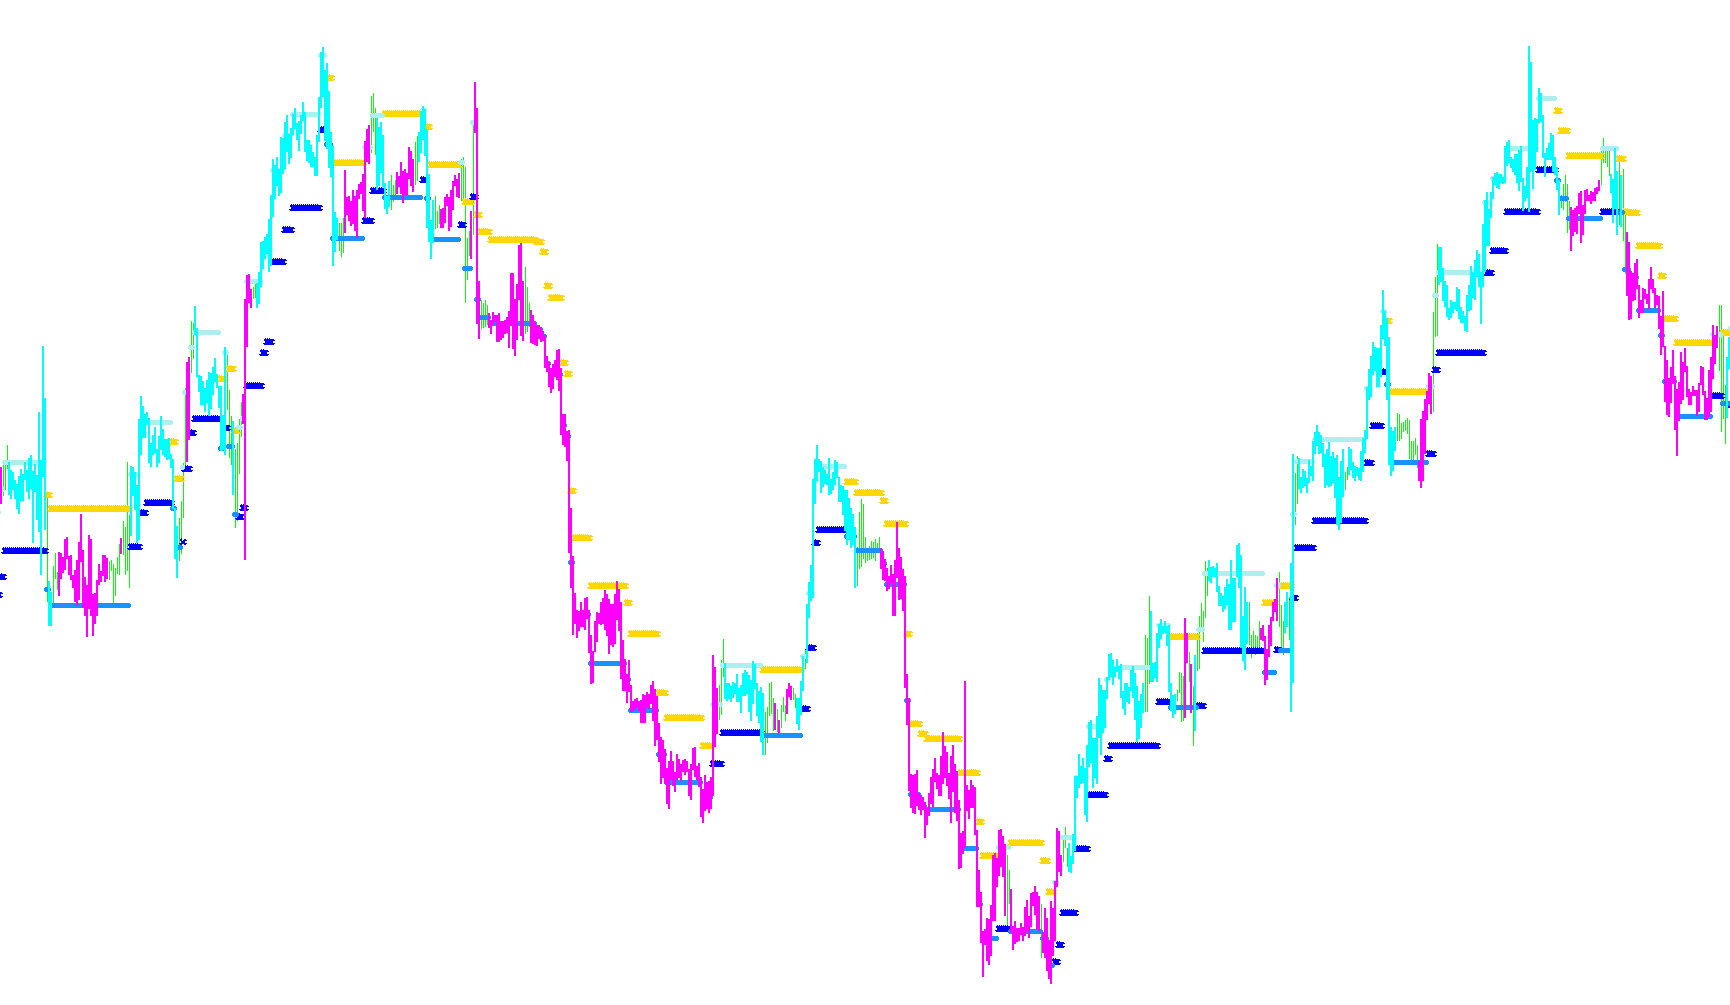
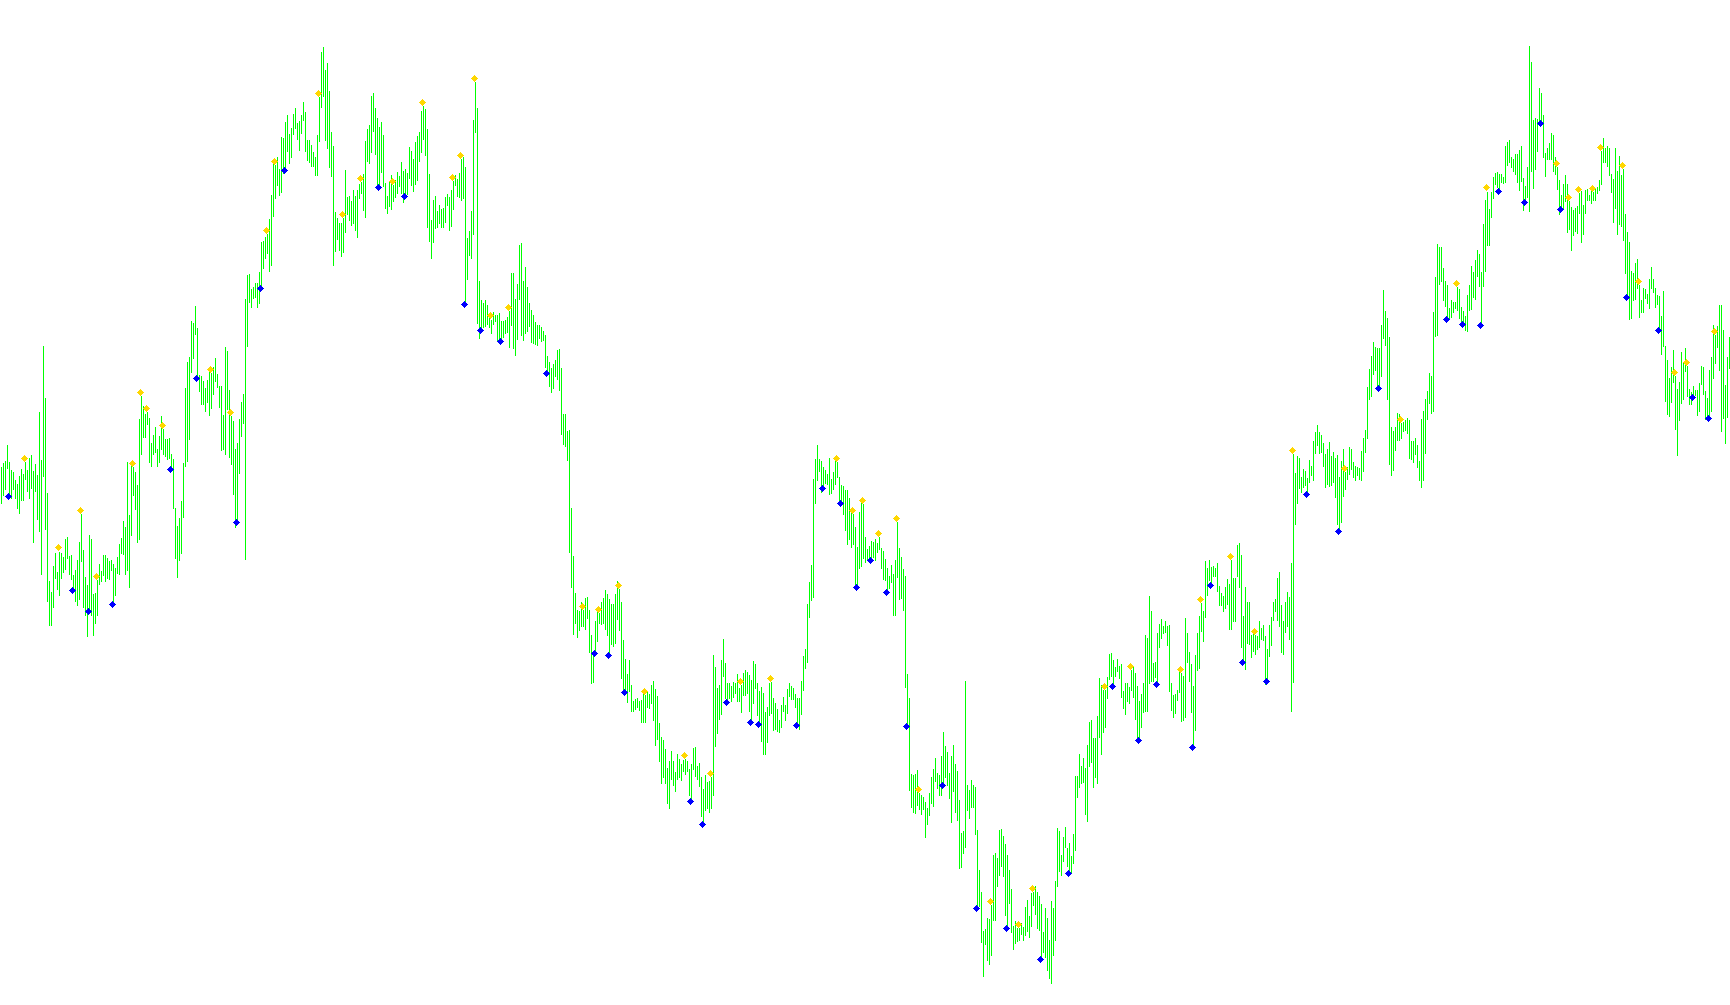
This indicator identifies structural trend shifts by tracking price momentum against a volatility-adjusted threshold based on the average high-low range.

NRTR 1_v1
Indicator

NRTR 1_v1

This indicator identifies trend structural shifts by tracking price penetration against a dynamically calculated volatility-adjusted trailing threshold.

NRTR Gator
Indicator

NRTR Gator

iAlligatoriATR

This indicator combines NRTR (Nick Rypock Trailing Reverse) with the Alligator indicator to generate buy/sell signals based on trend reversals and volatility-adjusted price levels.

NRTR Pilot Alert
Indicator

NRTR Pilot Alert

The indicator identifies trend direction and calculates dynamic stop-loss levels by applying a volatility-adjusted buffer to recent price action extremes.

NRTR Pilot Alert_v1
Indicator

NRTR Pilot Alert_v1

This indicator calculates a dynamic trailing stop loss by applying a percentage buffer based on the average historical candle range to identify trend exhaustion points.

NRTR Rosh v2
Indicator

NRTR Rosh v2

iATR

This indicator identifies trend reversals and volatility-adjusted support/resistance levels by monitoring price breaches relative to ATR-based dynamic buffers.

NRTR Rosh v2_v1
Indicator

NRTR Rosh v2_v1

iATR

This indicator identifies trend shifts and volatility-adjusted price levels by monitoring structural breaks relative to ATR-based dynamic buffers.

NRTR Rosh v2_v2
Indicator

NRTR Rosh v2_v2

iATR

This indicator detects structural market shifts by monitoring price breaches against volatility-adjusted ceiling and floor levels derived from the Average True Range.

NRTR Rosh v2_v3
Indicator

NRTR Rosh v2_v3

iATR

This indicator identifies trend shifts by monitoring price breaches of volatility-adjusted ceilings and floors derived from Average True Range dynamics.

NRTR Rosh
Indicator

NRTR Rosh

iATR

This indicator identifies market directional shifts by dynamically recalculating support and resistance levels based on Average True Range volatility to signal trend reversals.

NRTR WATR-hist
Indicator

NRTR WATR-hist

The indicator calculates a weighted average range to establish dynamic price boundaries that shift based on trend polarity and real-time volatility expansion.

NRTR WATR-hist_v1
Indicator

NRTR WATR-hist_v1

This indicator identifies market direction by calculating a weighted average price range to project dynamic support and resistance boundaries based on trend reversals.

NRTR WATR
Indicator

NRTR WATR

This indicator identifies trend reversals by calculating a weighted average price range to project dynamic support and resistance boundaries relative to historical price action.

NRTR WATR1
Indicator

NRTR WATR1

This indicator identifies trend reversals by calculating a weighted average range to determine dynamic price thresholds for trailing stop-loss levels.

NRTR WATR_v1
Indicator

NRTR WATR_v1

This indicator calculates a volatility-adjusted trailing stop by applying a weighted average range factor to historical price action to identify structural trend reversals.

NRTR WATR_v2
Indicator

NRTR WATR_v2

The algorithm calculates a weighted average range to project dynamic price boundaries, identifying trend reversals when price breaches a calculated volatility offset.

NRTR
Indicator

NRTR

This indicator identifies market structure by calculating a volatility-adjusted threshold based on average price range and projecting trailing price pivots to detect trend reversals.

NRTR1
Indicator

NRTR1

The algorithm identifies momentum shifts by detecting price breaches of a trailing threshold calculated from the moving average of high-low range volatility.

NRTR_ATR_STOP
Indicator

NRTR_ATR_STOP

iATR

This indicator dynamically plots trailing support and resistance levels based on a multiplier of the Average True Range to identify structural pivots and trend reversals.

NRTR_ATR_STOP_v1
Indicator

NRTR_ATR_STOP_v1

iATR

This indicator dynamically plots trailing support and resistance levels based on ATR volatility to identify trend reversals and breakout shifts.

NRTR_color_line
Indicator

NRTR_color_line

This indicator identifies market trend shifts by monitoring price excursions beyond an ATR-based volatility channel relative to a trailing extremum point.

NRTR_color_line1
Indicator

NRTR_color_line1

This indicator identifies directional shifts by tracking price extremes and monitoring volatility-adjusted breakouts using a weighted ATR channel.

NRTR_color_line1_v1
Indicator

NRTR_color_line1_v1

This indicator identifies trend reversals by monitoring price breaches of an ATR-based volatility channel anchored to historical price extrema.

NRTR_color_line_v1
Indicator

NRTR_color_line_v1

The algorithm identifies structural trend shifts by tracking historical extremes and dynamically expanding/contracting price boundaries based on a weighted Average True Range volatility coefficient.
NRTR_dots1
Indicator

NRTR_dots1

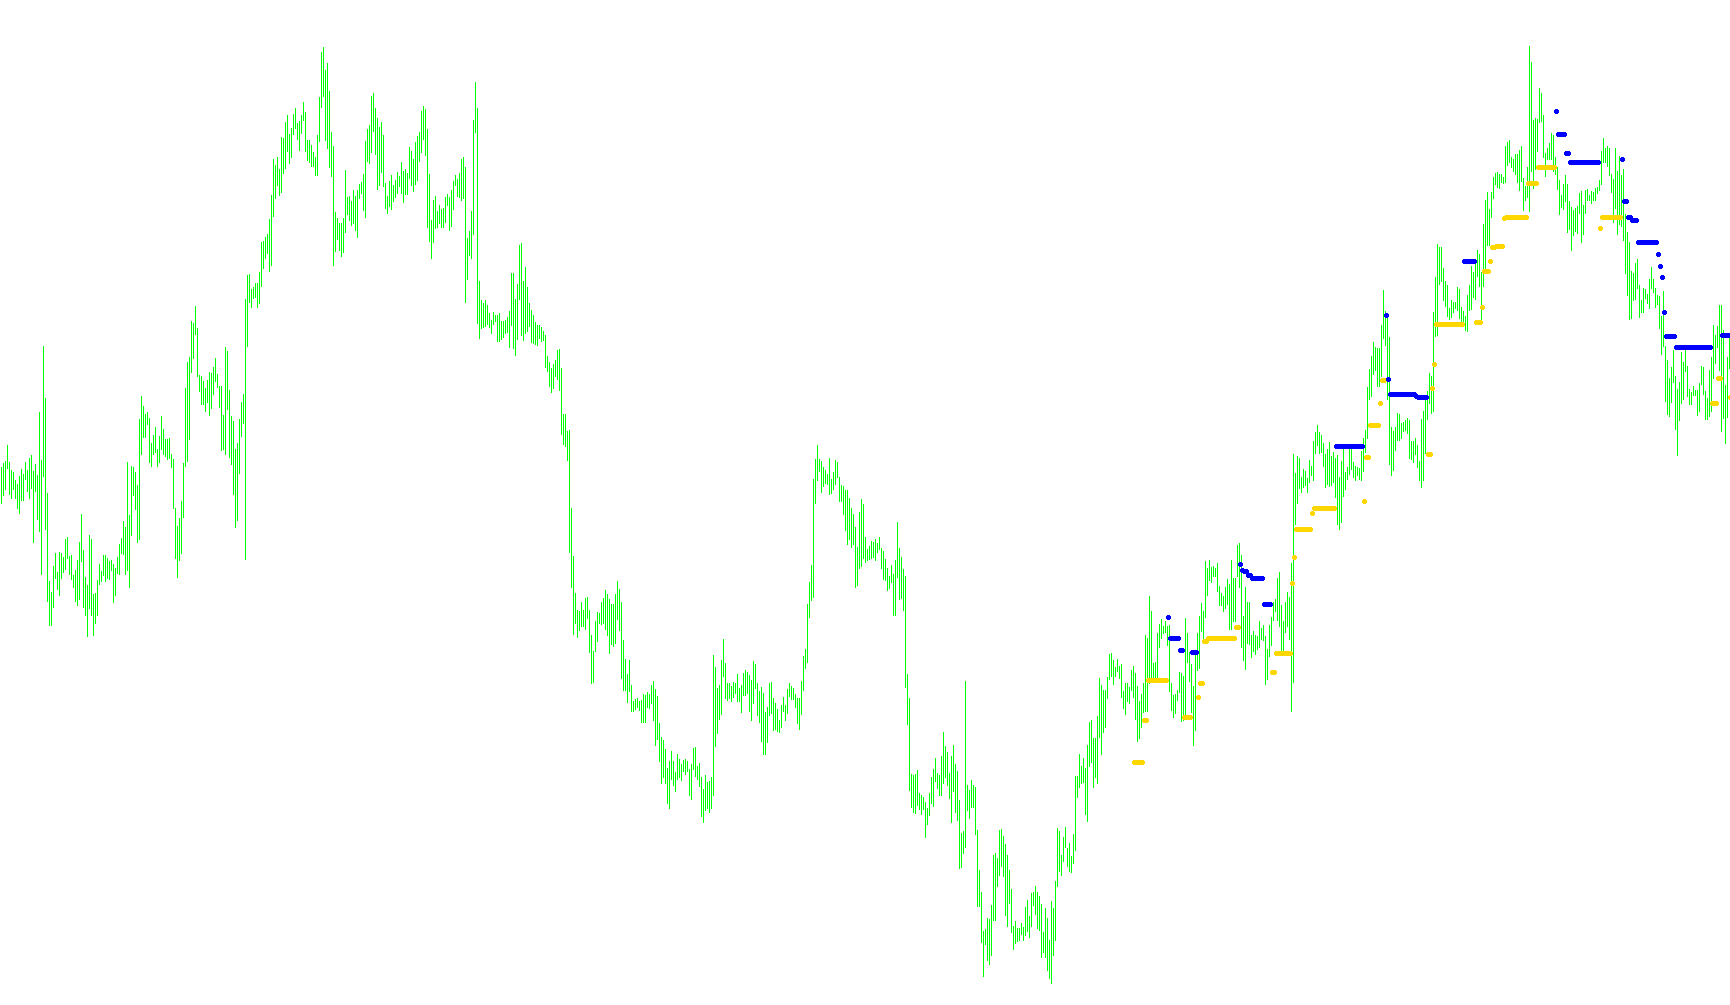
The algorithm identifies trend reversals by monitoring price deviations relative to a rolling average range of price fluctuations and spreads.
NRTR_Line1
Indicator

NRTR_Line1

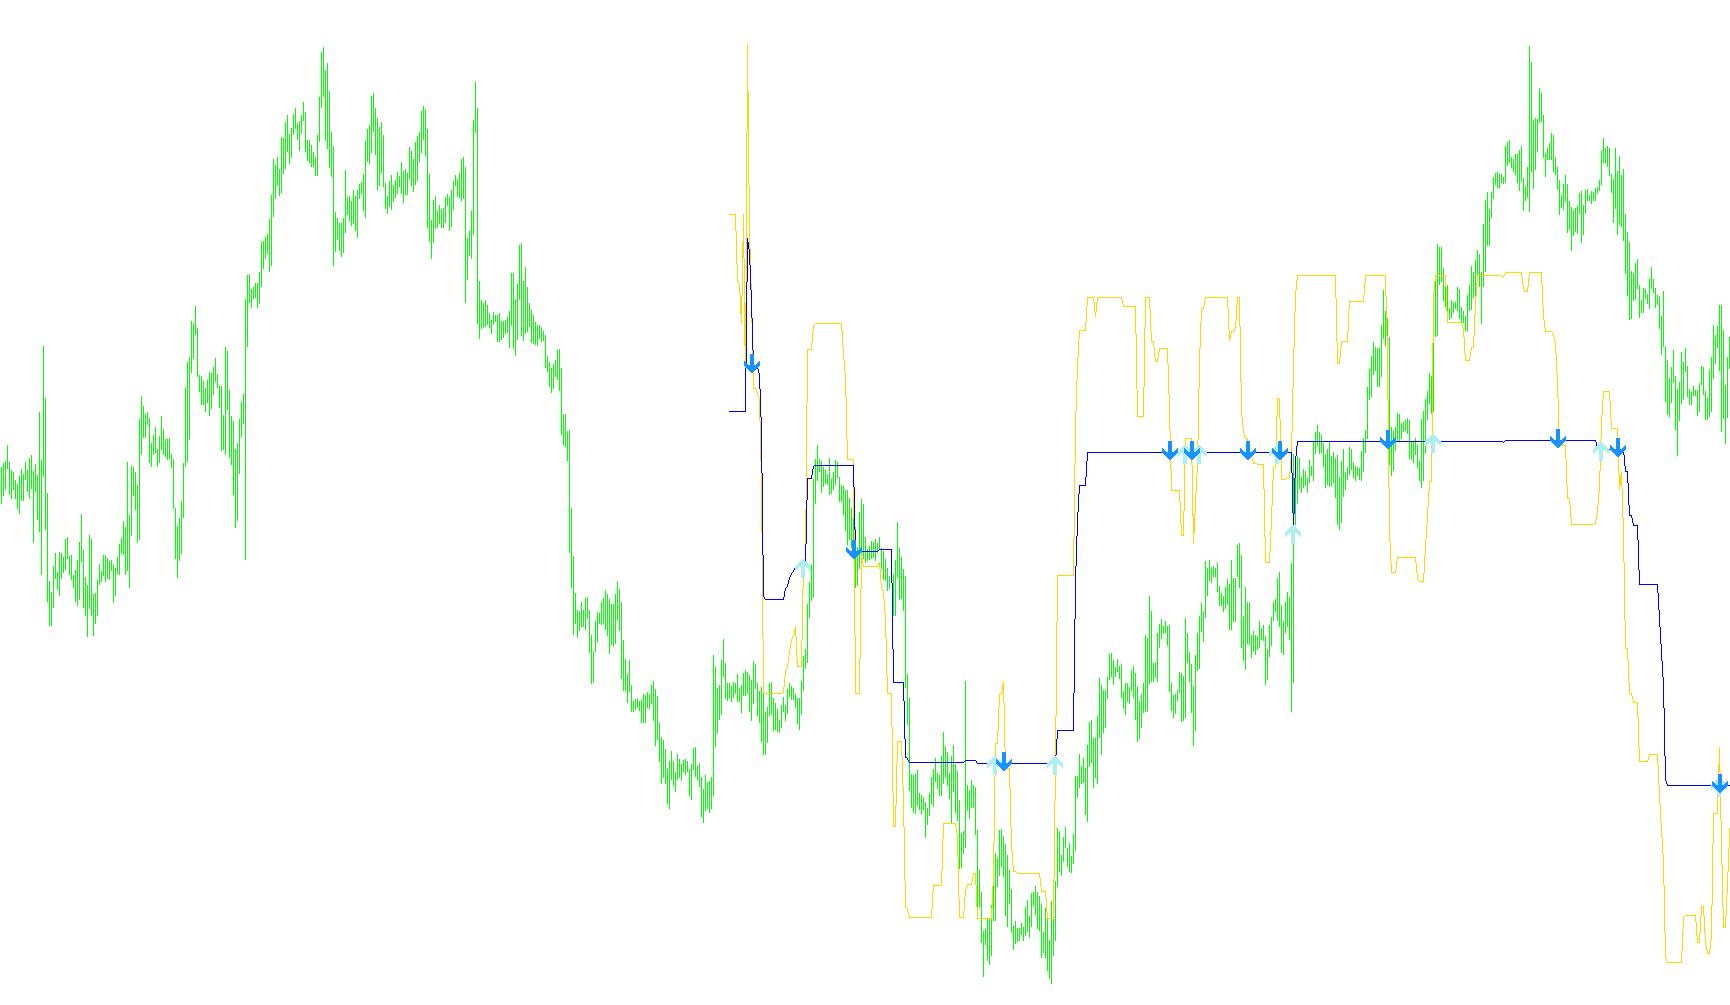
This indicator identifies trend reversals by calculating a moving average of price ranges and projecting a trailing boundary that flips polarity based on price breakouts.

NRTR_NK
Indicator

NRTR_NK

This indicator tracks trend direction and price exhaustion by calculating a volatility-adjusted momentum threshold based on historical range averages.

NRTR_Pilot911
Indicator

NRTR_Pilot911

This indicator identifies trend reversal points by calculating a volatility-adjusted price threshold based on historical range averages and real-time price action.

NRTR_Pilot911_v1
Indicator

NRTR_Pilot911_v1

This indicator identifies momentum shifts by calculating a dynamic deviation factor based on historical price ranges and detecting structural breaches in price action.

NRTR_Pilot_5F2alert
Indicator

NRTR_Pilot_5F2alert

iAC

This indicator identifies potential trend reversals by detecting specific directional shifts and structural pivots within the Accumulation/Distribution (AC) oscillator values.

NRTR_Pilot_alert
Indicator

NRTR_Pilot_alert

This indicator calculates a trailing stop-loss level by factoring in historical volatility and price momentum to dynamically adjust support and resistance boundaries.

NRTR_Pilot__alert
Indicator

NRTR_Pilot__alert

This indicator calculates a reactive trailing stop level based on the average price range to dynamically adjust profit protection during trend movements.

Indicator

NRTR_Rosh_v2eAlert_mtf

iATR
Indicator

NRTR_Rosh_v2e_mtf[1]

iATR
NRTR_v1
Indicator

NRTR_v1

This indicator identifies structural trend shifts by monitoring price breaches against a trailing volatility-adjusted corridor derived from average bar ranges.

NRTR_v2
Indicator

NRTR_v2

This indicator identifies trend shifts by monitoring price breaches against a dynamic threshold calculated from the average relative range and historical candle volatility.

NRTR_WATR
Indicator

NRTR_WATR

This indicator identifies trend reversals by projecting a dynamic price boundary based on weighted average volatility and relative range expansion.

N_StepMA_1.2_Email
Indicator

N_StepMA_1.2_Email

This indicator calculates a staircase-style moving average based on weighted price range volatility to identify momentum shifts and signal trend reversals via crossover logic.

N_StepMA_1_Email
Indicator

N_StepMA_1_Email

This indicator identifies trend reversals by calculating a volatility-adjusted step price range and detecting crossovers between multi-tiered momentum buffers.

ObjectGetValuue_ByCurrent_
Indicator

ObjectGetValuue_ByCurrent_

This algorithm calculates real-time price deviations and linear adjustments of trend objects by interpolating delta values based on elapsed bar duration.

ObjectGetValuue_ByCurrent_en
Indicator

ObjectGetValuue_ByCurrent_en

The script calculates and visualizes the intra-candle price fluctuation by extrapolating historical trendline deltas against the current elapsed time of the active bar.

Indicator

ObjectSquare

OBV
Indicator

OBV

This indicator aggregates trading volume by correlating price fluctuations with directional shifts to reveal underlying liquidity flows.

Indicator

OBV_OnBalanceVolume_MTF

iOBV
OHLC
Indicator

OHLC

This tool extracts and displays the opening, high, low, and closing price metrics alongside the total point range for both the current and previous daily candles.

OHLC_v1
Indicator

OHLC_v1

This indicator extracts and displays real-time price data for the current and previous daily candles, specifically highlighting opening, high, low, and closing values alongside calculated volatility ranges.

oilfxpro gbp breakout corrected
Indicator

oilfxpro gbp breakout corrected

This indicator identifies intraday volatility boundaries by capturing high and low price extremes from specific time windows to project potential breakout levels.