NDuet
Indicator

NDuet

iCCIiMA

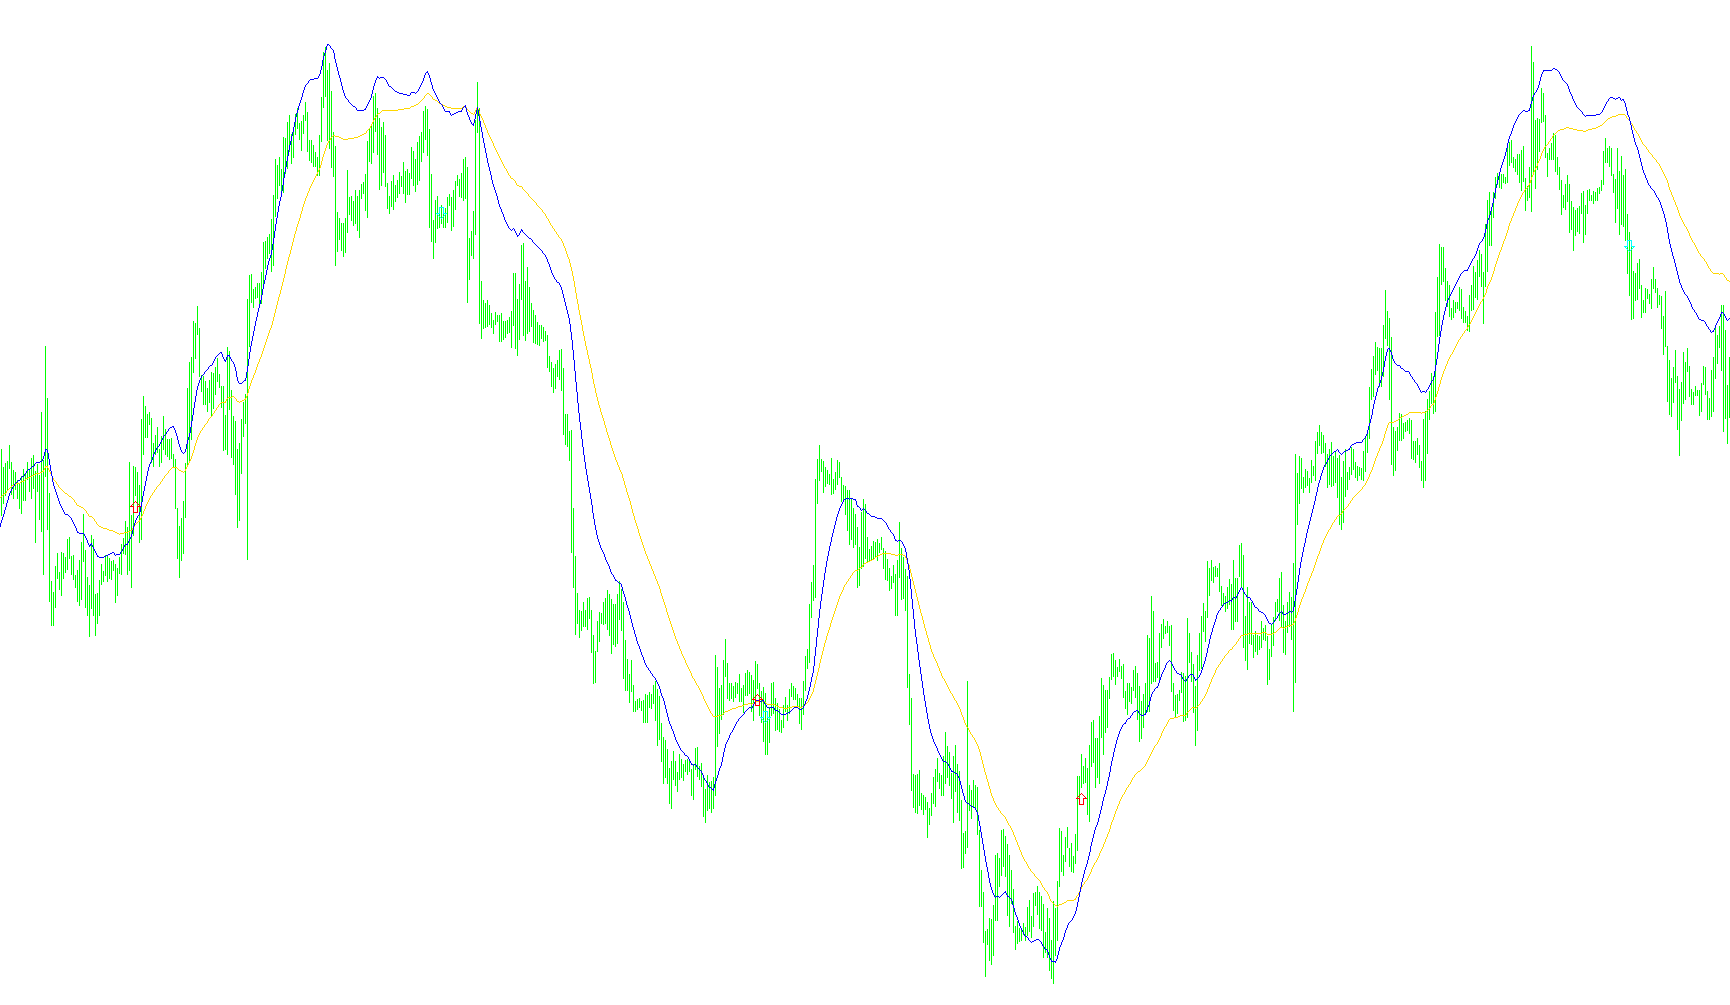
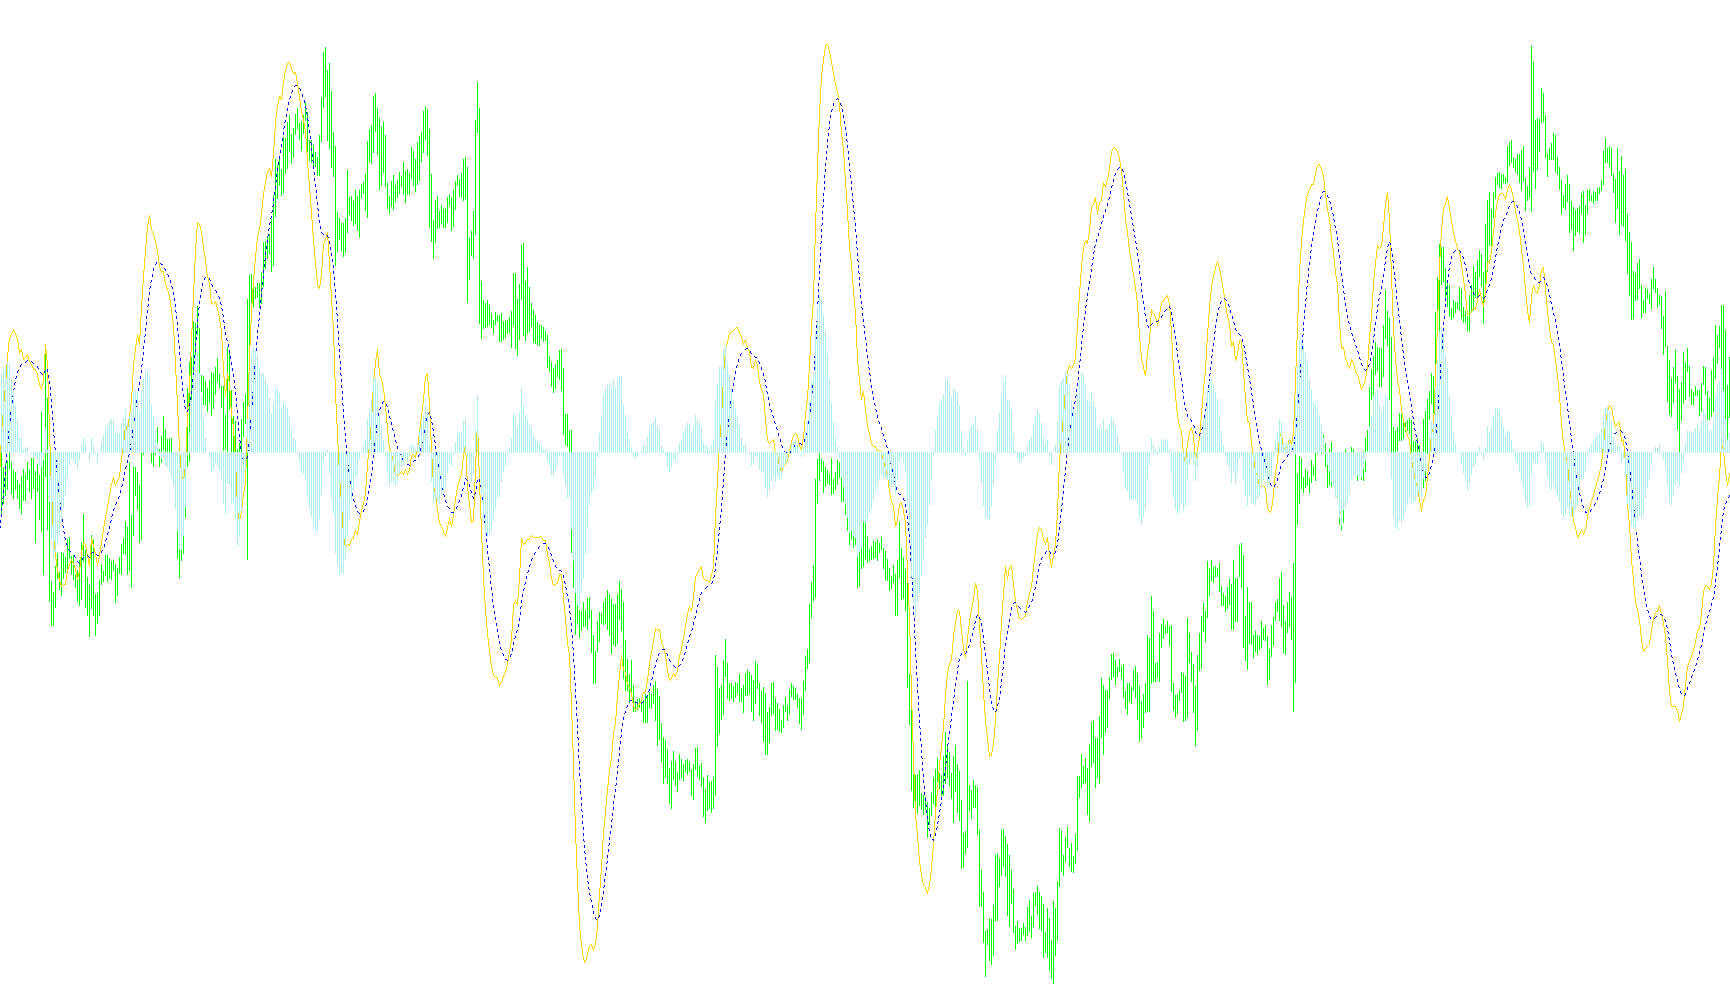
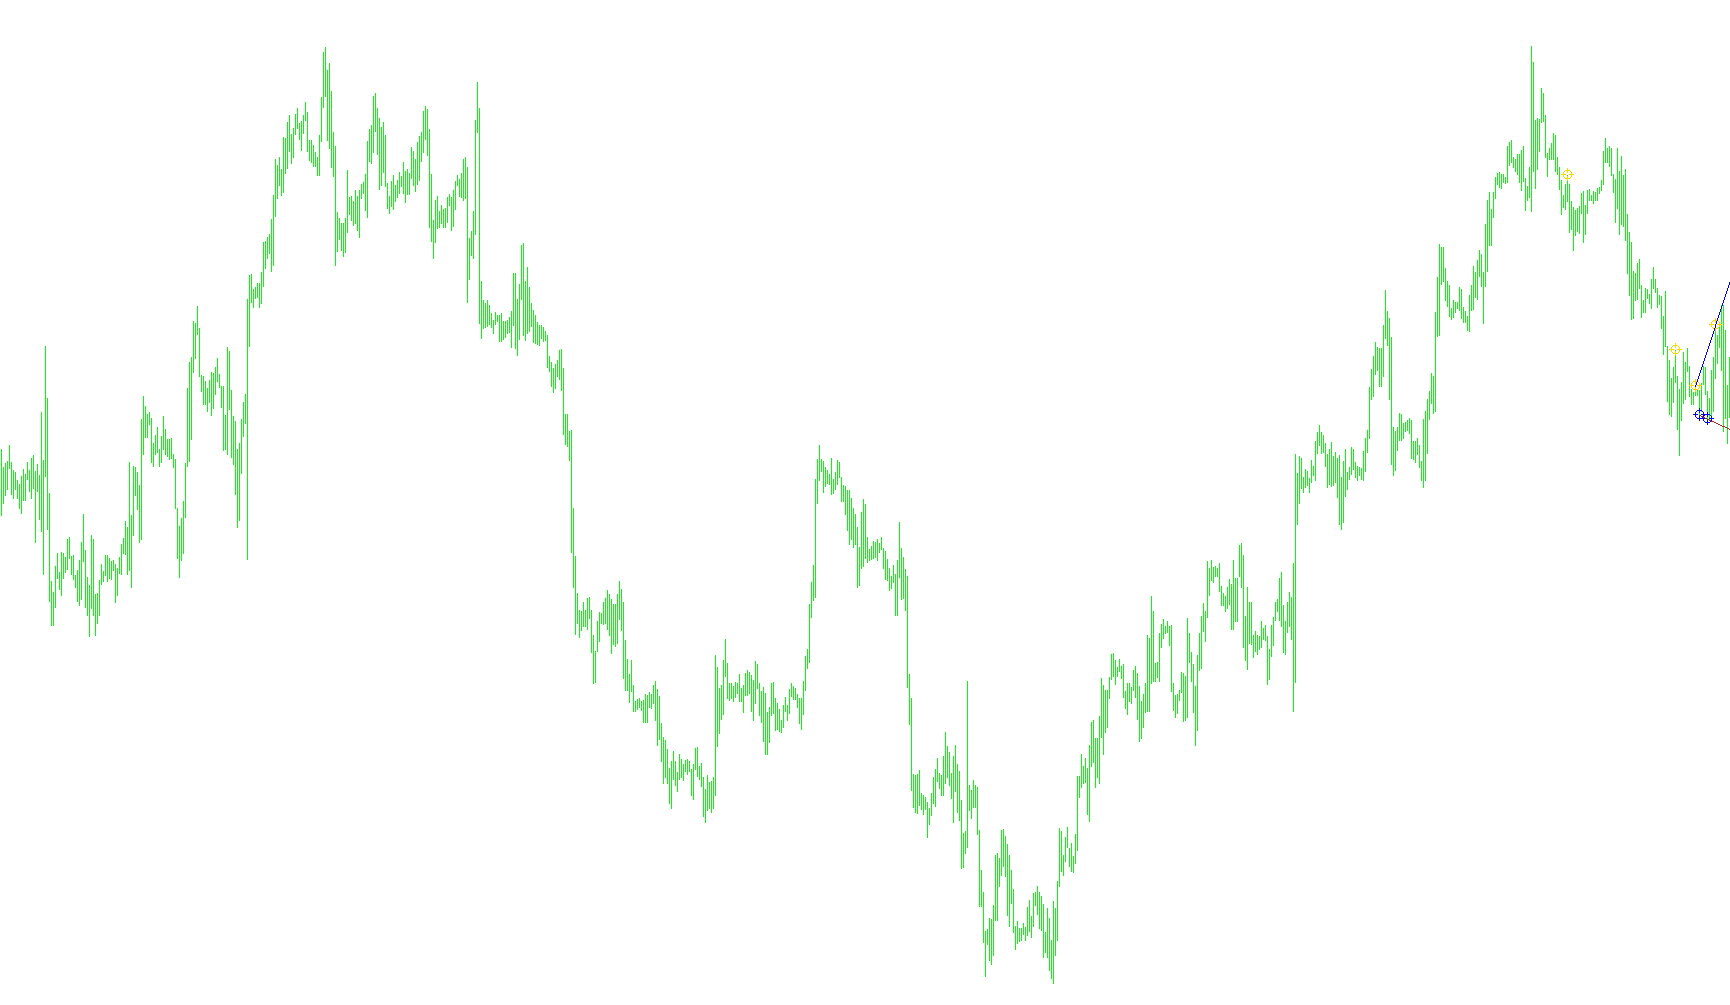
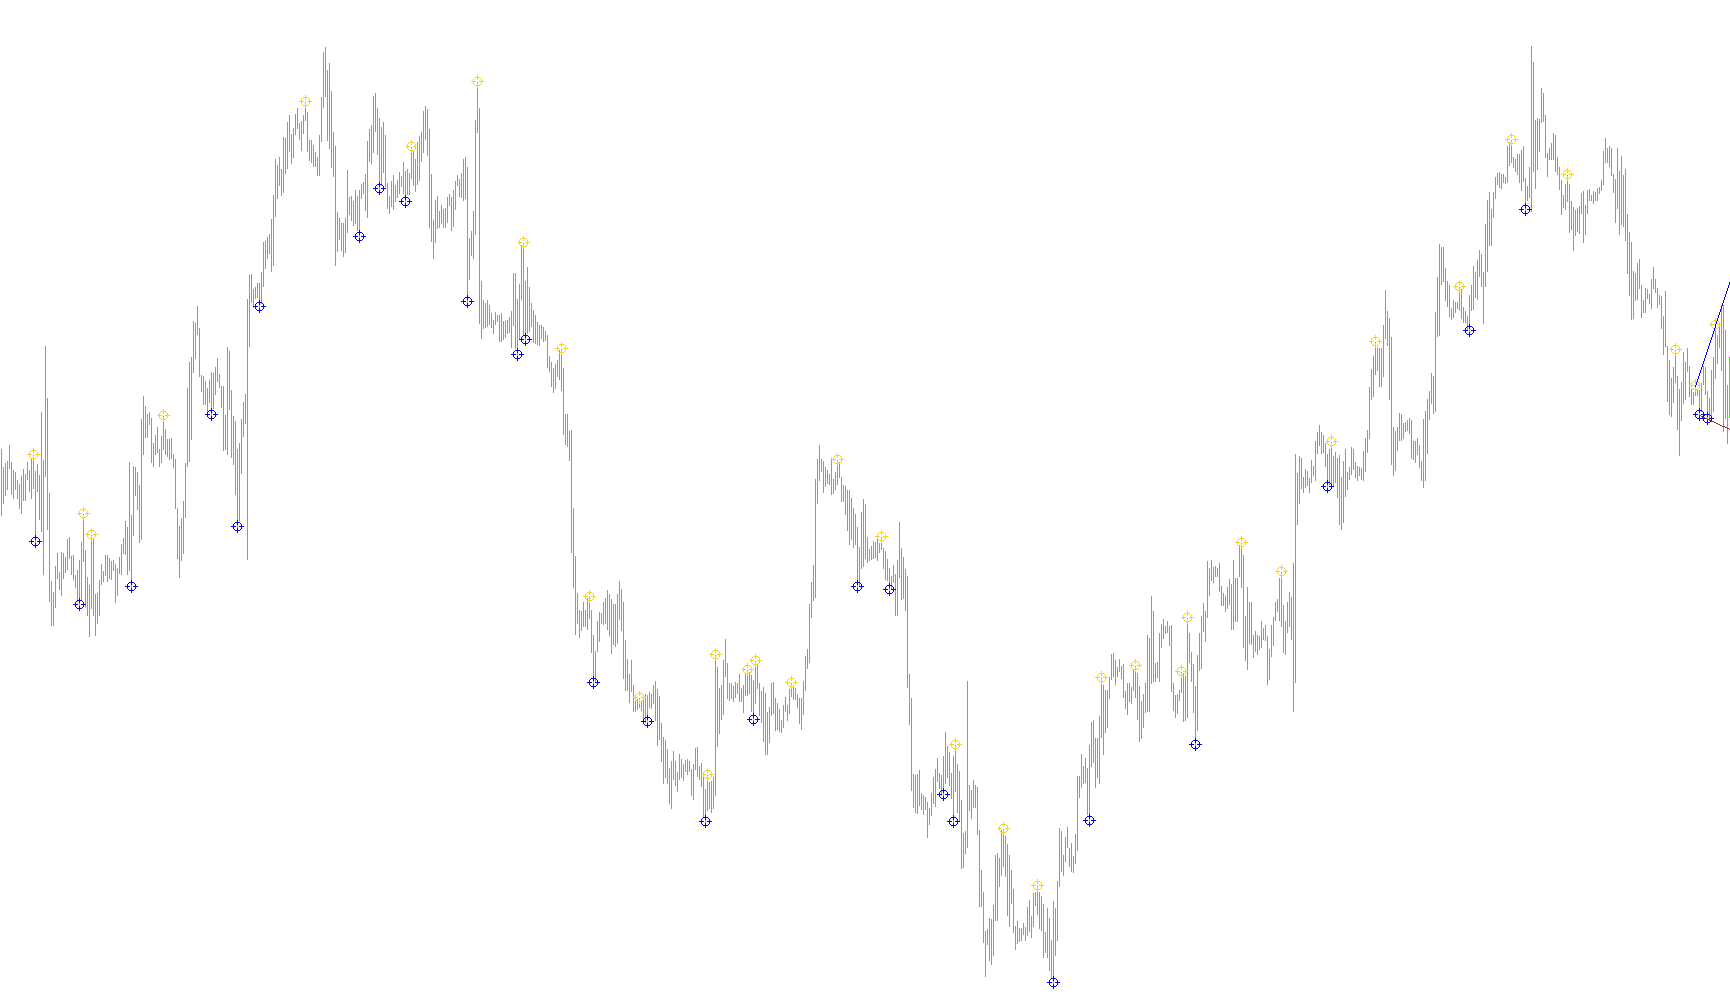
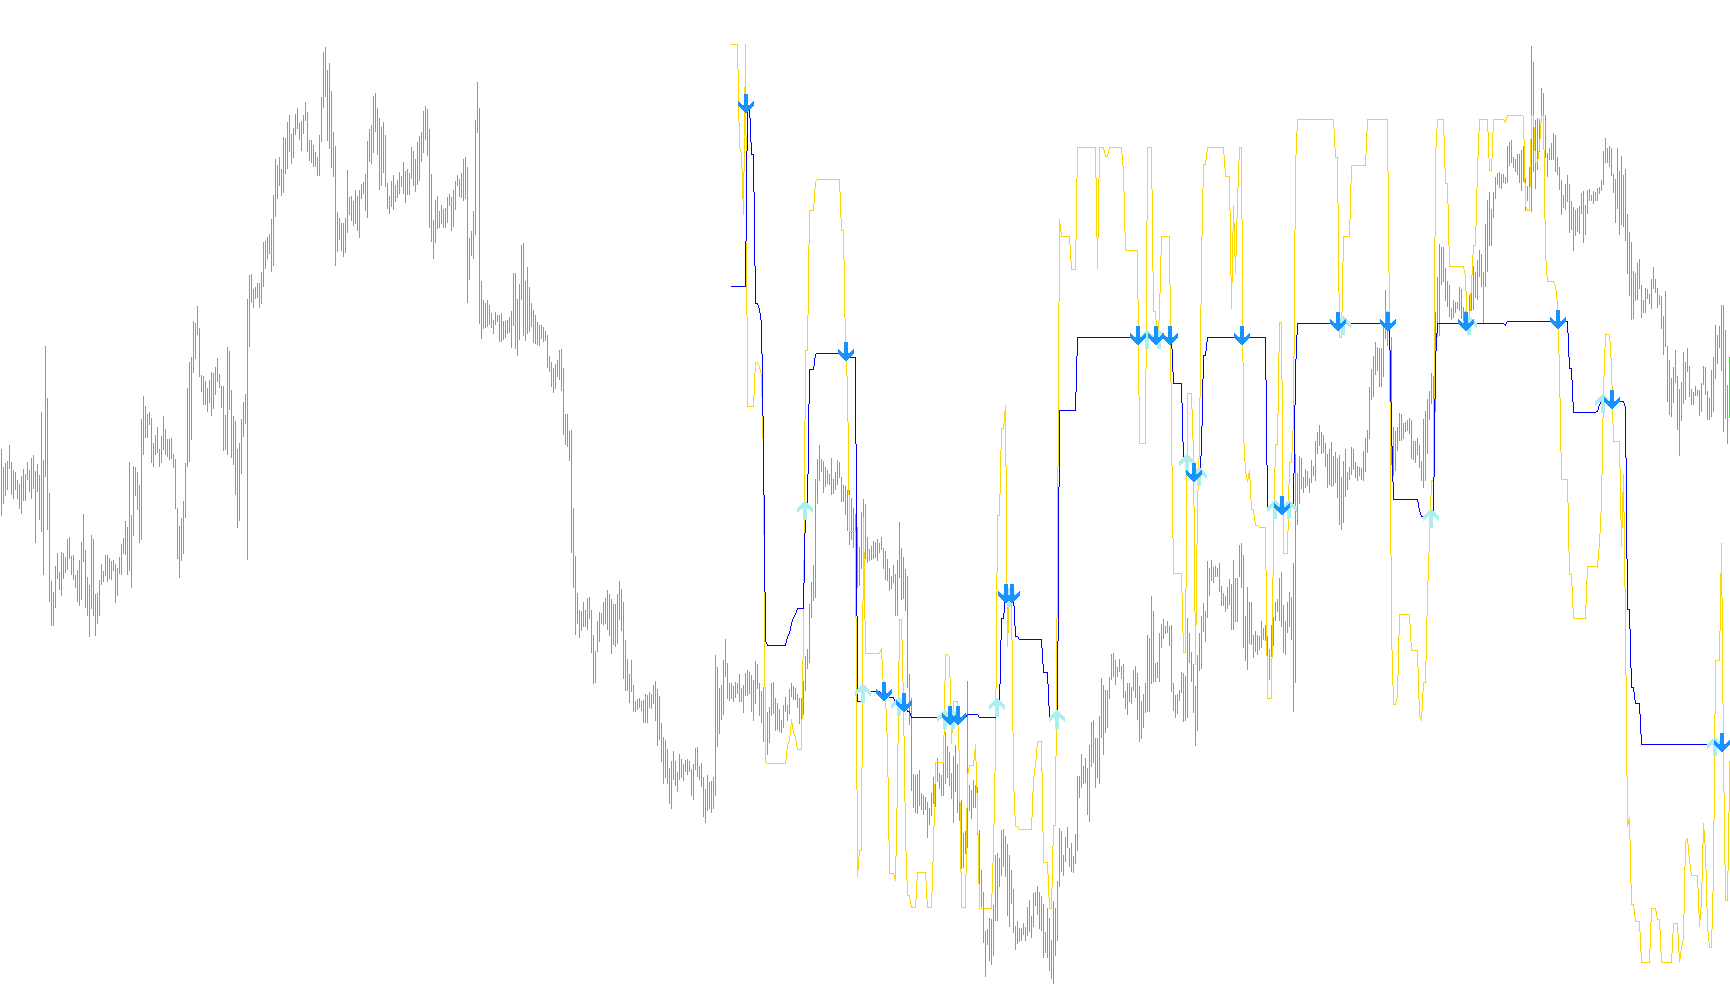
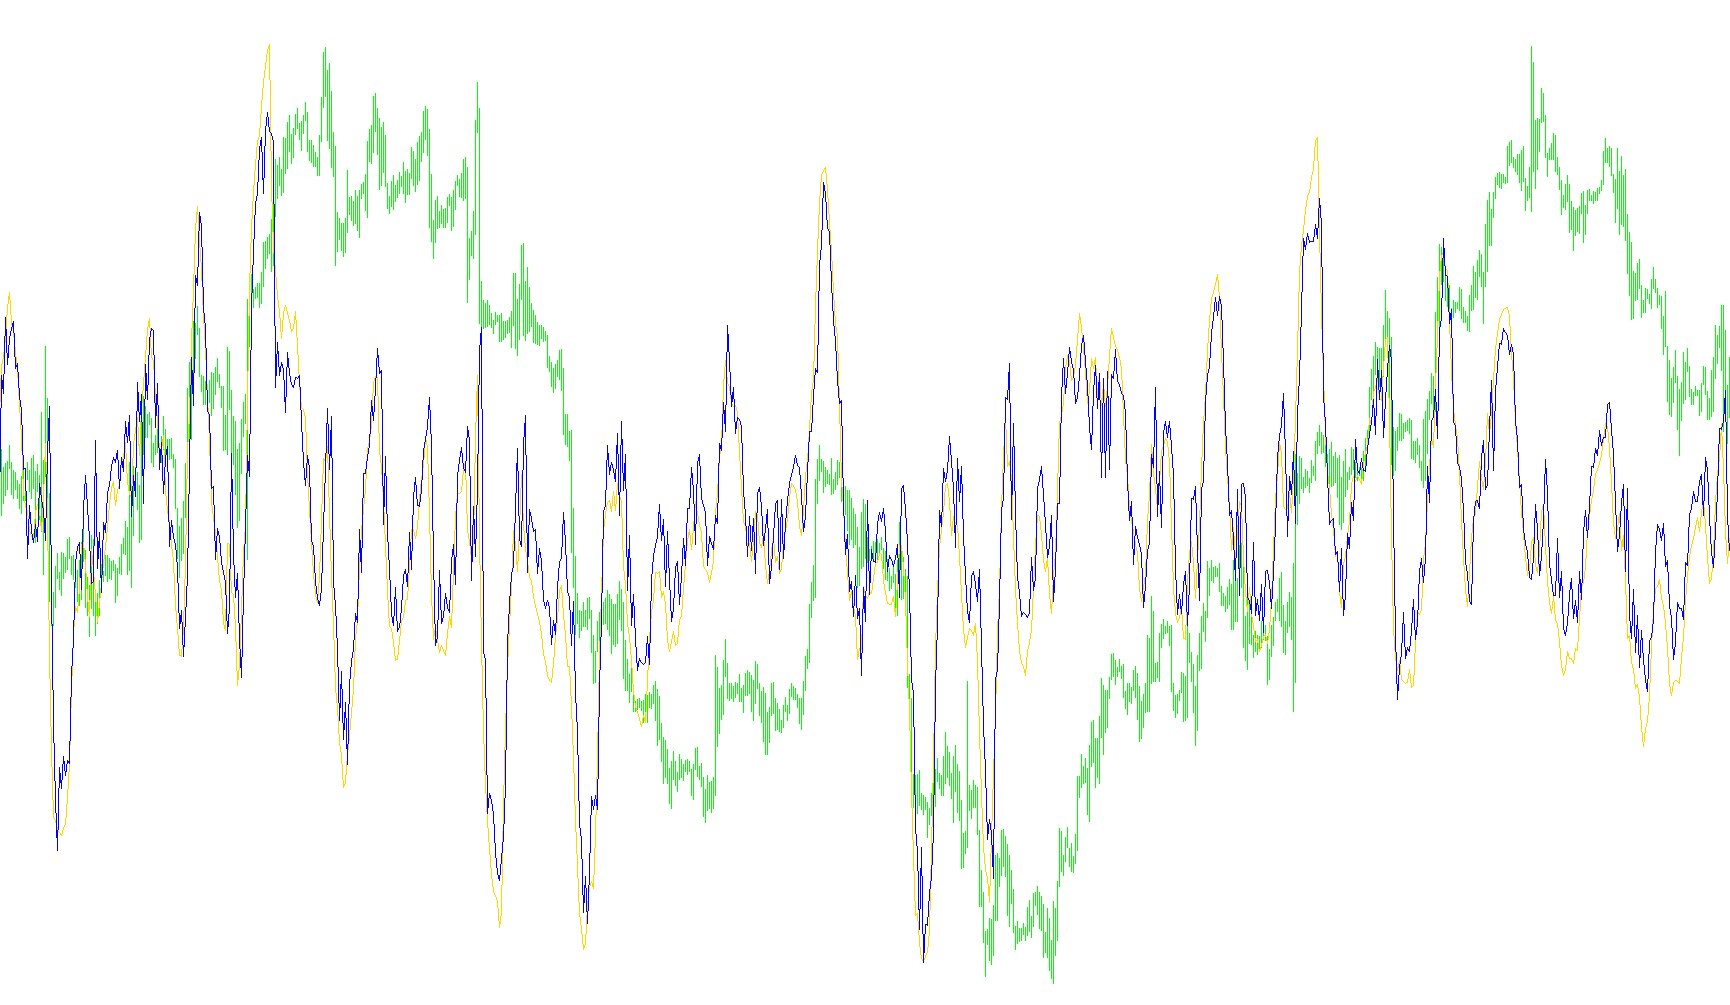
This indicator identifies potential trend exhaustion by detecting specific EMA convergence zones coupled with CCI polarity shifts and opposing price momentum.

NDuet_v1
Indicator

NDuet_v1

iCCIiMA

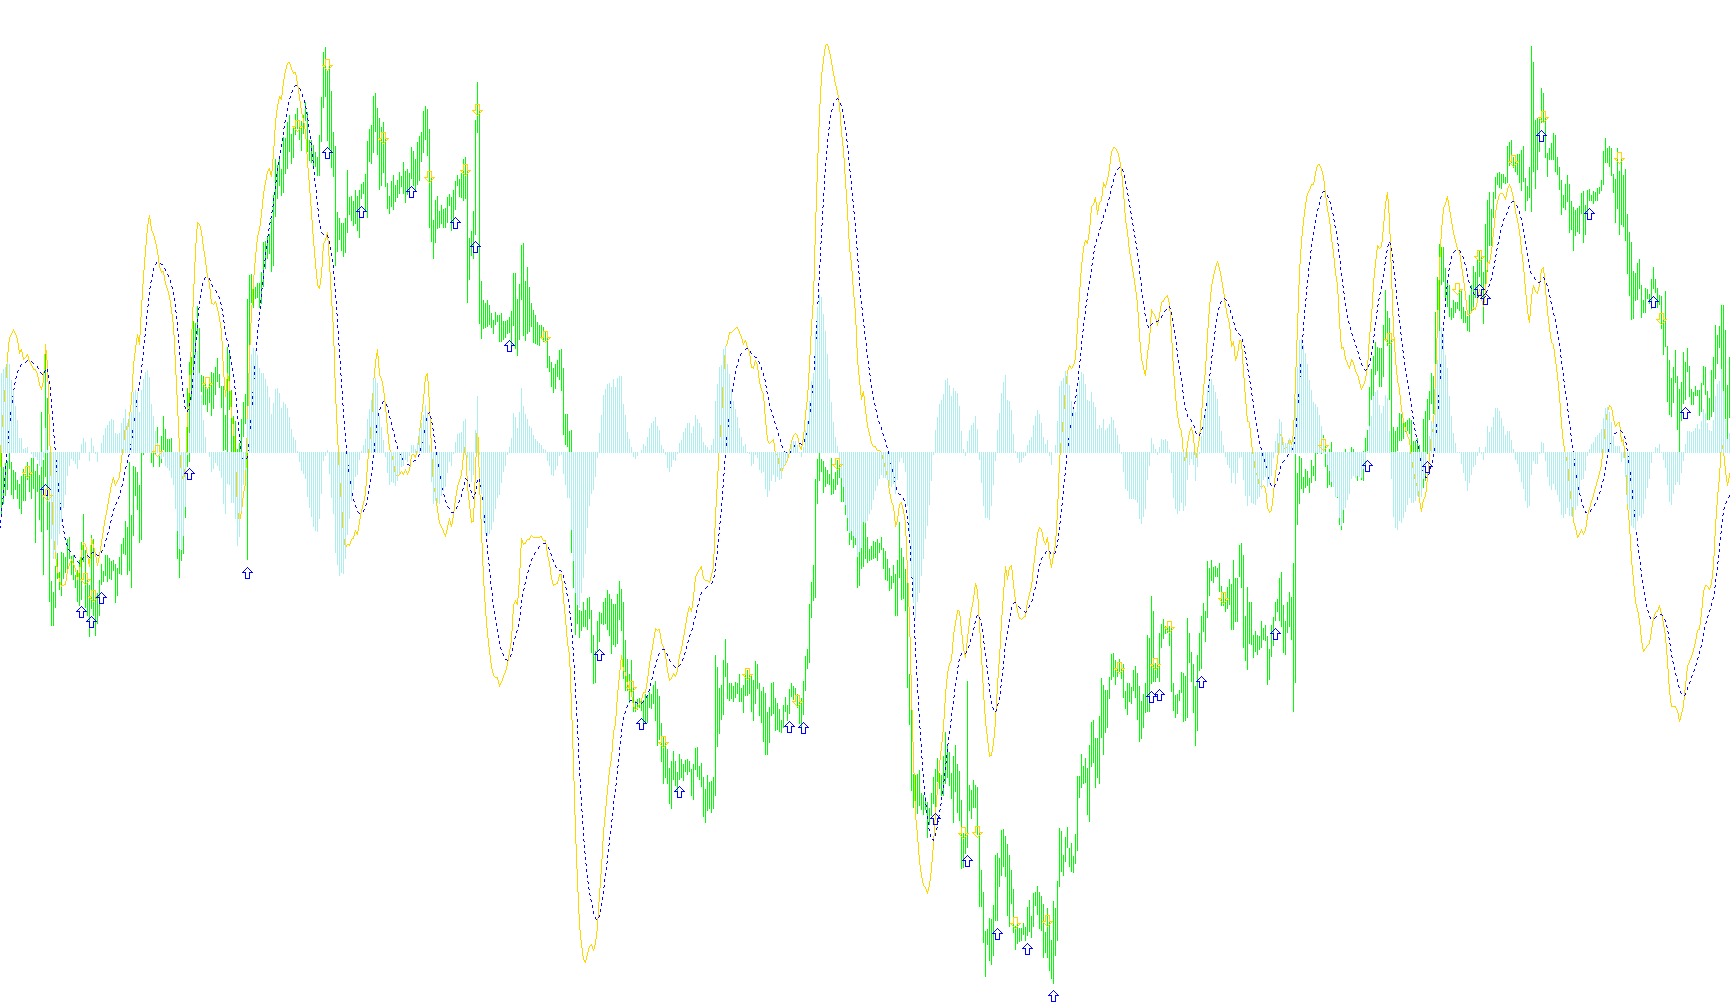
This indicator identifies potential reversals by detecting the intersection of dual Exponential Moving Averages in conjunction with ZigZag structural shifts, CCI momentum polarity, and directional price velocity.

NeuroProba
Indicator

NeuroProba

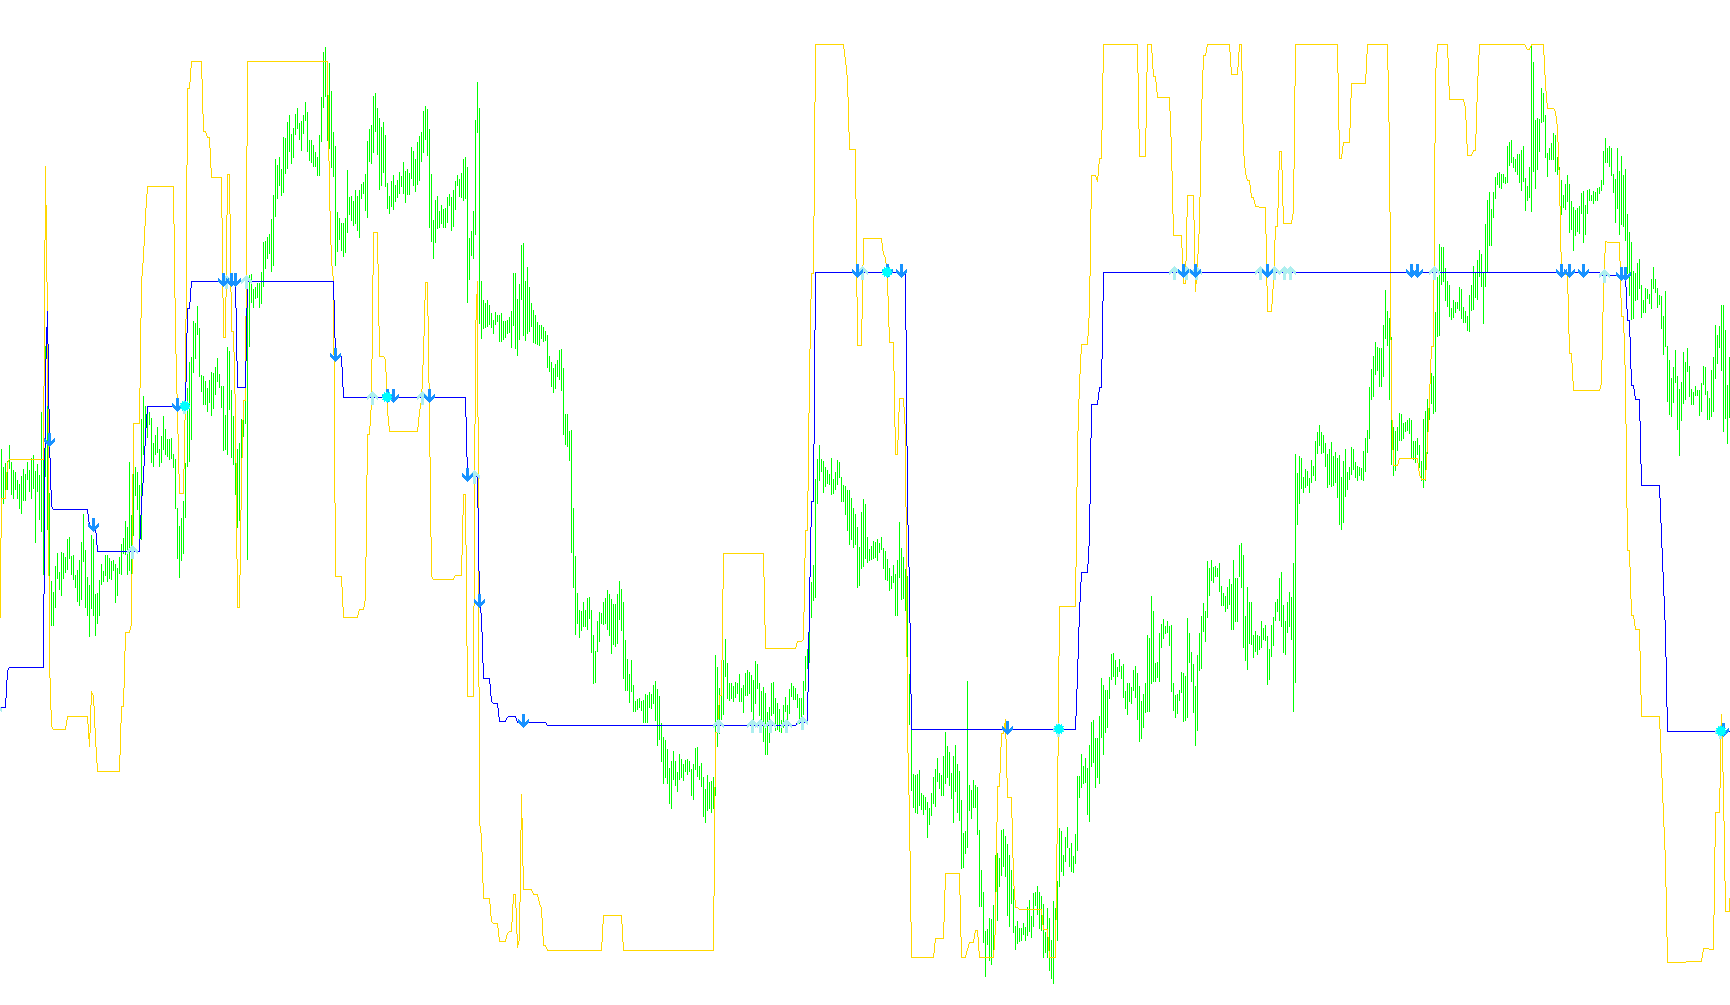
This indicator employs a multi-layer perceptron architecture with backpropagation to minimize the deviation between predicted outputs and teacher signals derived from Kaufman adaptive trends.

NeuroProba[1]
Indicator

NeuroProba[1]

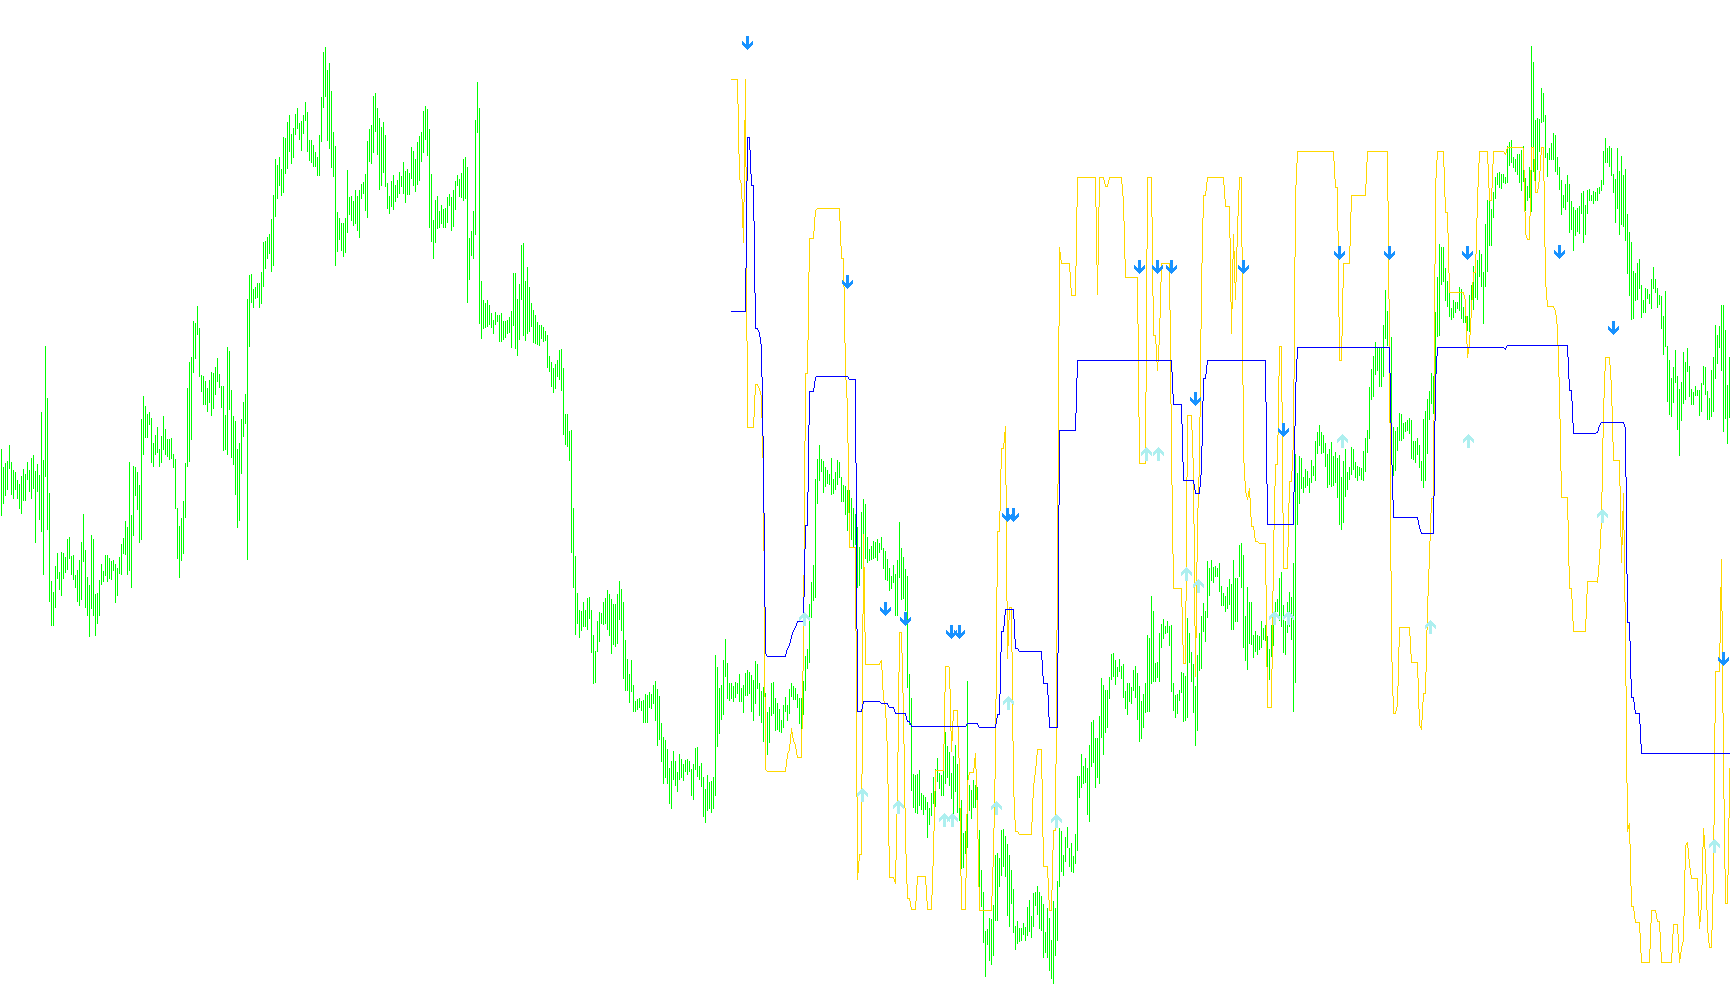
This indicator utilizes a multi-layer perceptron with backpropagation to learn and predict market trends based on normalized price differentials and Kaufman adaptive signals.

NeuroProba_v1
Indicator

NeuroProba_v1

This indicator utilizes a multi-layer perceptron architecture to train an artificial neural network against Kaufman trend signals, employing backpropagation and hyperbolic tangent activation functions to minimize prediction error.

NeuroProba_v2
Indicator

NeuroProba_v2

This indicator employs a multi-layer perceptron neural network that undergoes backpropagation training on historical Kaufman signals to map normalized price momentum into predictive sigmoid outputs.

NeuroTrend
Indicator

NeuroTrend

The algorithm identifies multi-layered price action boundaries by dynamically shifting between localized high and low extrema based on real-time closing price crossovers.

Indicator

NeuroTrend_Indicator

iWPRiMAiRSIiStochastic
NeutralHedge osc_v1
Indicator

NeutralHedge osc_v1

This indicator calculates the relative price distance between a primary symbol and a secondary correlated asset by mapping their respective volatility ranges to identify extreme directional imbalances.

NeutralHedge osc_v2
Indicator

NeutralHedge osc_v2

This indicator quantifies the price deviation between a primary asset and a correlated secondary symbol by projecting the sub-symbol's relative range onto the main chart to identify statistical discrepancies.

NeutralHedge osc_v2test
Indicator

NeutralHedge osc_v2test

This tool quantifies the price variance between two assets by calculating their relative volatility ratios and visualizing the divergence as a histogram to identify hedging opportunities.

NeutralHedge osc_v3[1].1
Indicator

NeutralHedge osc_v3[1].1

iMAOnArrayiStdDevOnArray

This indicator quantifies the price discrepancy between a primary and secondary asset by normalizing their relative ranges and identifying statistically significant deviations using standard deviation thresholds.

newMACD
Indicator

newMACD

iMA

This algorithm calculates momentum by determining the spread between two exponential moving averages and smoothing the resulting difference into a trailing signal line and a visual histogram.

newMACD_Alert
Indicator

newMACD_Alert

iMA

This indicator identifies trend reversal points by detecting zero-cross transitions in the MACD histogram and plotting visual markers on the price chart.

Indicator

NewOne

News Alert 2
Indicator

News Alert 2

Monitors real-time price fluctuations to trigger alerts when market spreads or stop levels deviate from established baseline parameters.
News Alert 21
Indicator

News Alert 21

This indicator triggers real-time alerts by detecting significant deviations between current market spreads and stop levels compared to their baseline values.

News Alert 21_v1
Indicator

News Alert 21_v1

Monitors real-time liquidity fluctuations by triggering alerts when current bid-ask differentials or minimum stop distances deviate from established baseline parameters.

News Alert 2_v1
Indicator

News Alert 2_v1

This indicator triggers real-time alerts by detecting sudden expansions in market liquidity metrics and execution constraints.

News Alert Lag
Indicator

News Alert Lag

Monitors real-time market fluctuations by triggering alerts when current bid-ask spreads or broker stop levels deviate significantly from established baseline parameters.

News Alert Lag_v1
Indicator

News Alert Lag_v1

Monitors real-time market liquidity by triggering alerts when current spread or stop level deviations exceed a predefined baseline variance.

NEWS ALERT
Indicator

NEWS ALERT

This script monitors real-time market telemetry to trigger instantaneous alerts when the spread widens beyond defined thresholds or the stop level distance exceeds typical liquidity constraints.

news
Indicator

news

This indicator fetches real-time global economic data via DLL integration to map significant financial events onto charts with automated currency filtering and proactive audio notifications.

Indicator

newscal

NewsReader
Indicator

NewsReader

This indicator parses external CSV datasets to project upcoming economic milestones on the chart and trigger auditory-visual alerts prior to specific release windows.

News_Plotter
Indicator

News_Plotter

This indicator parses a CSV file to plot chronological economic event markers on the chart with tiered importance filtering and automated proactive audio notifications.

NewTrend
Indicator

NewTrend

This indicator calculates price momentum by measuring the divergence between two smoothed velocity components derived from price fluctuations using a Double Exponential Moving Average logic.

New_Candle_Alarm
Indicator

New_Candle_Alarm

This script monitors the temporal progression of price action to trigger an immediate notification whenever a new candlestick period initializes on the active chart.

New_Fractals_Lines
Indicator

New_Fractals_Lines

iFractals

This indicator identifies high-probability trend reversals by filtering fractal extremes through a combined analysis of relative price range volatility and cumulative volume momentum.

New_Fractals_Lines_v1_0_1
Indicator

New_Fractals_Lines_v1_0_1

iFractals

This indicator filters fractal price points by calculating a rolling average of relative price movement against volume to identify high-momentum reversals.

NINA
Indicator

NINA

iMA

The algorithm calculates dynamic price boundaries based on weighted volatility ranges to identify trend reversals and signal high-probability entries relative to an exponential moving average.

Nina_StepMA_1
Indicator

Nina_StepMA_1

This indicator calculates a step-based moving average derived from weighted ATR volatility to generate stochastic momentum signals and trend reversal arrows.

Nina_StepMA_1_Custom3
Indicator

Nina_StepMA_1_Custom3

This indicator identifies trend momentum by calculating multi-level price steps based on weighted volatility ranges and generating crossover signals between normalized stochastic lines.

Nina_StepMA_1_Custom3m
Indicator

Nina_StepMA_1_Custom3m

This indicator calculates a stepped moving average based on high-low price ranges and relative volatility to generate stochastic crossovers for trend identification.

Nina_StepMA_1_Custom3s
Indicator

Nina_StepMA_1_Custom3s

This indicator utilizes a modified ATR-based step logic to calculate dynamic momentum levels, generating signal arrows upon bullish and bearish crossovers of its multi-layered stochastic bands.

Nina_StepMA_1_Custom3_001
Indicator

Nina_StepMA_1_Custom3_001

This indicator calculates dynamic trend boundaries using a weighted volatility range and generates buy/sell signals based on the stochastic crossover of multi-layered momentum steps.

Nina_StepMA_1_Custom3_003
Indicator

Nina_StepMA_1_Custom3_003

This indicator calculates a volatility-adjusted stepwise moving average using the Weighted Average True Range to identify trend shifts and signal momentum crossovers through multi-level dynamic bounds.

Nina_StepMA_1_v1
Indicator

Nina_StepMA_1_v1

This indicator calculates a dynamic step-based moving average using weighted price ranges to identify trend momentum and generates visual signals upon crossover events.

NINA_v1
Indicator

NINA_v1

iMA

This indicator utilizes a weighted volatility range calculation combined with momentum-based threshold boundaries and an EMA filter to identify trend reversals and high-probability entry points.

ning_heiken_ashi
Indicator

ning_heiken_ashi

iMA

This indicator calculates the instantaneous rate of change by plotting the difference between consecutive 3-period Exponential Moving Averages based on weighted price data.

ning_heiken_ashi_v1
Indicator

ning_heiken_ashi_v1

iMA

This indicator calculates the rate of change between consecutive smoothed exponential moving averages based on weighted price data to identify momentum shifts.

nma20
Indicator

nma20

This indicator calculates an adaptive moving average by weighting logarithmic price differences against the square root of consecutive temporal intervals to normalize volatility.

NMA3
Indicator

NMA3

This indicator calculates a dynamic moving average by determining the ratio between weighted log-price differences and absolute log-price variances over a 40-period window.

nma40
Indicator

nma40

This indicator calculates an adaptive Exponential Moving Average by deriving a dynamic smoothing ratio from the weighted logarithmic price differences of the preceding forty bars.

nmaMM
Indicator

nmaMM

This indicator calculates a multi-layered volatility profile by applying logarithmic price transformations, square root weighting, and exponential smoothing to capture non-linear momentum fluctuations.

NMAmr
Indicator

NMAmr

This indicator calculates dynamic momentum and trend smoothness by processing logarithmic price differentials through weighted square root scaling and multi-stage exponential moving averages.

NMAZZ
Indicator

NMAZZ

iCCIiWPR

This indicator identifies potential trend exhaustion by detecting simultaneous extreme oversold or overbought conditions across the CCI and Williams%R oscillators coinciding with ZigZag structural peaks.

Indicator

NMR20_mtf

NN
Indicator

NN

This indicator utilizes a multi-layer artificial neural network to process Normalized Order of Candles (NOC) data for sophisticated price action pattern recognition.

Indicator

NN_Delta