NRTR_color_line_v1
Download script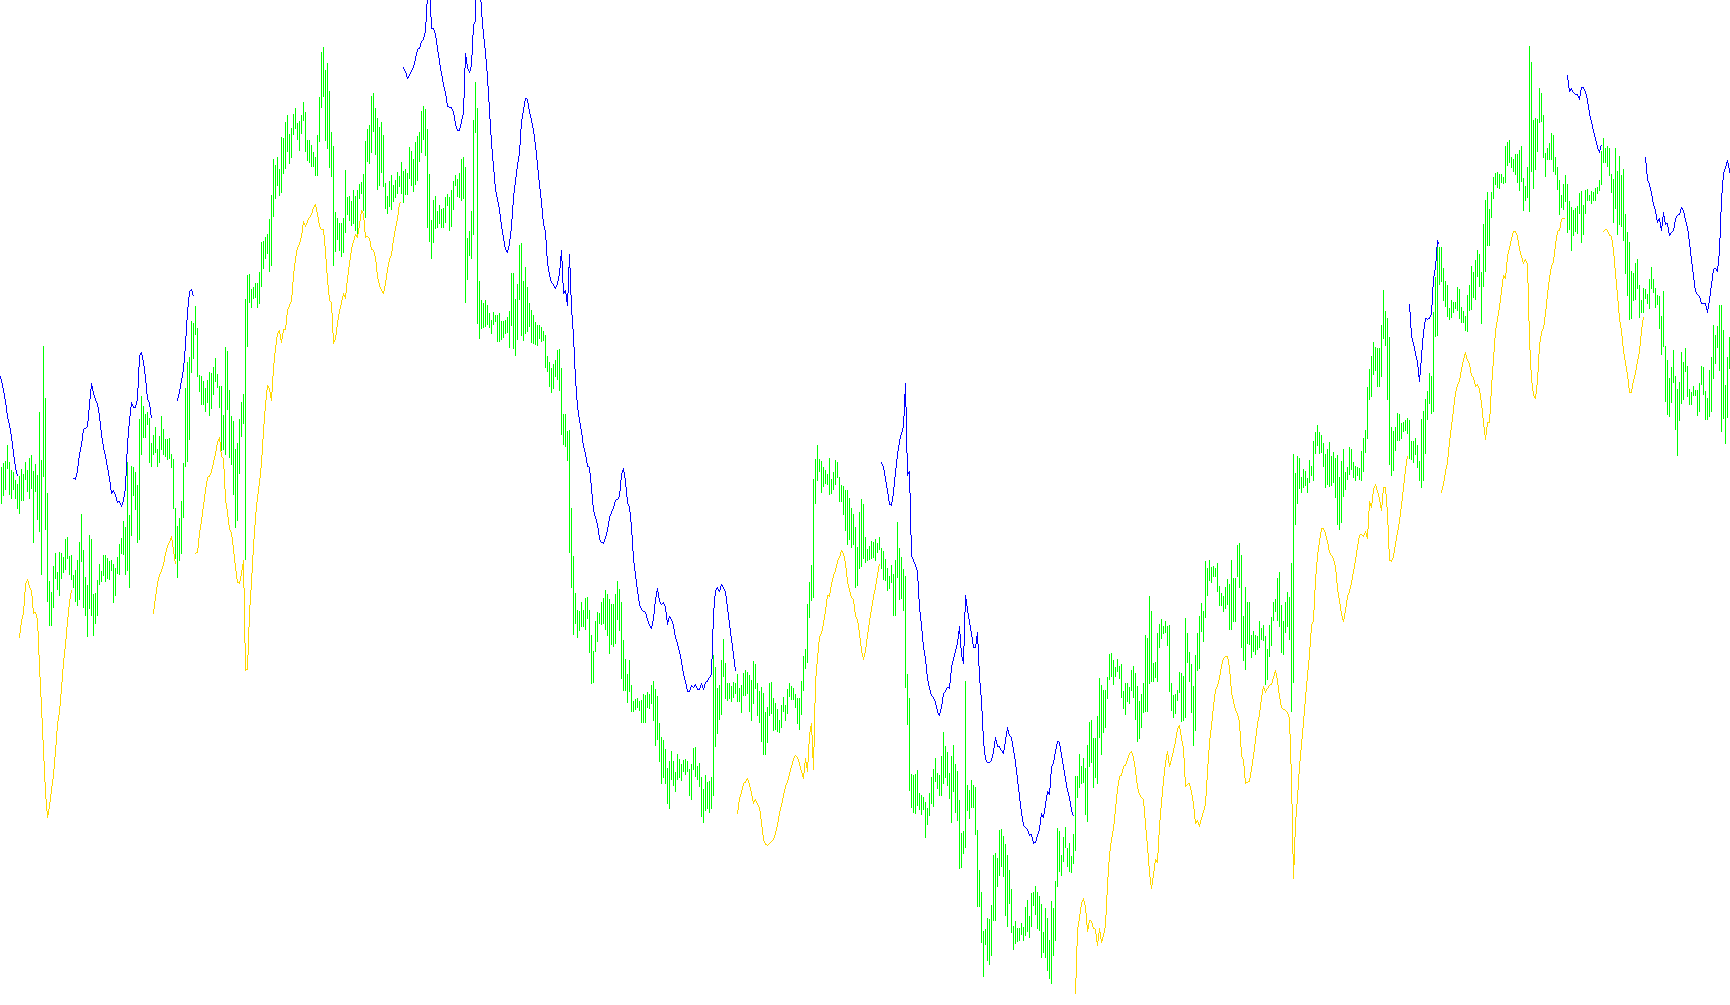
This tool is designed to provide visual clarity on a trading chart by identifying the prevailing market trend and defining dynamic boundaries for price movement. Instead of using static numbers, it adapts to the "heartbeat" of the market by calculating volatility in real-time.
How the Logic Works
1. Determining the Initial Direction The script begins by looking back at a specific historical point on the chart to determine the initial trend. By comparing two past price points, it establishes whether the market was moving upward or downward at that time. This serves as the foundation for all subsequent calculations.
2. Measuring Market Volatility (The "Buffer") To understand how much the price is likely to swing, the tool calculates a volatility metric. It measures the distance between highs and lows over a set period. By applying a weighted calculation, it ensures that more recent price movements have a greater influence on the current reading than older data. This result is then multiplied by a user-defined coefficient to create a "buffer zone" or channel width.
3. Tracking the Extremes As the script moves forward from its starting point toward the present moment, it constantly tracks the highest and lowest price points reached during the current trend.
- In an uptrend, it keeps a close eye on the lows.
- In a downtrend, it keeps a close eye on the highs.
4. Identifying Trend Reversals The core logic relies on "breakout" detection. The script watches to see if the price moves outside of the established buffer zone:
- Switching to Downtrend: If the price drops below the lower boundary of an uptrend, the script recognizes a potential reversal, flips the trend status, and resets its tracking point to the new high.
- Switching to Uptrend: If the price rises above the upper boundary of a downtrend, the script recognizes an upward shift, flips the status, and resets its tracking point to the new low.
5. Visual Output The script then draws two distinct lines on your chart based on these calculations:
- When the market is in an Uptrend, it plots a line representing the lower boundary of the price action.
- When the market is in a Downtrend, it plots a line representing the upper boundary of the price action.
By doing this, the tool provides a clear visual representation of "support" and "resistance" levels that expand and contract automatically as market volatility changes, helping traders stay aligned with the current direction of the market.
//+------------------------------------------------------------------+
//|                                              NRTR_color_line.mq4 |
//+------------------------------------------------------------------+

#property indicator_chart_window
#property indicator_buffers 2
#property indicator_color1 Blue
#property indicator_color2 Red
//---- input parameters
extern int ATRPeriod=14;
extern double Coefficient=4.0;
extern int StartBar=1000;

//---- buffers
double value1[];
double value2[];

bool TrendUP;
double Extremum,TR,ATR,Values[100],ChannelWidth;
int J,Head,Weight,Curr;

int init() {

//---- indicator line
   IndicatorBuffers(2);
   SetIndexStyle(0,DRAW_LINE);
   SetIndexArrow(0,167);
   SetIndexEmptyValue(0,0);
   SetIndexEmptyValue(1,0);
   SetIndexStyle(1,DRAW_LINE);
   SetIndexArrow(1,167);
   SetIndexBuffer(0,value1);
   SetIndexBuffer(1,value2);
   return(0);
}

int start() {
   int Shift;

   if (Close[StartBar-2] > Close[StartBar-1]) TrendUP = true;
   else TrendUP = false;
   Extremum = Close[ StartBar - 2 ];

   for (Shift = StartBar - 3; Shift>=0; Shift--) {
	   TR = High[Shift] - Low[Shift];
	   if ( MathAbs( High[ Shift ] - Close[ Shift + 1 ]) > TR ) TR = MathAbs( High[ Shift ] - Close[ Shift + 1 ]);
	   if ( MathAbs( Low[ Shift ] - Close[ Shift + 1 ]) > TR )  TR = MathAbs( Low[ Shift ] - Close[ Shift + 1 ]);
	   if (Shift == StartBar - 3)
		   for (J = 0; J<ATRPeriod; J++) {
			   Values[J] = TR;
		   }
	   Values[ Head ] = TR;
	   ATR = 0;
	   Weight = ATRPeriod;
	   Curr = Head;
	   for (J = 0; J<ATRPeriod; J++) {
		   ATR += Values[ Curr ] * Weight;
		   Weight -= 1;
		   Curr -= 1;
		   if ( Curr == -1 ) Curr = ATRPeriod - 1;
	   }
	   ATR = ( 2.0 * ATR ) / ( ATRPeriod * ( ATRPeriod + 1.0 ));
	   Head += 1;
	   if (Head == ATRPeriod) Head = 0;
	   ChannelWidth = Coefficient * ATR;
	   if (TrendUP && ( Low[ Shift ] < ( Extremum - ChannelWidth ) ) )  {
		   TrendUP = false;
		   Extremum = High[ Shift ];
	   }
	   if ( !TrendUP && ( High[ Shift ] > ( Extremum + ChannelWidth) ) ) {
		   TrendUP = true;
		   Extremum = Low[ Shift ];
	   }

	   if ( TrendUP && ( Low[Shift] > Extremum ) ) Extremum = Low[ Shift ];
	   if ( !TrendUP && ( High[ Shift ] < Extremum ) ) Extremum = High[ Shift ];

	   if (TrendUP) {
		   value1[Shift]=Extremum - ChannelWidth;
		   value2[Shift]=0;
	   } else {
		   value1[Shift]=0;
		   value2[Shift]=Extremum + ChannelWidth;
	   }
	}
}
Comments