NR7-NR4
Download script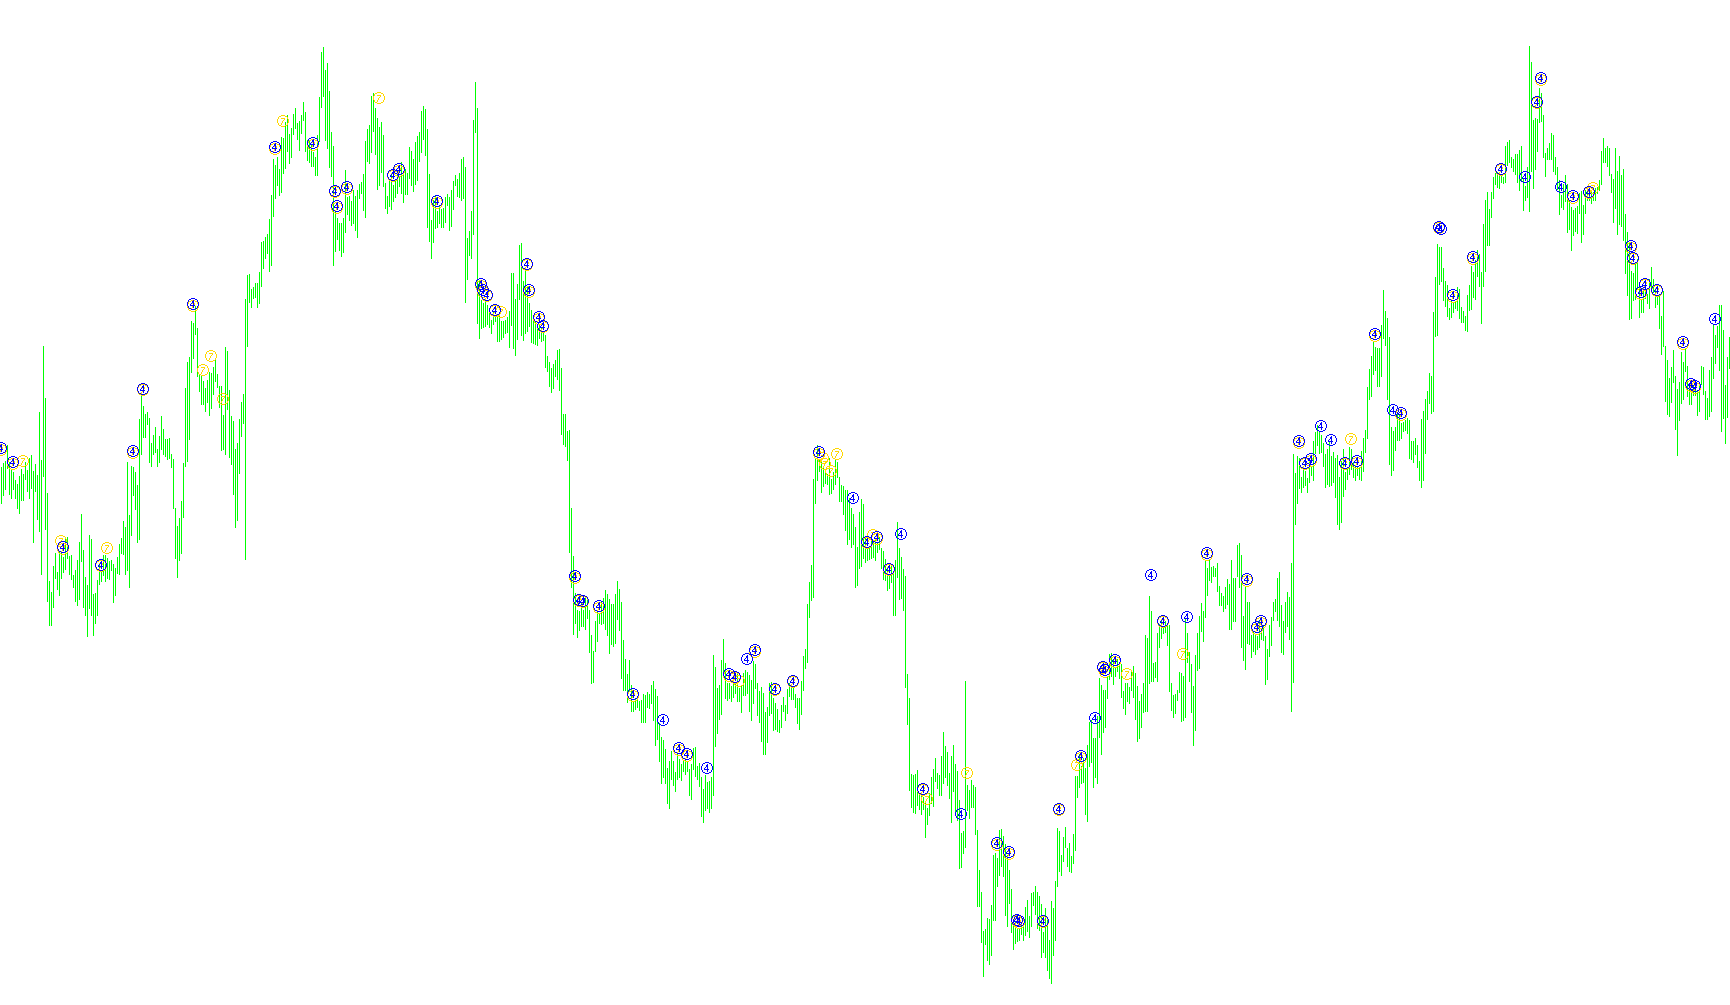
This technical indicator is designed to identify specific price action patterns by analyzing the relationship between a candle's size and the candles surrounding it. It functions by scanning historical price data to locate "outlier" candles that stand out from the recent local trend.
The logic operates through two distinct filtering processes:
1. The Large Range Identification (NR7 Logic)
The tool first looks for specific candles where the price range (the distance between the high and low) is significantly larger than the candles immediately preceding it. Specifically, it evaluates a candle against the previous seven candles. If the current candle is larger than all seven of those preceding it, the script identifies this as a point of interest. This typically highlights a sudden expansion in volatility or a "breakout" moment where price moves with increased strength.
2. The Small Range Identification (NR4 Logic)
In a separate calculation, the script performs a similar check but on a much shorter timeframe. It looks for candles that are larger than the four preceding them. By narrowing this window down to only four candles, the tool becomes more sensitive to immediate, very recent shifts in price movement compared to the broader "NR7" search.
Visual Representation
Once these conditions are met, the script provides visual cues on your chart:
- Primary Signals: When a candle qualifies as an NR7 (larger than its 7-candle neighbors), it marks the midpoint of that candle with a specific visual icon (Red).
- Secondary Signals: When a candle qualifies as an NR4 (larger than its 4-candle neighbors), it marks that location with a different visual icon (Blue).
Summary for Traders: The purpose of this logic is to help traders spot moments of momentum. By highlighting candles that are "unusually large" relative to their immediate history, the indicator helps you identify areas where price volatility is accelerating, potentially signaling the start of a new trend or a significant expansion in market activity.
//+------------------------------------------------------------------+
//|                                                        NR7-NR4.mq4 |
//|                                                 ??????? ???????? |
//|                                                  nikki21@mail.ru |
//+------------------------------------------------------------------+
#property copyright "??????? ????????"
#property link      "nikki21@mail.ru"

#property indicator_chart_window
#property indicator_buffers 2
#property indicator_color1 Red
#property indicator_color2 Blue
#property indicator_width1 3
#property indicator_width2 3
//+------------------------------------------------------------------+
extern int       NarrowRange7=7;
extern int       NarrowRange4=4;
//+------------------------------------------------------------------+
double ExtMapBuffer1[];
double ExtMapBuffer2[];
//+------------------------------------------------------------------+
int init(){
  SetIndexStyle(0,DRAW_ARROW);
  SetIndexArrow(0,135);
  SetIndexBuffer(0,ExtMapBuffer1);
  SetIndexStyle(0,DRAW_ARROW);
  SetIndexEmptyValue(0,0.0);
  SetIndexStyle(1,DRAW_ARROW);
  SetIndexArrow(1,132);
  SetIndexBuffer(1,ExtMapBuffer2);
  SetIndexStyle(1,DRAW_ARROW);
  SetIndexEmptyValue(1,0.0);
  return(0);
}
//+------------------------------------------------------------------+
int start(){
  int i,j,pos;
  for(i=Bars-IndicatorCounted()-1;i>=0;i--){
    if ((High[i]<High[i+1])&&(Low[i]>Low[i+1])){
       for(j=i+1;j<i+NarrowRange7;j++)
    pos=i;
         if ((High[j]-Low[j])<(High[i]-Low[i]))
          pos=j;
      if (pos==i)
        ExtMapBuffer1[i] = High[i] + (High[i] - Low[i])/2;
    }
  }
{
  int y,z,posx;
  for(y=Bars-IndicatorCounted()-1;y>=0;y--){
    if ((High[y]<High[y+1])&&(Low[y]>Low[y+1])){
      posx=y;
      for(z=y+1;z<y+NarrowRange4;z++)
        if ((High[z]-Low[z])<(High[y]-Low[y]))
          posx=z;
      if (posx==y)
        ExtMapBuffer2[y] = 4*Point+( High[y] + (High[y] - Low[y])/2);
    }
  }
  return(0);
}
}
//+------------------------------------------------------------------+
Comments