NRTR_color_line1_v1
Download script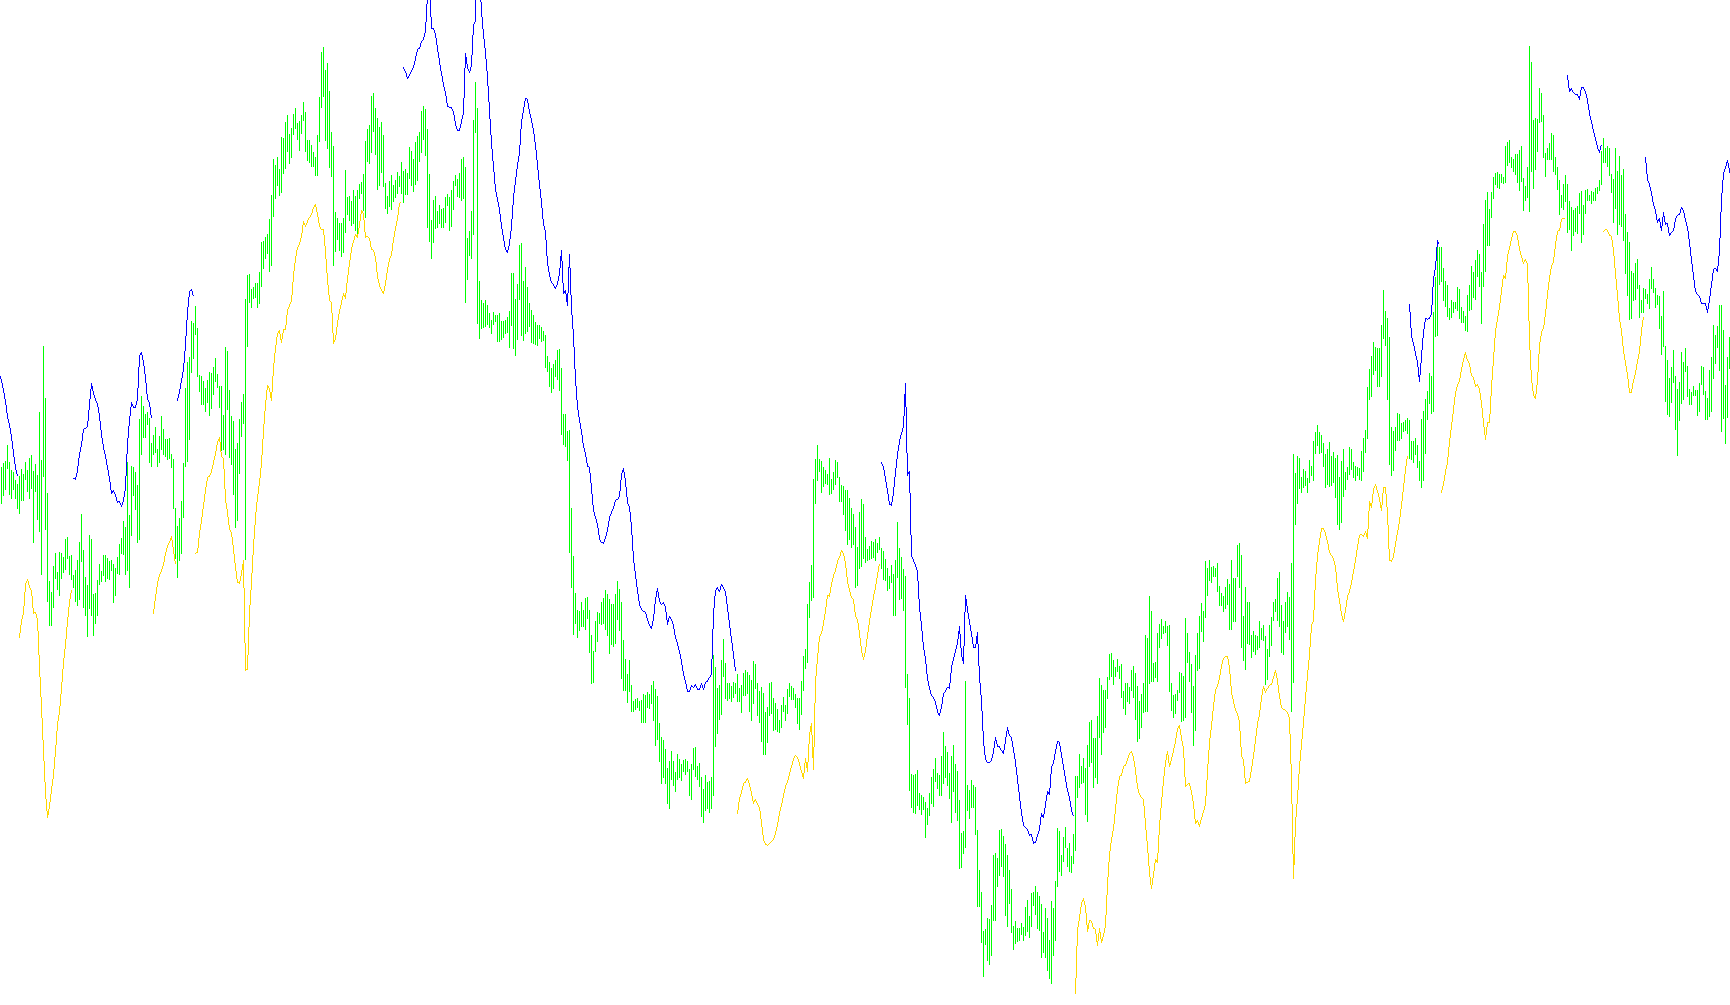
This tool is designed to visually identify and map market trends by creating a dynamic "channel" that reacts to price volatility. Rather than just following the price blindly, it uses a sophisticated calculation to determine when the market's momentum has shifted significantly enough to warrant a change in direction.
How the Logic Works
1. Trend Identification The script begins by looking back at a specific historical point to determine the initial direction of the market (Upward or Downward). It establishes a baseline from which it monitors all subsequent price movements.
2. Volatility Measurement To understand how much the market is "swinging," the tool calculates a volatility metric based on the range between highs and lows. It doesn't just look at the most recent candles; it applies a weighted calculation, giving more importance to recent price action while still considering a broader period of history. This helps the tool distinguish between normal "noise" in the market and actual significant movements.
3. The Dynamic Channel Based on the volatility measured above, the script creates a "Channel Width." Think of this as a safety buffer or a boundary line.
- When the trend is Upward, the tool tracks the lowest points reached by the price.
- When the trend is Downward, the tool tracks the highest points reached by the price.
4. Trend Reversal Logic The core intelligence of this script lies in how it decides to flip the trend. It looks for "breakouts" based on the volatility buffer:
- Switching to Downward: If the market is trending Up, but the price drops below the bottom boundary (the current high point minus the volatility buffer), the script recognizes a breakdown and flips the trend to Downward.
- Switching to Upward: If the market is trending Down, but the price pushes above the top boundary (the current low point plus the volatility buffer), the script recognizes a breakout and flips the trend to Upward.
5. Visual Representation Finally, the script draws these boundaries on your chart:
- When the trend is Upward, it displays a line representing the lower support boundary.
- When the trend is Downward, it displays a line representing the upper resistance boundary.
By using this logic, the tool attempts to filter out minor price fluctuations and only highlights the major structural shifts in the market, providing a clearer picture of the current "path" the price is taking.
//+------------------------------------------------------------------+
//|                                              NRTR_color_line.mq4 |
//+------------------------------------------------------------------+

#property indicator_chart_window
#property indicator_buffers 2
#property indicator_color1 Blue
#property indicator_color2 Red
//---- input parameters
extern int ATRPeriod=14;
extern double Coefficient=4.0;
extern int StartBar=1000;

//---- buffers
double value1[];
double value2[];

bool TrendUP;
double Extremum,TR,ATR,Values[100],ChannelWidth;
int J,Head,Weight,Curr;

int init() {

//---- indicator line
   IndicatorBuffers(2);
   SetIndexStyle(0,DRAW_LINE);
   SetIndexArrow(0,167);
   SetIndexEmptyValue(0,0);
   SetIndexEmptyValue(1,0);
   SetIndexStyle(1,DRAW_LINE);
   SetIndexArrow(1,167);
   SetIndexBuffer(0,value1);
   SetIndexBuffer(1,value2);
   return(0);
}

int start() {
   int Shift;

   if (Close[StartBar-2] > Close[StartBar-1]) TrendUP = true;
   else TrendUP = false;
   Extremum = Close[ StartBar - 2 ];

   for (Shift = StartBar - 3; Shift>=0; Shift--) {
	   TR = High[Shift] - Low[Shift];
	   if ( MathAbs( High[ Shift ] - Close[ Shift + 1 ]) > TR ) TR = MathAbs( High[ Shift ] - Close[ Shift + 1 ]);
	   if ( MathAbs( Low[ Shift ] - Close[ Shift + 1 ]) > TR )  TR = MathAbs( Low[ Shift ] - Close[ Shift + 1 ]);
	   if (Shift == StartBar - 3)
		   for (J = 0; J<ATRPeriod; J++) {
			   Values[J] = TR;
		   }
	   Values[ Head ] = TR;
	   ATR = 0;
	   Weight = ATRPeriod;
	   Curr = Head;
	   for (J = 0; J<ATRPeriod; J++) {
		   ATR += Values[ Curr ] * Weight;
		   Weight -= 1;
		   Curr -= 1;
		   if ( Curr == -1 ) Curr = ATRPeriod - 1;
	   }
	   ATR = ( 2.0 * ATR ) / ( ATRPeriod * ( ATRPeriod + 1.0 ));
	   Head += 1;
	   if (Head == ATRPeriod) Head = 0;
	   ChannelWidth = Coefficient * ATR;
	   if (TrendUP && ( Low[ Shift ] < ( Extremum - ChannelWidth ) ) )  {
		   TrendUP = false;
		   Extremum = High[ Shift ];
	   }
	   if ( !TrendUP && ( High[ Shift ] > ( Extremum + ChannelWidth) ) ) {
		   TrendUP = true;
		   Extremum = Low[ Shift ];
	   }

	   if ( TrendUP && ( Low[Shift] > Extremum ) ) Extremum = Low[ Shift ];
	   if ( !TrendUP && ( High[ Shift ] < Extremum ) ) Extremum = High[ Shift ];

	   if (TrendUP) {
		   value1[Shift]=Extremum - ChannelWidth;
		   value2[Shift]=0;
	   } else {
		   value1[Shift]=0;
		   value2[Shift]=Extremum + ChannelWidth;
	   }
	}
}
Comments