Murrey_Math_MT4_Period_VG_v3
Indicator

Murrey_Math_MT4_Period_VG_v3

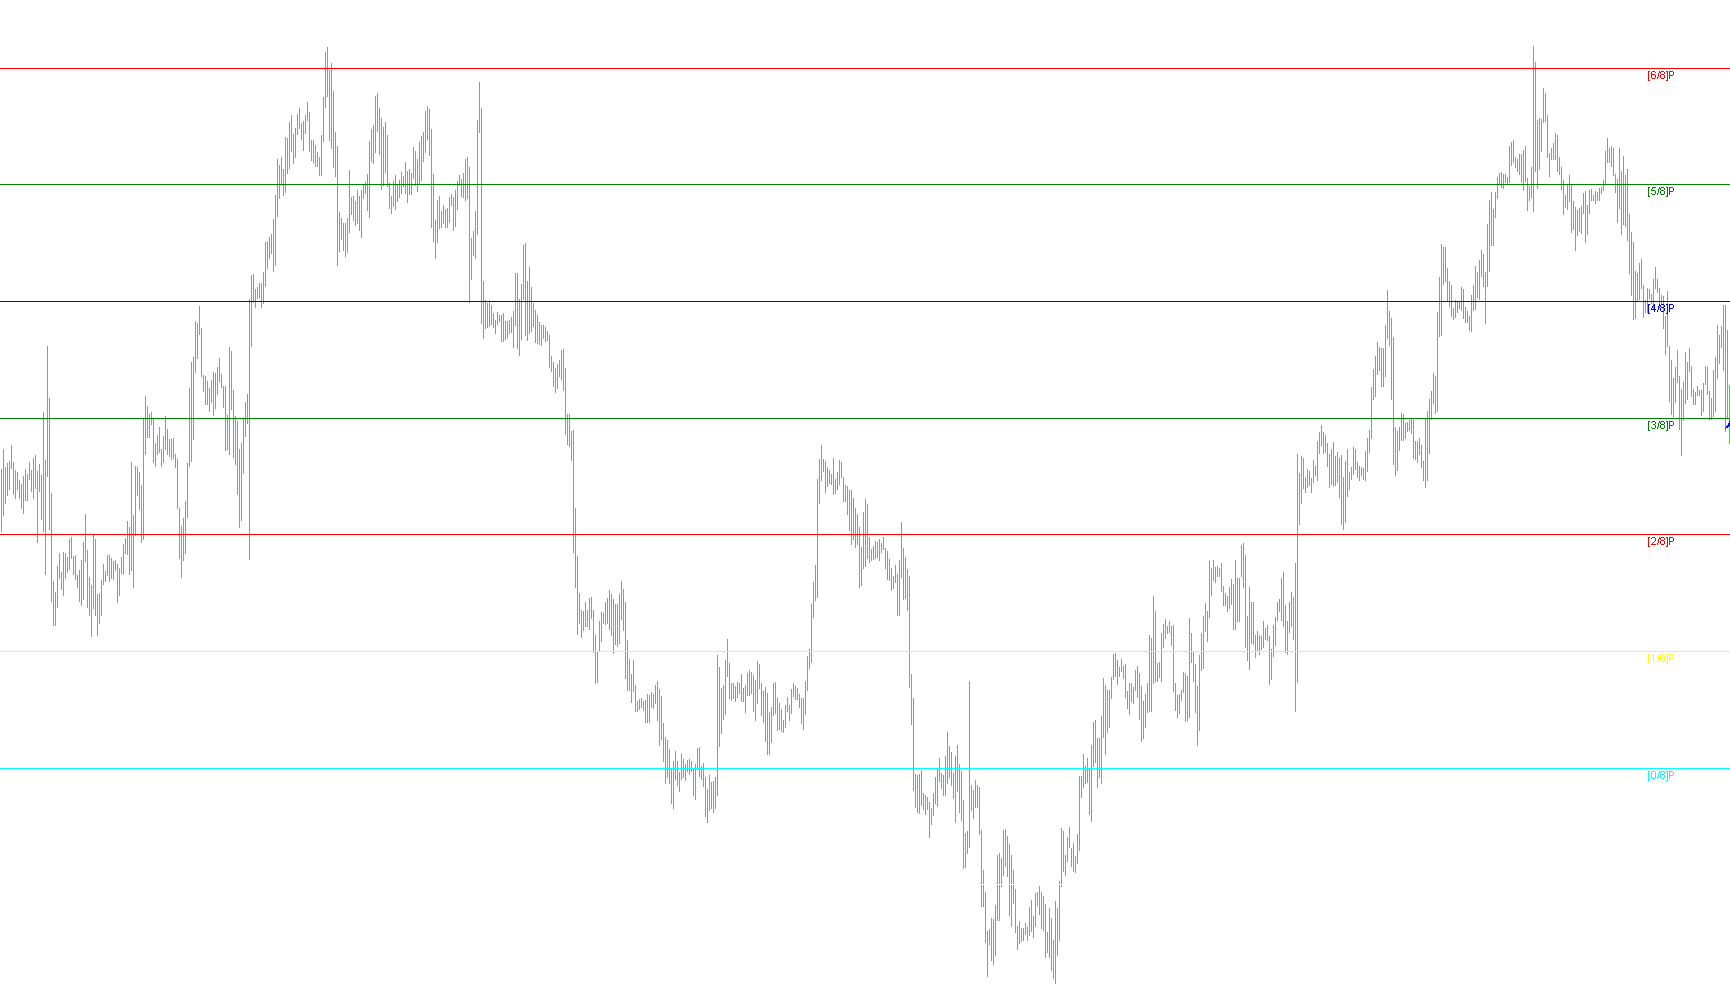
This indicator decomposes price action into an eight-point scale by calculating fractal octaves to identify high-probability supply, demand, and equilibrium zones.

Murrey_Math_MT4_VG
Indicator

Murrey_Math_MT4_VG

This indicator utilizes fractal-based octave analysis to segment price action into distinct zones of support and resistance, identifying high-probability reversal points and trading range boundaries.

Indicator

Murrey_Math_MT4_VG1

Indicator

Murrey_Math_MT4_VG1b

Murrey_Math_MT4_VG1b1
Indicator

Murrey_Math_MT4_VG1b1

This indicator utilizes fractal geometry and multi-level price partitioning to project 13 distinct support and resistance zones based on market volatility.

Indicator

Murrey_Math_MT4_VG1b_v1

Indicator

Murrey_Math_MT4_VG1_v1

Murrey_Math_MT4_VGb
Indicator

Murrey_Math_MT4_VGb

This indicator dynamically calculates and plots thirteen fractal-based price levels to identify precise zones of market exhaustion, major pivots, and equilibrium boundaries.

Murrey_Math_MT4_VGb_v1
Indicator

Murrey_Math_MT4_VGb_v1

This indicator utilizes fractal geometry and logarithmic scaling to segment market price action into a 13-level octave system, identifying precise pivot points for high-probability trend reversals and structural support zones.

Murrey_Math_MT4_VG_v1
Indicator

Murrey_Math_MT4_VG_v1

This indicator dynamically maps market volatility into an 8-level geometric octave system to identify high-probability pivot zones, premium trade boundaries, and extreme liquidity exhaustion points.

MUV%
Indicator

MUV%

This indicator calculates normalized momentum values by processing the rate of change and relative position of Moving Universal Volume metrics over specific lookback periods.

MUV
Indicator

MUV

iMAOnArray

This indicator calculates a weighted mean of price extremes adjusted for candle directionality to generate a smoothed moving average of volatility intensity.

MUV_Diff
Indicator

MUV_Diff

This indicator calculates the discrete rate of change between consecutive values of the MUV custom momentum components to identify velocity shifts.

MVBT3
Indicator

MVBT3

This indicator calculates a triple-smoothed momentum derivative of trading volume using an iterative weighted moving average filter to identify underlying liquidity flow dynamics.

MVV_LinearRegression
Indicator

MVV_LinearRegression

iMA

This indicator identifies a historical price anchor based on an SMMA-filtered extreme and projects a linear regression path to forecast current price levels.

My-SSL_channel_chart_alert
Indicator

My-SSL_channel_chart_alert

iMA

This indicator dynamically flips the position of SMA-based upper and lower channels based on whether price action breaches the high or low extremes of the preceding period.

Indicator

myforexVQ

iMA
Indicator

MyParaBolic

Indicator

MySQL

My_30minTrend
Indicator

My_30minTrend

iMA

This indicator synchronizes 30-minute timeframe price momentum by cross-referencing Rate of Change Moving Average trends with Moving Average Difference shifts to quantify directional strength.

my_Daily_High_Low
Indicator

my_Daily_High_Low

This indicator extracts and projects the high and low price levels from the preceding daily candle onto the current chart as horizontal reference markers.

Indicator

my_RSI

iRSI
my_squeeze
Indicator

my_squeeze

iCCIiMACDiRSIiStochastic

This indicator identifies market compression by comparing standard deviation against ATR to signal high-probability trend expansions validated by selectable momentum oscillators.

my_squeeze_Light
Indicator

my_squeeze_Light

iCCIiMACDiRSIiStochastic

This indicator identifies high-probability trend expansions by detecting price volatility compression through a Bollinger Squeeze model and validating directional momentum using selectable oscillators like MACD, RSI, or CCI.

my_squeeze_Light_001
Indicator

my_squeeze_Light_001

iCCIiMACDiRSIiStochastic

This indicator identifies high-probability breakout points by detecting periods where volatility contracts below the Keltner Channel and then confirms trend expansion via selectable oscillators like MACD, RSI, or Stochastic.

my_squeeze_Light_v2
Indicator

my_squeeze_Light_v2

iCCIiMACDiRSIiStochastic

This indicator identifies high-probability breakout points by detecting price compression through a modified Bollinger Band squeeze calculation combined with selectable momentum oscillators.

N4 TF HAS Bar
Indicator

N4 TF HAS Bar

This indicator visually aggregates smoothed Heiken Ashi momentum signals across four concurrent timeframes to identify aligned trend directions.

N4 TF HAS Bar2
Indicator

N4 TF HAS Bar2

This indicator visualizes bullish and bearish sentiment across four distinct timeframes simultaneously by monitoring the relationship between smoothed Heiken Ashi open and close values.

N4_TF_HAS_Bar
Indicator

N4_TF_HAS_Bar

This indicator visualizes synchronized trend direction across four distinct timeframes by comparing smoothed Heiken Ashi open and close values.

N4_TF_HAS_Bar2
Indicator

N4_TF_HAS_Bar2

This indicator projects smoothed Heiken Ashi price action across four distinct timeframes onto a single chart to visualize hierarchical trend alignment.

NavelEMA
Indicator

NavelEMA

This indicator calculates a custom price point derived from a weighted harmonic of open, high, low, and close prices, then applies an exponential moving average smoothing filter.

NavelSMA
Indicator

NavelSMA

This indicator calculates a simple moving average based on a custom weighted price formula that prioritizes closing and opening prices over high and low extremes.

NavelSMA_v1
Indicator

NavelSMA_v1

This indicator computes a smoothed moving average based on a custom price point derived from the weighted sum of high, low, open, close, and mid-price components.

NB-channel
Indicator

NB-channel

This indicator identifies significant price extremes using fractal logic to project linear trend channels and dynamic support/resistance boundaries.

nd1
Indicator

nd1

iWPR

The algorithm identifies trend shifts by calculating an average price range and cross-referencing it against specific price gaps and the Williams Percent Range to trigger high-volatility boundary signals.

nd1Sig
Indicator

nd1Sig

This indicator identifies trend reversals by detecting structural breaks in price momentum using external multi-layered signal processing.

nd1Sig_v1
Indicator

nd1Sig_v1

This indicator identifies structural trend reversals by detecting specific state transitions within the BrainTrend1Stop external logic to generate directional arrow signals.

nd1Stop
Indicator

nd1Stop

This indicator identifies structural trend shifts by calculating a dynamic offset based on average price range to plot reactive trailing support and resistance levels.

nd1StopLine
Indicator

nd1StopLine

This indicator identifies directional shifts by dynamically calculating a volatility-based buffer zone and tracking price breaches to signal trend exhaustion or continuation.

nd1StopLine_v1
Indicator

nd1StopLine_v1

This indicator identifies trend direction by calculating a price buffer based on the average high-low range and flips polarity when price breaches the dynamically adjusted volatility threshold.

nd1Stop_v1
Indicator

nd1Stop_v1

This indicator identifies directional shifts by tracking price deviations against a dynamic volatility-based threshold to signal trend reversals.

nd1_v1
Indicator

nd1_v1

iWPR

This indicator dynamically identifies trend shifts by calculating the relationship between price volatility ranges and Williams Percent Range extremes to filter market noise.

nd2
Indicator

nd2

iWPR

This indicator identifies trend exhaustion by calculating dynamic price range thresholds and applying a smoothed Williams Percent Range filter to trigger histogram signals.

nd2Sig
Indicator

nd2Sig

Identifies directional shifts by detecting state changes in the BrainTrend2Stop custom indicator's dual-buffer signals.

nd2Sig_v1
Indicator

nd2Sig_v1

The logic identifies structural trend reversals by detecting state transitions between discrete multi-level momentum thresholds.

nd2StopLine
Indicator

nd2StopLine

The indicator calculates a weighted average range to project a trailing stop-loss line that flips polarity based on price breaches and momentum shifts.

nd2StopLine_v1
Indicator

nd2StopLine_v1

This indicator calculates a weighted average range to project dynamic support and resistance lines that flip polarity based on price breakouts.

nd2_v1
Indicator

nd2_v1

iWPR

This indicator identifies trend shifts by analyzing price volatility ranges and the Williams Percent Range to pinpoint overextended market movements.

NDA
Indicator

NDA

This indicator translates real-time price velocity into multi-layered auditory alerts and randomized geometric visual patterns to map market kinetic energy.

NDA_e
Indicator

NDA_e

This indicator monitors real-time price volatility and tick velocity to generate randomized aesthetic frequency patterns and auditory feedback.