NRTR
Download script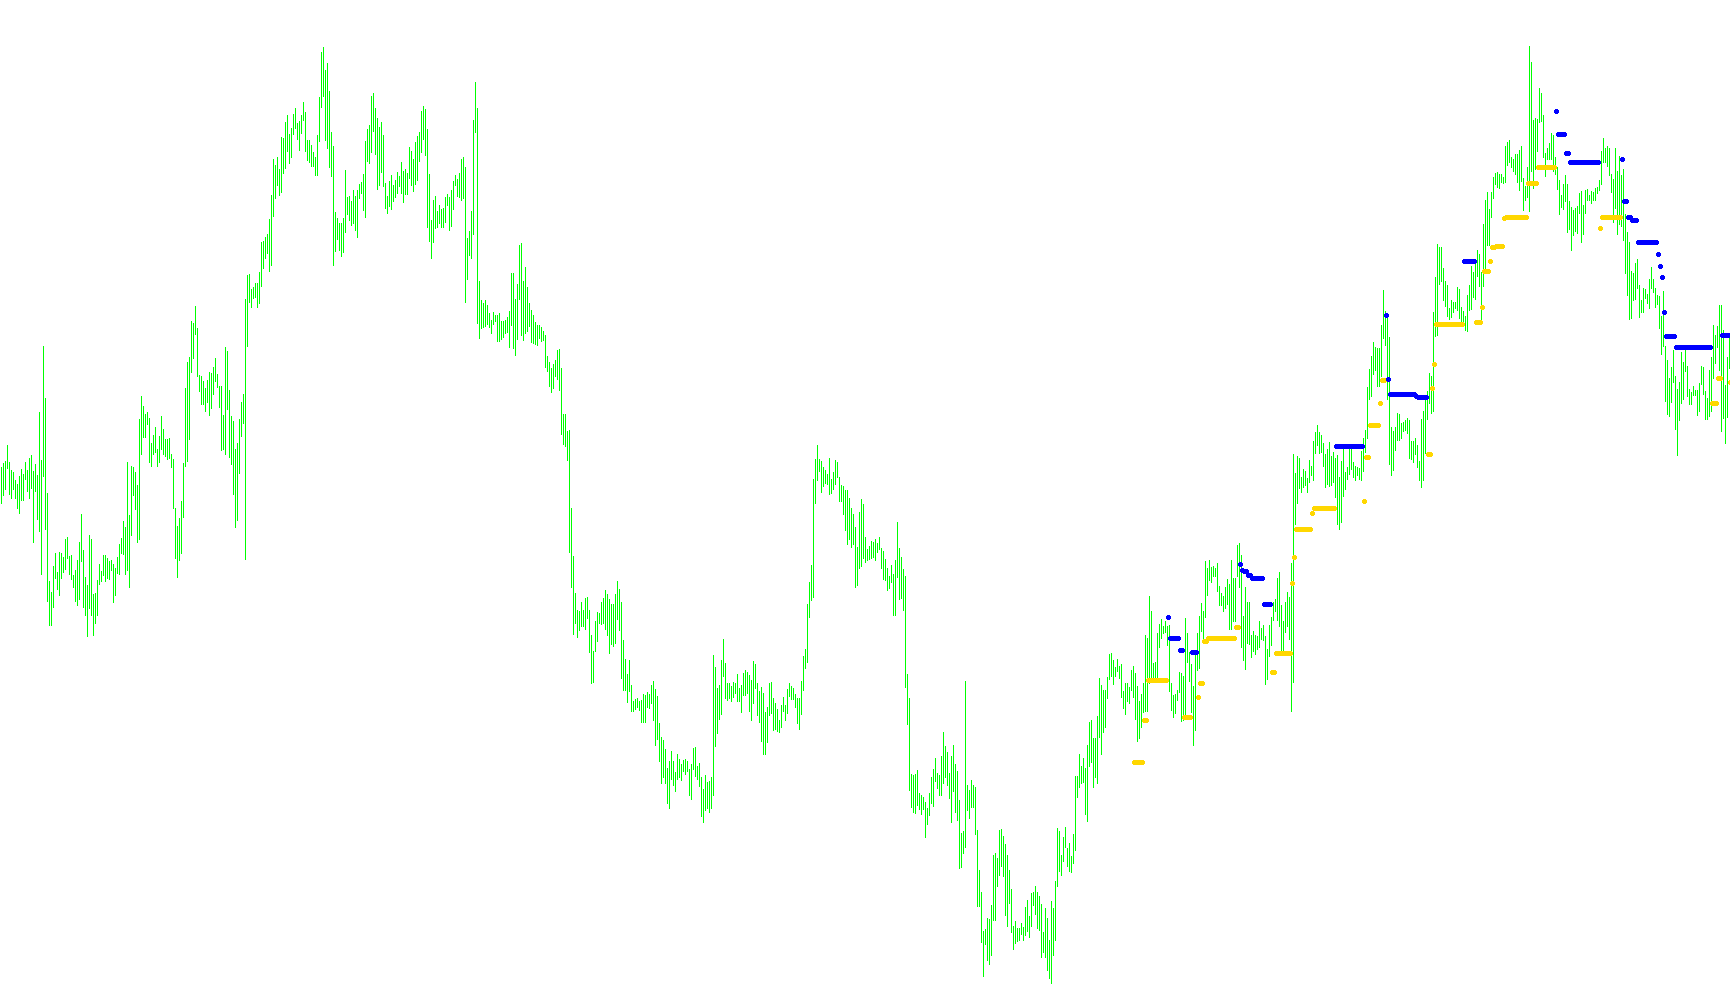
This tool is designed to identify and visualize market trends by analyzing price action movements over a specific historical period. Rather than just looking at the current price, it calculates the "personality" of the market's movement to determine if the momentum is currently favoring an upward or downward direction.
How the Logic Works
1. Calculating Market Volatility The script begins by measuring the average range of price candles over a user-defined period. It looks at how far the price swings between the high and low points. This calculation establishes a "buffer" or a sensitivity level (referred to as the movement constant). Essentially, it determines how much the price needs to move in a single step to be considered a significant change rather than just random noise.
2. Dynamic Trend Detection The tool moves backward through the historical data to establish a trend history. It works by identifying "breakout" points:
- Upward Momentum: If the price consistently makes higher highs, the script recognizes an upward trend. However, it won't label this as a trend just because the price is high; it waits for the price to stay above a specific calculated threshold based on the volatility constant.
- Downward Momentum: Conversely, if the price is making lower lows and drops below its corresponding calculated threshold, the script switches its recognition to a downward trend.
3. Trend Reversal Identification One of the core features of this logic is its ability to detect "trend flips." If the market is in an upward trend but suddenly experiences a price drop that pierces through its calculated buffer, the script immediately registers a reversal and switches its focus to the downward trend. It continues to track the new direction until a significant enough move occurs in the opposite direction to trigger another switch.
4. Visual Representation The final output of this logic is displayed on your chart as two distinct visual markers (Aqua and Violet).
- When the logic identifies an upward trend, it highlights the movement with one color.
- When the logic identifies a downward trend, it switches to the second color.
By filtering out minor price fluctuations and focusing on confirmed breaks in momentum, this tool helps traders see the broader "flow" of the market more clearly.
//+------------------------------------------------------------------+
//|                                                         NRTR.mq4 |
//|                                                                  |
//|                                        Ramdass - Conversion only |
//+------------------------------------------------------------------+

#property indicator_chart_window
#property indicator_buffers 2
#property indicator_color1 Aqua
#property indicator_color2 Violet
//---- input parameters
extern int AveragePeriod=10;
extern int CountBars=300;
//---- buffers
double value1[];
double value2[];
//+------------------------------------------------------------------+
//| Custom indicator initialization function                         |
//+------------------------------------------------------------------+
int init()
  {

//---- indicator line
   IndicatorBuffers(2);
   SetIndexStyle(0,DRAW_ARROW);
   SetIndexArrow(0,159);
   SetIndexStyle(1,DRAW_ARROW);
   SetIndexArrow(1,159);
   SetIndexBuffer(0,value1);
   SetIndexBuffer(1,value2);
//----
//----
   return(0);
  }
//+------------------------------------------------------------------+
//| NRTR                                                             |
//+------------------------------------------------------------------+
int start()
  {
   if (CountBars>Bars) CountBars=Bars;
   SetIndexDrawBegin(0,Bars-CountBars+1);
   SetIndexDrawBegin(1,Bars-CountBars+1);
   int i,counted_bars=IndicatorCounted();
   double value;
   double trend=0,dK,AvgRange,price;
//----
   if(Bars<=AveragePeriod) return(0);
//---- initial zero
   if(counted_bars<1)
   {
      for(i=1;i<=AveragePeriod;i++) value1[Bars-i]=0.0;
      for(i=1;i<=AveragePeriod;i++) value2[Bars-i]=0.0;
   }


AvgRange=0;
for (i=1 ; i<=AveragePeriod ; i++) AvgRange+= MathAbs(High[i]-Low[i]);
if (Symbol() == "USDJPY" || Symbol() == "GBPJPY" || Symbol() == "EURJPY")
{dK = (AvgRange/AveragePeriod)/100;}
else {dK = AvgRange/AveragePeriod;}

if (Close[CountBars-1] > Open[CountBars-1])
   {
   value1[CountBars - 1] = Close[CountBars - 1] * (1 - dK);
   trend = 1; value2[CountBars - 1] = 0.0;
   }
if (Close[CountBars-1] < Open[CountBars-1])  {
   value2[CountBars - 1] = Close[CountBars - 1] * (1 + dK);
   trend = -1; value1[CountBars - 1] = 0.0;
   }
//----
   i=CountBars-1;
   while(i>=0)
     {
value1[i]=0; value2[i]=0;
if (trend >= 0)
       {
       if (Close[i] > price) price = Close[i];
       value = price * (1 - dK);
       if (Close[i] < value)
          {
          price = Close[i];
          value = price * (1 + dK);
          trend = -1;
          }
       }
    else
       {
    if (trend <= 0)
       {
       if (Close[i] < price) price = Close[i];
       value = price * (1 + dK);
       if (Close[i] > value)
          {
          price = Close[i];
          value = price * (1 - dK);
          trend = 1;
          }
       }
       }
if (trend == 1)  {value1[i]=value; value2[i]=0.0;}
if (trend == -1)  {value2[i]=value; value1[i]=0.0;}

      i--;
     }
   return(0);
  }
//+------------------------------------------------------------------+
Comments