NRTR_Pilot_5F2alert
Download script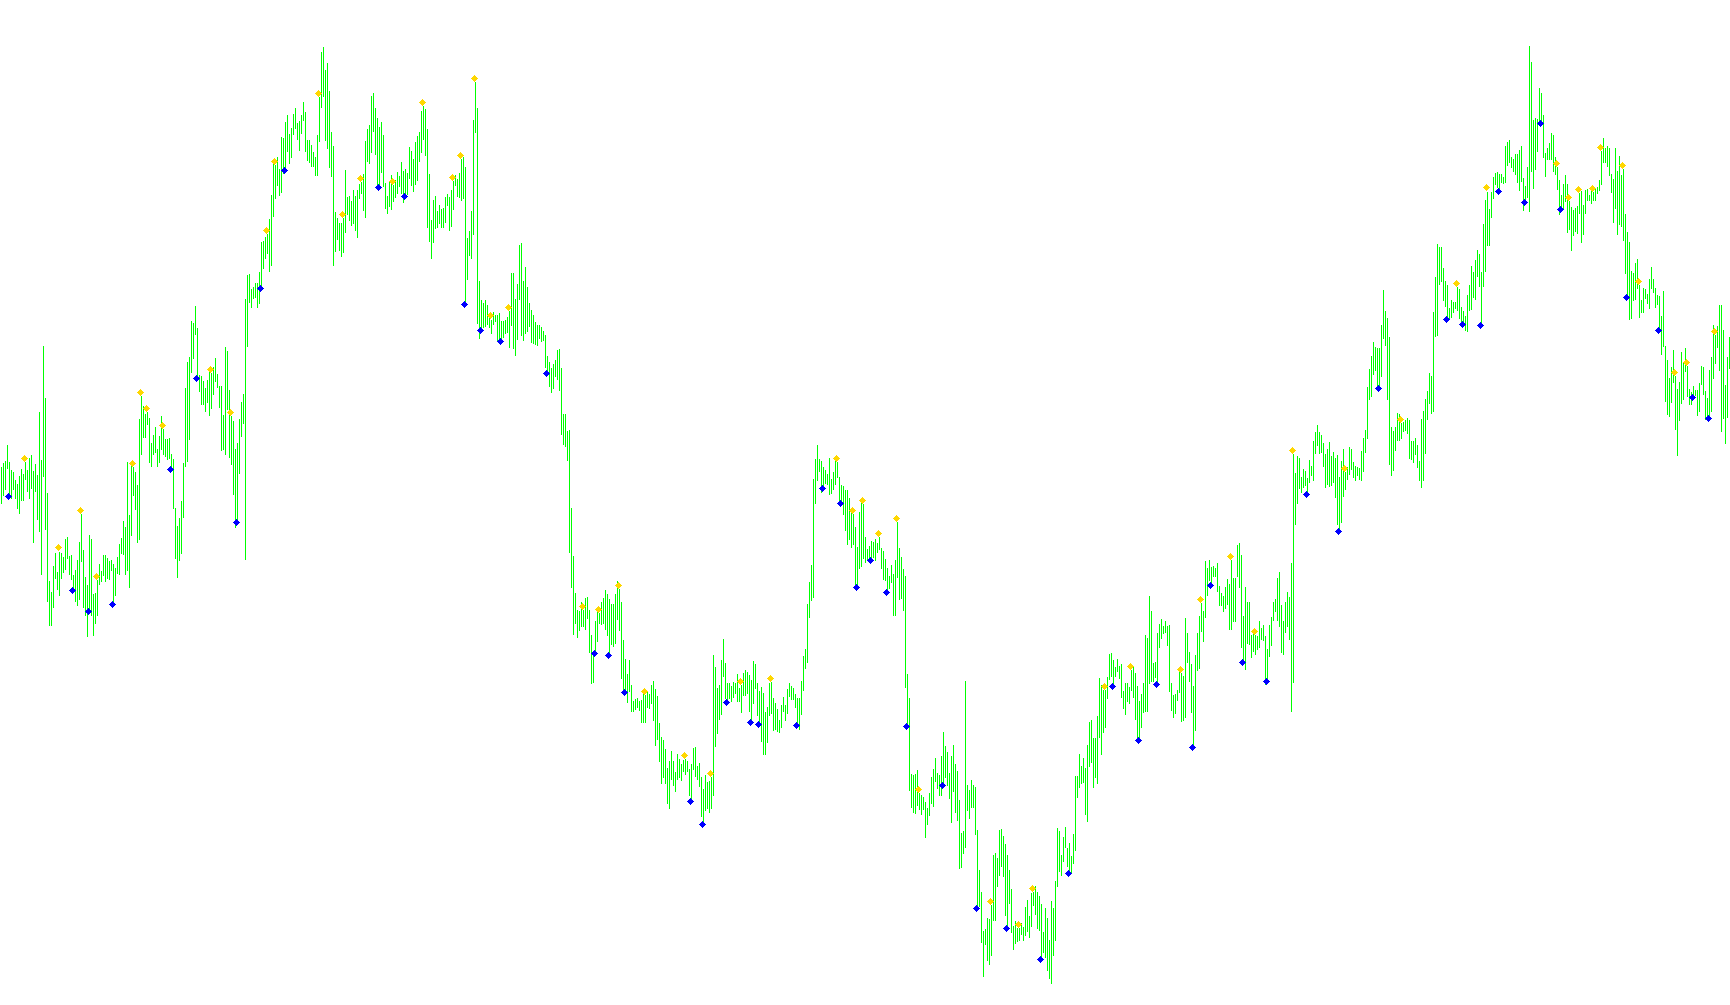
This tool is designed as a visual signaling system for trading platforms, specifically crafted to identify potential trend reversals or price momentum shifts by analyzing historical price movements. Rather than looking at simple price action alone, the script utilizes a specialized calculation method to scan for specific patterns of "strength" and "weakness" in the market.
How the Logic Works
The core logic of this script functions like a filter that scans past price data to detect significant shifts in momentum. It achieves this through several key steps:
1. Momentum Analysis (The AC Component) The script looks at a series of consecutive values (the "AC" values) to determine the current state of the market's energy. It evaluates these values over a five-point window, comparing each new point against the ones preceding it. This allows the tool to see if the market is accelerating, decelerating, or changing direction.
2. Identifying Bullish Signals (Upward Momentum) The script looks for three specific types of conditions that suggest price might be heading upward:
- Steady Growth: When momentum values are consistently rising and positive.
- Recovery from Negative: When momentum was negative but has begun a structured climb toward the positive side.
- Bottoming Out: A more complex pattern where momentum drops significantly before showing a distinct "V-shaped" recovery in its trajectory.
When these conditions are met, the tool places a visual marker (an arrow) above the high price of that specific candle.
3. Identifying Bearish Signals (Downward Momentum) Conversely, the script scans for three types of conditions that suggest price might be heading downward:
- Steady Decline: When momentum values are consistently falling and negative.
- Drop from Positive: When momentum was positive but has started a structured descent toward the negative side.
- Peaking Out: A pattern where momentum rises to a peak and then begins a sharp, sequential decline.
When these conditions are met, the tool places a visual marker (an arrow) below the low price of that specific candle.
User Experience
For the trader, this means the chart is automatically populated with visual cues. You don't have to manually calculate the momentum of every candle; the script does the heavy lifting by scanning the data and highlighting only those moments where the mathematical "geometry" of the market suggests a potential turning point. The primary goal is to provide a clear, visual map of where momentum is shifting from bullish to bearish, or vice versa.
/*-----------------------------+
|			       |
| Shared by www.Aptrafx.com    |
|			       |
+------------------------------*/

//+------------------------------------------------------------------+
//|                                                   wlxBWACsig.mq4 |
//|                        Copyright © 2005 B.Williams, coding wellx |
//|                                        http://www.metaquotes.net |
//+------------------------------------------------------------------+
#property copyright "Copyright © 2005 B.Williams, coding wellx"
#property link      "http://www.metaquotes.net"

#property indicator_chart_window
#property indicator_buffers 2
#property indicator_color1 MediumBlue
#property indicator_color2 HotPink
//---- input parameters
extern int       updown=8;
//---- buffers
double BWACup[];
double BWACdown[];

int pos=0;
double AC1,AC2,AC3,AC4,AC5;


//+------------------------------------------------------------------+
//| Custom indicator initialization function                         |
//+------------------------------------------------------------------+
int init()
  {
//---- indicators
   SetIndexStyle(0,DRAW_ARROW);
   SetIndexArrow(0,119);
   SetIndexBuffer(0,BWACup);
   SetIndexEmptyValue(0,0.0);

   SetIndexStyle(1,DRAW_ARROW);
   SetIndexArrow(1,119);
   SetIndexBuffer(1,BWACdown);
   SetIndexEmptyValue(1,0.0);
//----
   return(0);
  }
//+------------------------------------------------------------------+
//| Custor indicator deinitialization function                       |
//+------------------------------------------------------------------+
int deinit()
  {
//---- TODO: add your code here

//----
   return(0);
  }
//+------------------------------------------------------------------+
//| Custom indicator iteration function                              |
//+------------------------------------------------------------------+
int start()
  {
   int  cbars=IndicatorCounted();
   if  (cbars<0) return(-1);
   if  (cbars>0) cbars--;

//---- TODO: add your code here
   if (cbars > (Bars-40)) pos=(Bars-40);
   else pos=cbars;
//   pos=10;
   while (pos > 0)
   {
     BWACup[pos]=NULL;
     BWACdown[pos]=NULL;
     AC1=iAC(NULL,0,pos);
     AC2=iAC(NULL,0,pos+1);
     AC3=iAC(NULL,0,pos+2);
     AC4=iAC(NULL,0,pos+3);
     AC5=iAC(NULL,0,pos+4);

     if (((AC4>0 && AC3>0 && AC2>0 && AC1>0) && (AC4>AC3 && AC2>AC3 && AC1>AC2)) ||
         ((AC4<0 && AC3<0 && AC2<0 && AC1>0) && (AC4>AC3 && AC2>AC3 && AC1>AC2)) ||
         ((AC5<0 && AC4<0 && AC3<0 && AC2<0 && AC1<0) &&
          (AC5>AC4 && AC4<AC3 && AC3<AC2 && AC2<AC1)))
             BWACup[pos]=(High[pos]+updown*Point) ;

     if (((AC4<0 && AC3<0 && AC2<0 && AC1<0) && (AC4<AC3 && AC2<AC3 && AC1<AC2)) ||
         ((AC4>0 && AC3>0 && AC2>0 && AC1<0) && (AC4<AC3 && AC2<AC3 && AC1<AC2)) ||
         ((AC5>0 && AC4>0 && AC3>0 && AC2>0 && AC1>0) &&
          (AC5<AC4 && AC4>AC3 && AC3>AC2 && AC2>AC1)))
             BWACdown[pos]=(Low[pos]-updown*Point) ;

     pos--;
   }
   return(0);
  }
//+------------------------------------------------------------------+
Comments