NRTR_dots1
Download script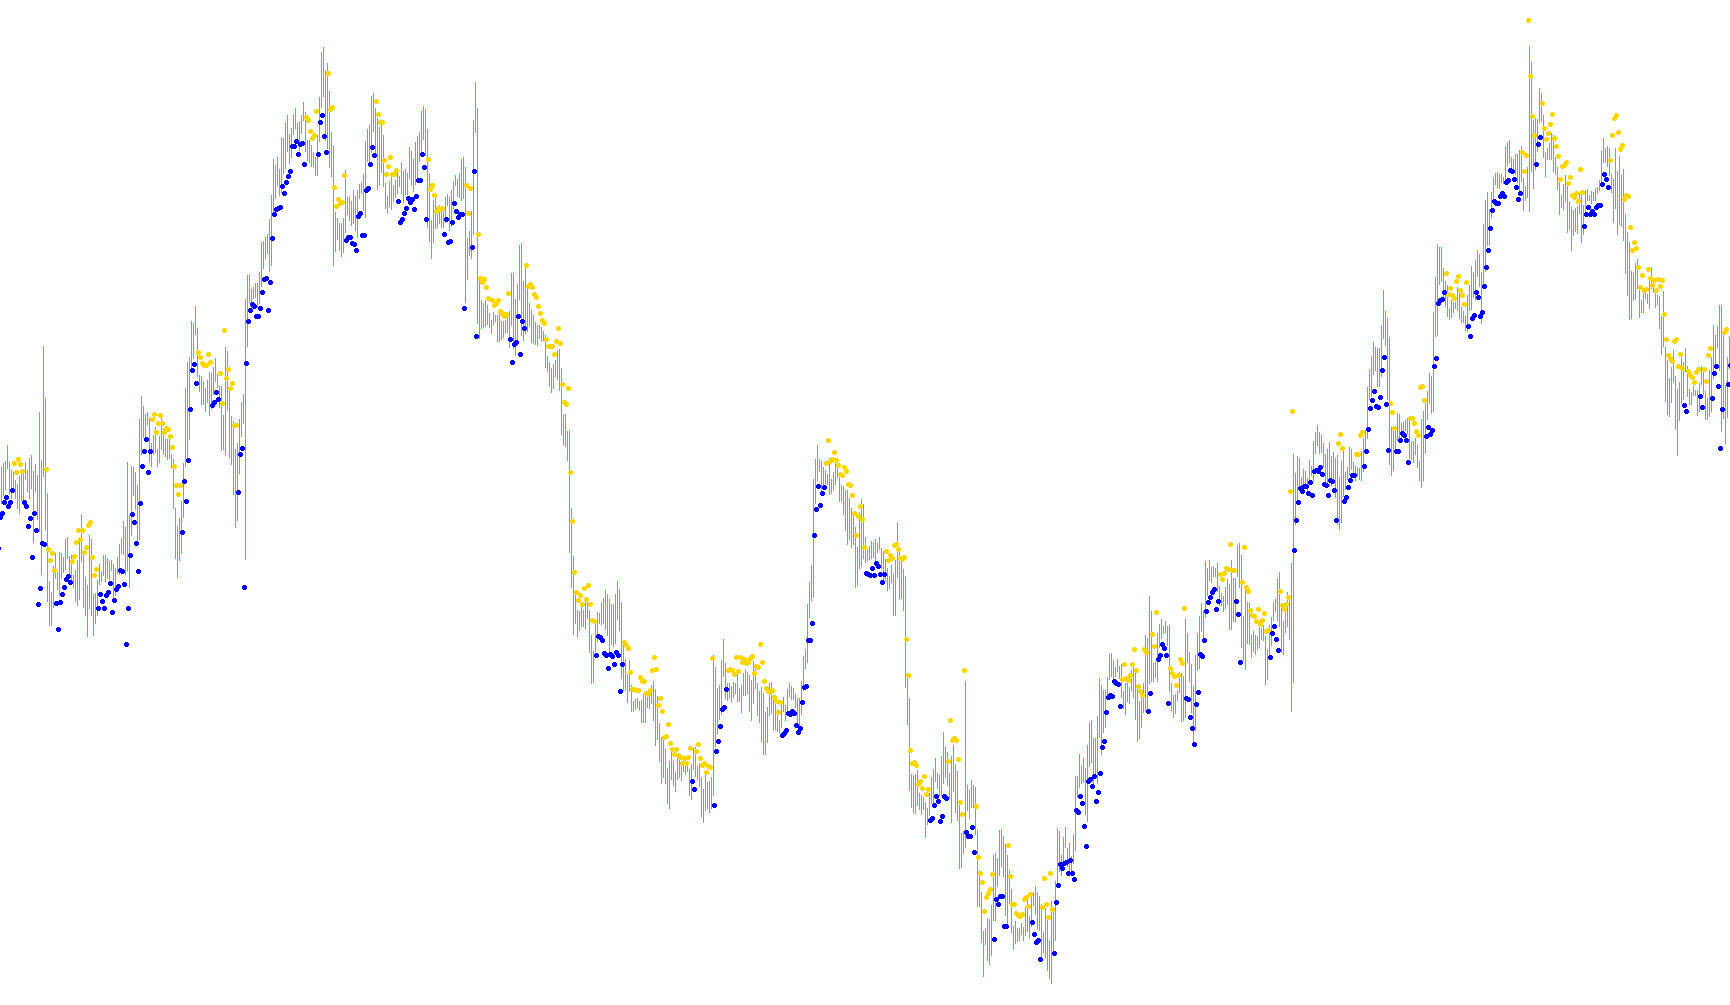
This tool is designed to assist traders by visually identifying the prevailing direction of market trends and highlighting potential reversal points directly on the price chart. Instead of providing a constant line, it uses a system of dots to signal when the market's momentum shifts from bullish (upward) to bearish (downward), or vice versa.
Core Logic and Mechanics
The script operates by analyzing two primary factors: price movement and market volatility. Here is a breakdown of how it processes this information:
1. Volatility Measurement The tool first calculates the "Average Range" of the market over a specific period (determined by the user). It looks at the distance between high and low prices, factoring in the current spread. By averaging these distances, the script establishes a dynamic measurement of how much the price typically fluctuates. This ensures that the signals adapt to different market conditions—becoming "tighter" during quiet periods and "wider" during volatile sessions.
2. Trend Tracking The logic follows the path of the closing prices. It continuously monitors whether the current price is breaking new highs or lows relative to its recent history.
- Upward Trend: When the price moves higher, the tool tracks this momentum.
- Downward Trend: When the price moves lower, the tool captures this shift.
3. Reversal Detection (The "Breakout" Logic) The core of the script lies in its ability to detect when a trend has exhausted itself. It establishes a "buffer zone" based on the volatility measurement calculated earlier.
- If the market is currently in an upward trend, the script waits for the price to drop significantly enough to breach its calculated safety margin. Once that threshold is crossed, the tool recognizes a potential shift and switches its logic to a downward trend.
- Conversely, if the market is in a downward trend, the script monitors for a price surge that exceeds its safety margin. Once breached, it signals a transition back to an upward trend.
Visual Representation
To make this information easy to read at a glance, the script uses two different colors (Aqua and Magenta) to represent these trends:
- Trend 1 (Bullish): One color of dots appears when the logic identifies an upward move.
- Trend -1 (Bearish): The other color appears when the logic detects a downward shift.
By observing the change in colors, a user can quickly identify where the market structure has shifted, helping to filter out minor price fluctuations and focus on significant directional changes.
//+------------------------------------------------------------------+
//|                                                    NRTR Dots.mq4 |
//|                                     Copyright © 2006, Nick Bilak |
//+------------------------------------------------------------------+
#property copyright "Copyright © 2006, Nick Bilak"

//---- indicator settings
#property  indicator_chart_window
#property  indicator_buffers 2
#property  indicator_color1  Aqua
#property  indicator_color2  Magenta
//---- indicator parameters
extern int AveragePeriod=21;
//---- indicator buffers
double e1[];
double e2[];

int i,bar,trend=1;
double value,price,dK,AvgRange;

//+------------------------------------------------------------------+
//| Custom indicator initialization function                         |
//+------------------------------------------------------------------+
int init()
  {
//---- drawing settings
   SetIndexStyle(0,DRAW_ARROW);
   SetIndexArrow(0,159);
   SetIndexStyle(1,DRAW_ARROW);
   SetIndexArrow(1,159);
   SetIndexEmptyValue(0,0);
   SetIndexEmptyValue(1,0);
   SetIndexBuffer(0,e1);
   SetIndexBuffer(1,e2);
//---- name for DataWindow and indicator subwindow label
   IndicatorShortName("NRTR_Dots("+AveragePeriod+")");
//---- initialization done
   return(0);

  }

int start()  {

   int counted_bars=IndicatorCounted();
   if(counted_bars<0) return(-1);
   if(counted_bars>0) counted_bars--;
   int limit=Bars-20-counted_bars;
   double spread=Ask-Bid;
   double ap;
   ap=AveragePeriod;
   for(bar=limit; bar>=0; bar--) {
       e1[bar]=0; e2[bar]=0;
       AvgRange=0;
       for (i=bar; i<bar+AveragePeriod; i++) {
          AvgRange=AvgRange+MathAbs(spread+High[bar]-Low[bar]);
       }
       dK = AvgRange/ap;
       if (Close[bar]>10) dK=dK/100.0;
       if (trend == 1) {
          if (Close[bar] > price) price = Close[bar];
          value = price - dK;
          if (Close[bar] < value) {
             price = Close[bar];
             value = price + dK;
             trend = -1;
          }
       }
       if (trend == -1) {
          if (Close[bar] < price) price = Close[bar];
          value = price + dK;
          if (Close[bar] > value) {
             price = Close[bar];
             value = price - dK;
             trend = 1;
          }
       }
      if (trend == -1) e1[bar]=value; //SetIndexValue(bar, value);
      if (trend == 1) e2[bar]=value; //SetIndexValue2(bar, value);
   }
}
Comments