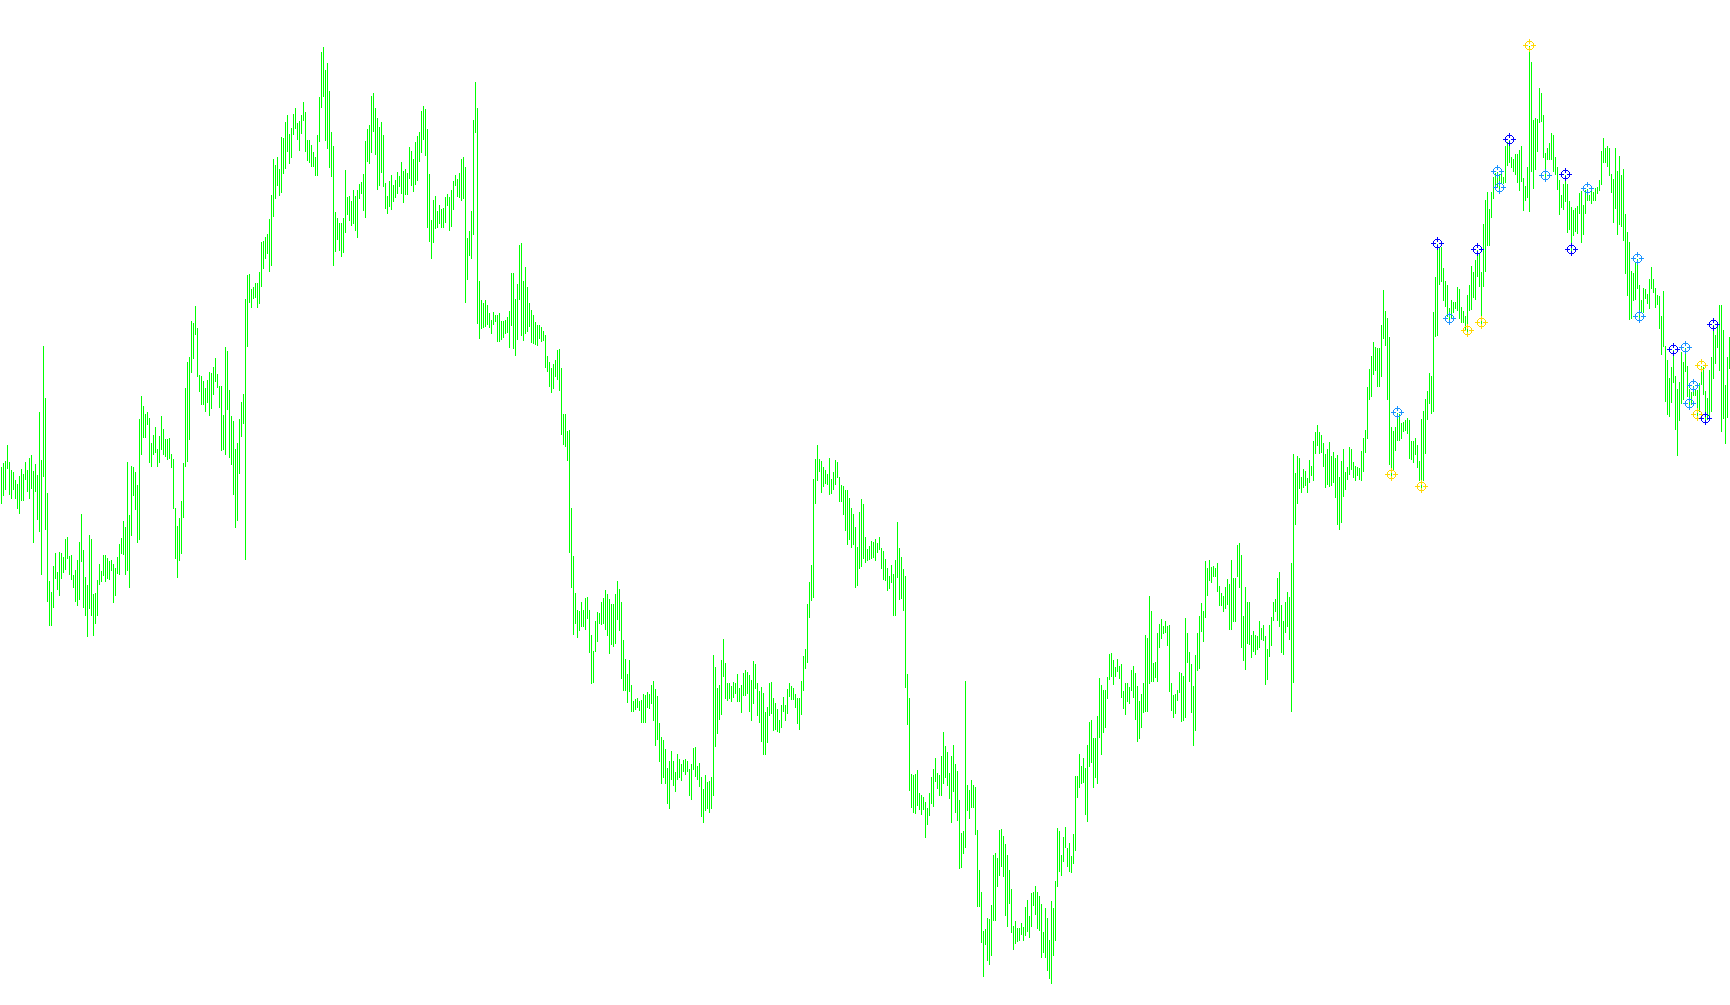
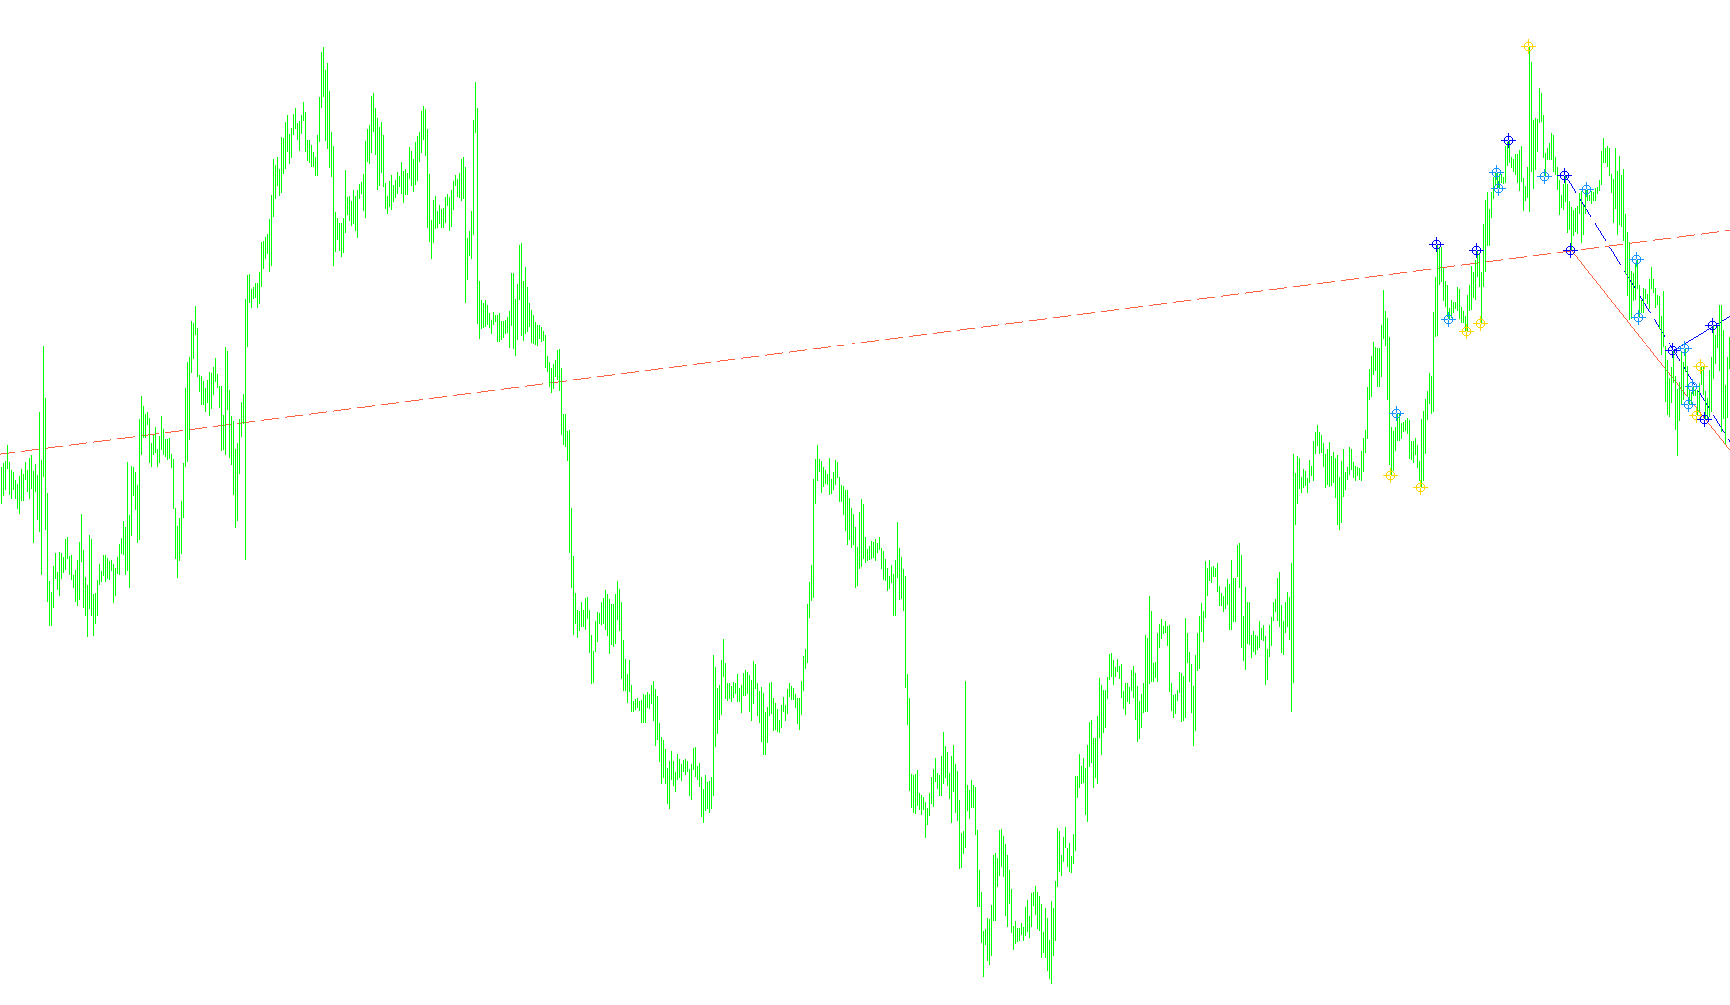
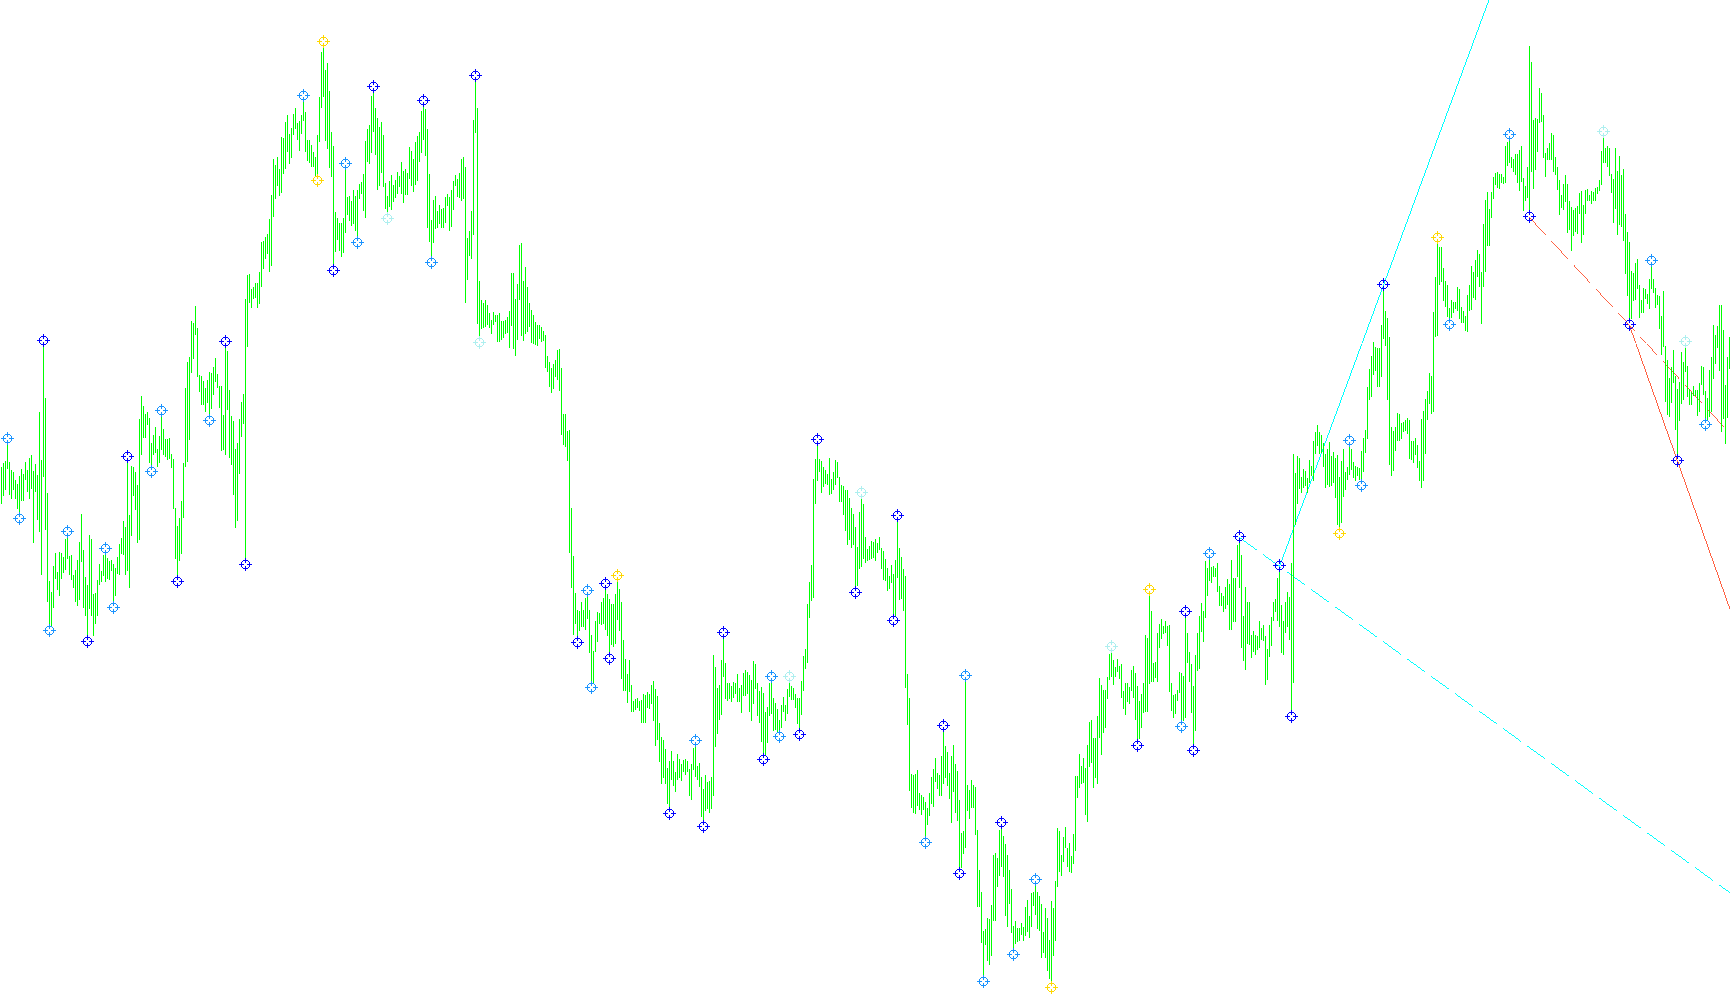
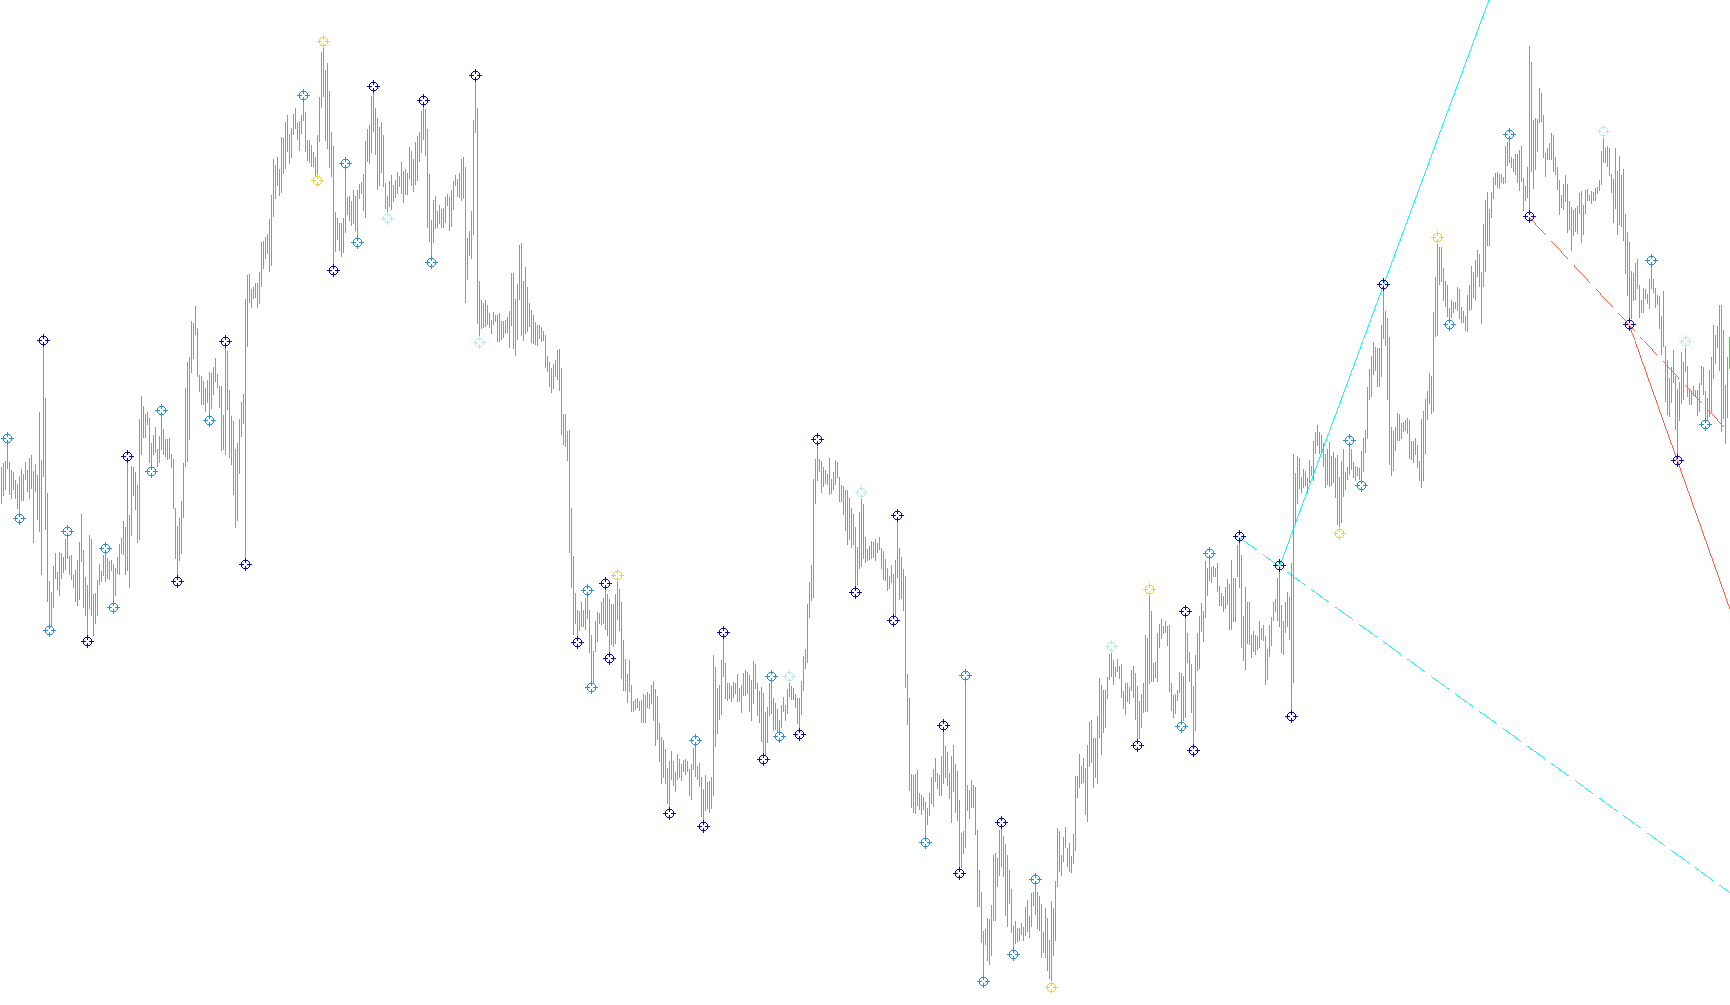
okwhHeikenAshi
Indicator

okwhHeikenAshi

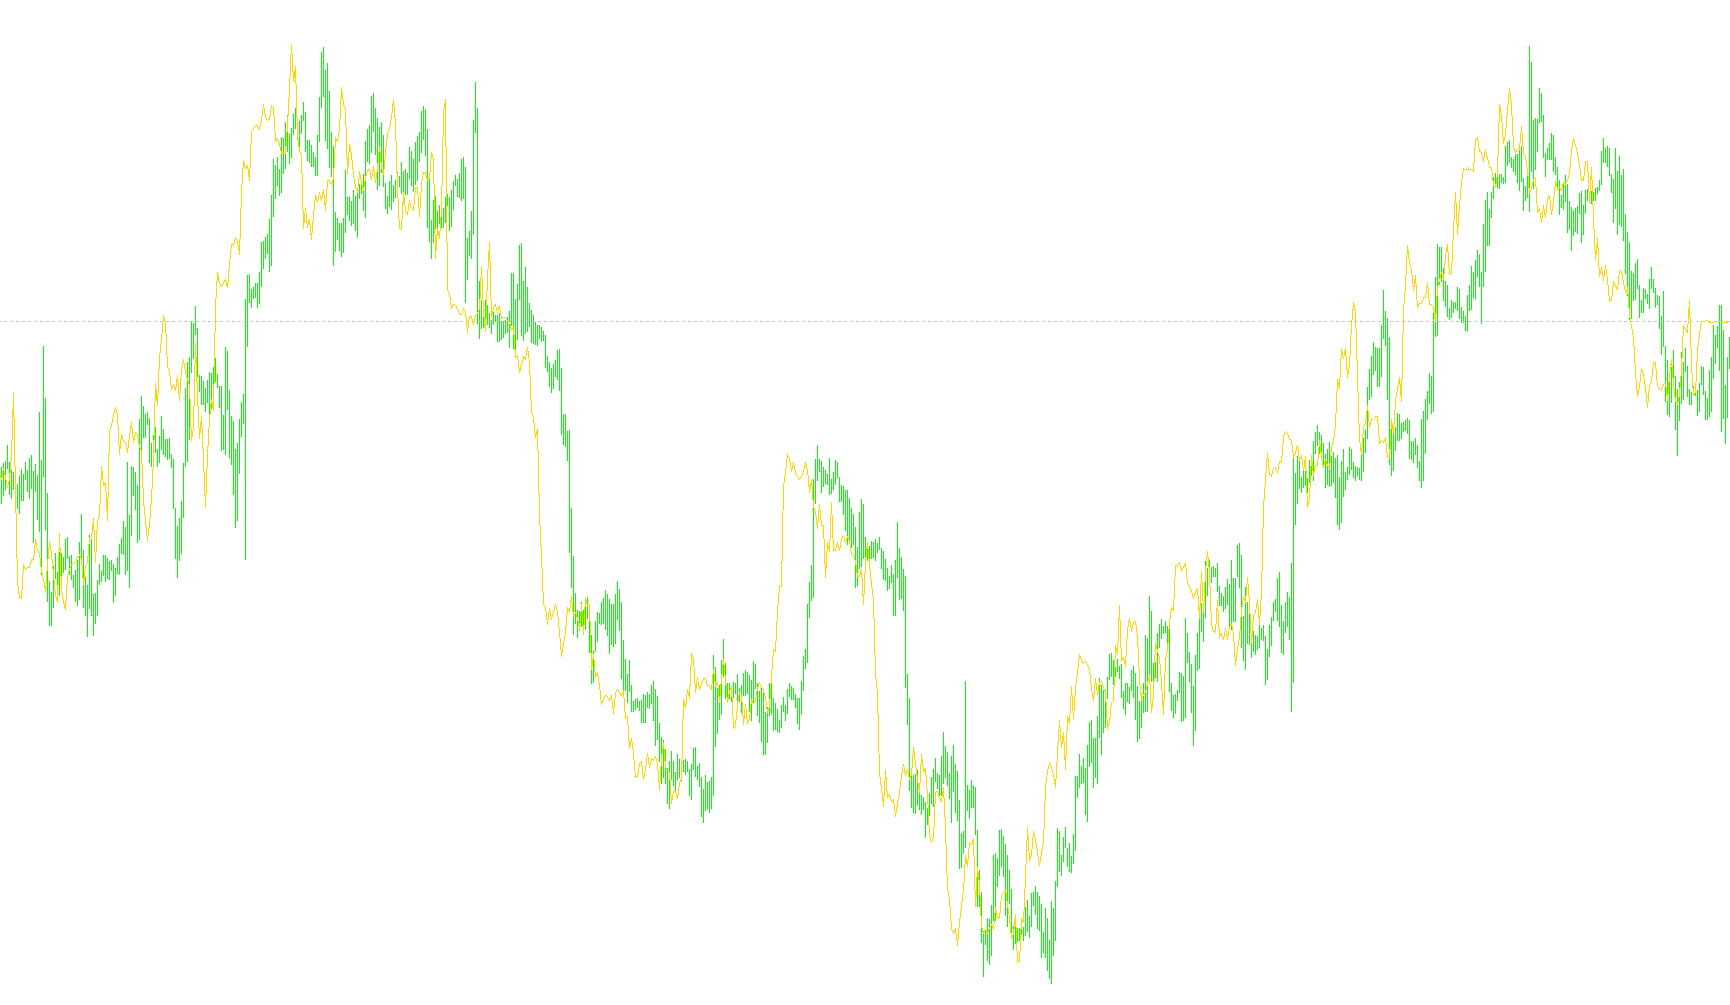
This indicator calculates and renders smoothed Heiken Ashi candlesticks for a specific secondary currency pair on the current chart.

okwhticks
Indicator

okwhticks

This indicator captures and buffers real-time market bid price fluctuations to visualize continuous liquidity flow across a specified historical depth.

okwhwilson
Indicator

okwhwilson

iMAiRSI

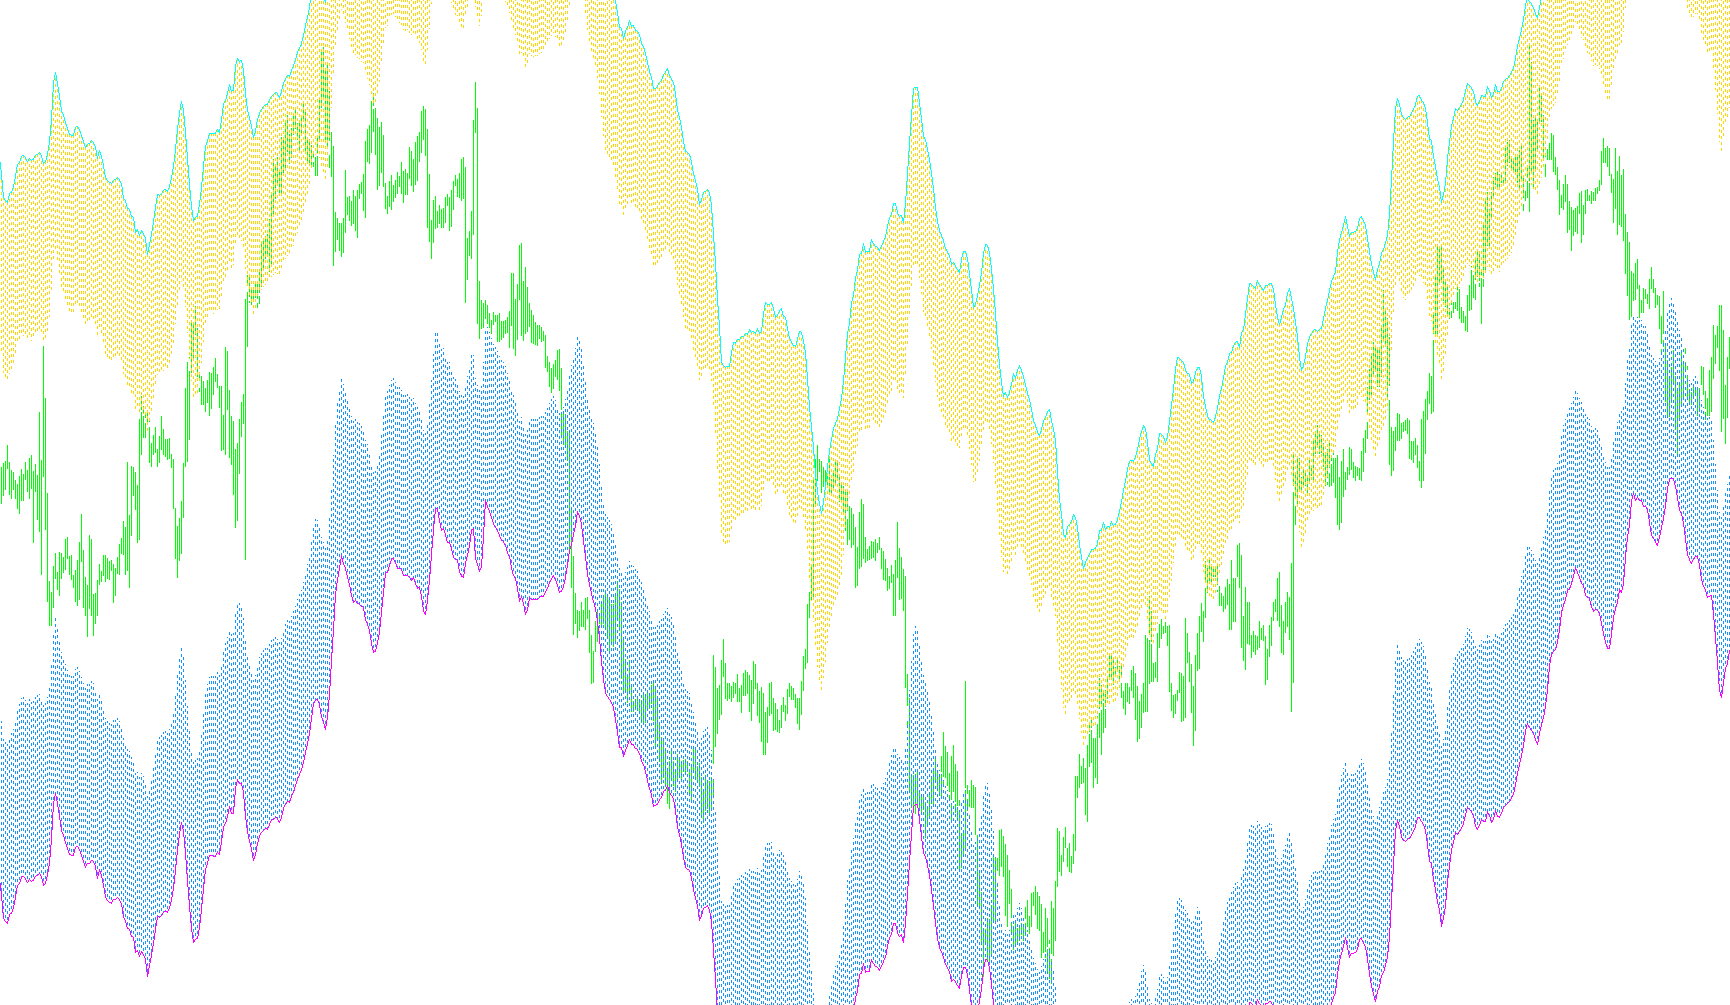
This indicator calculates dynamic price bands by adjusting a Smoothed Moving Average based on the relative deviation of a multi-period smoothed RSI.

olyakish_fractals_01
Indicator

olyakish_fractals_01

iFractals

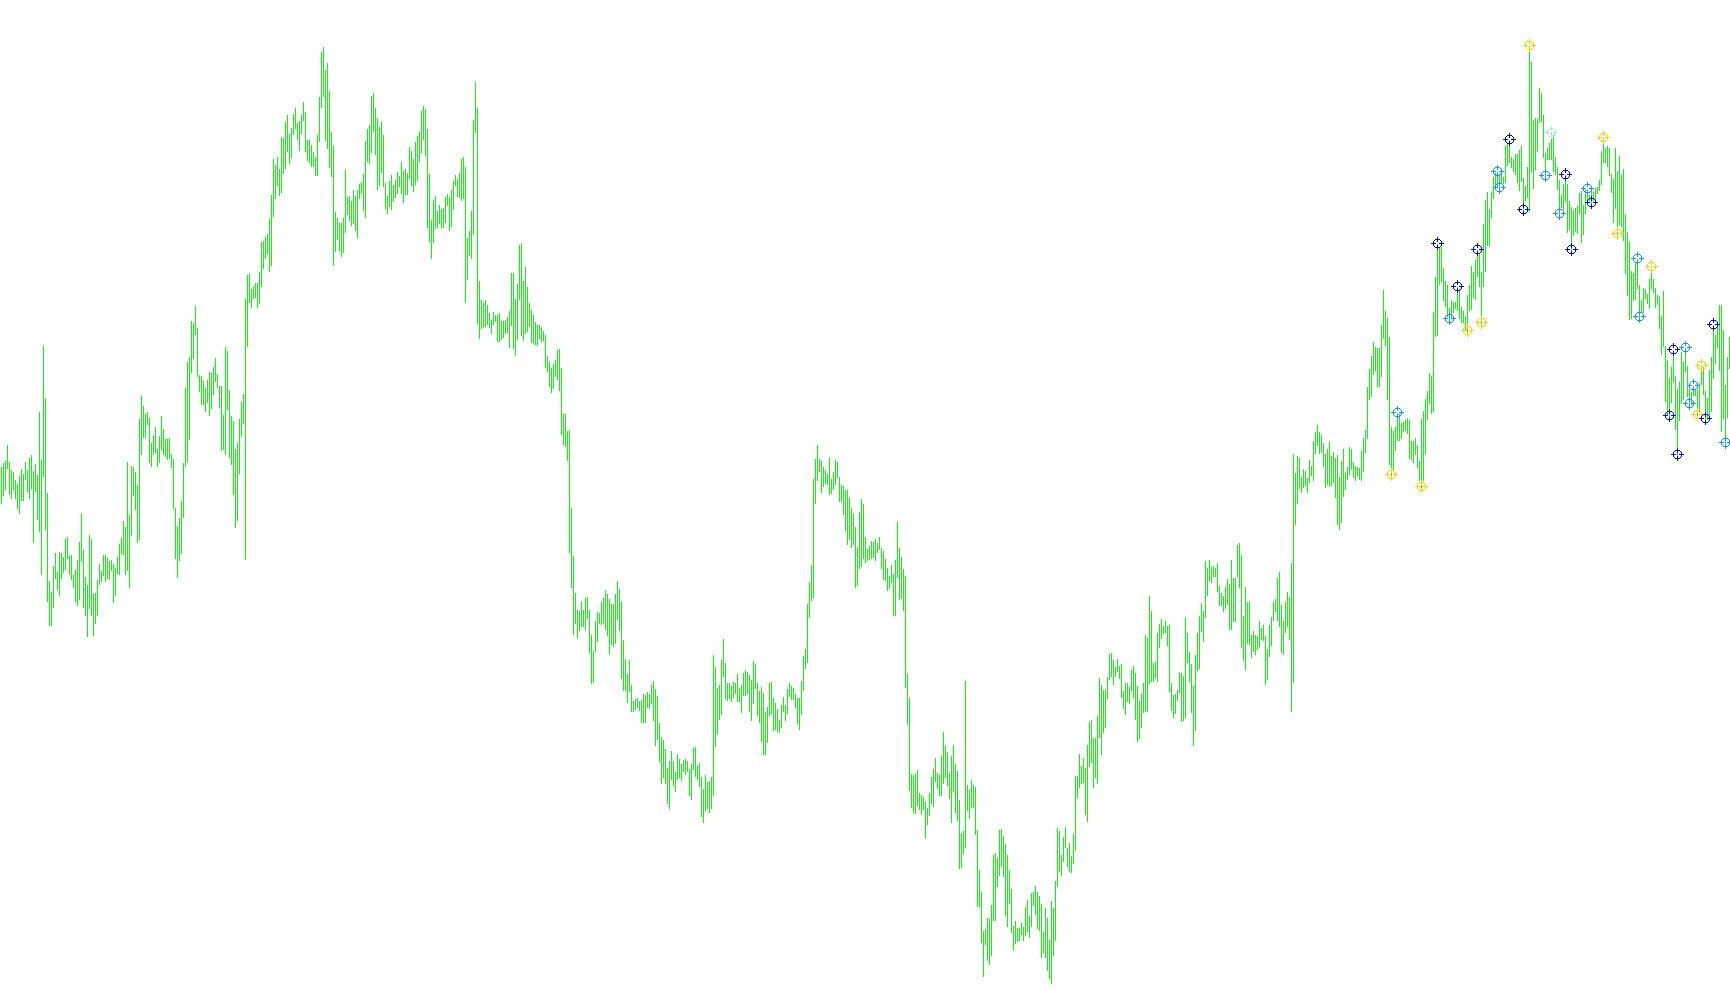
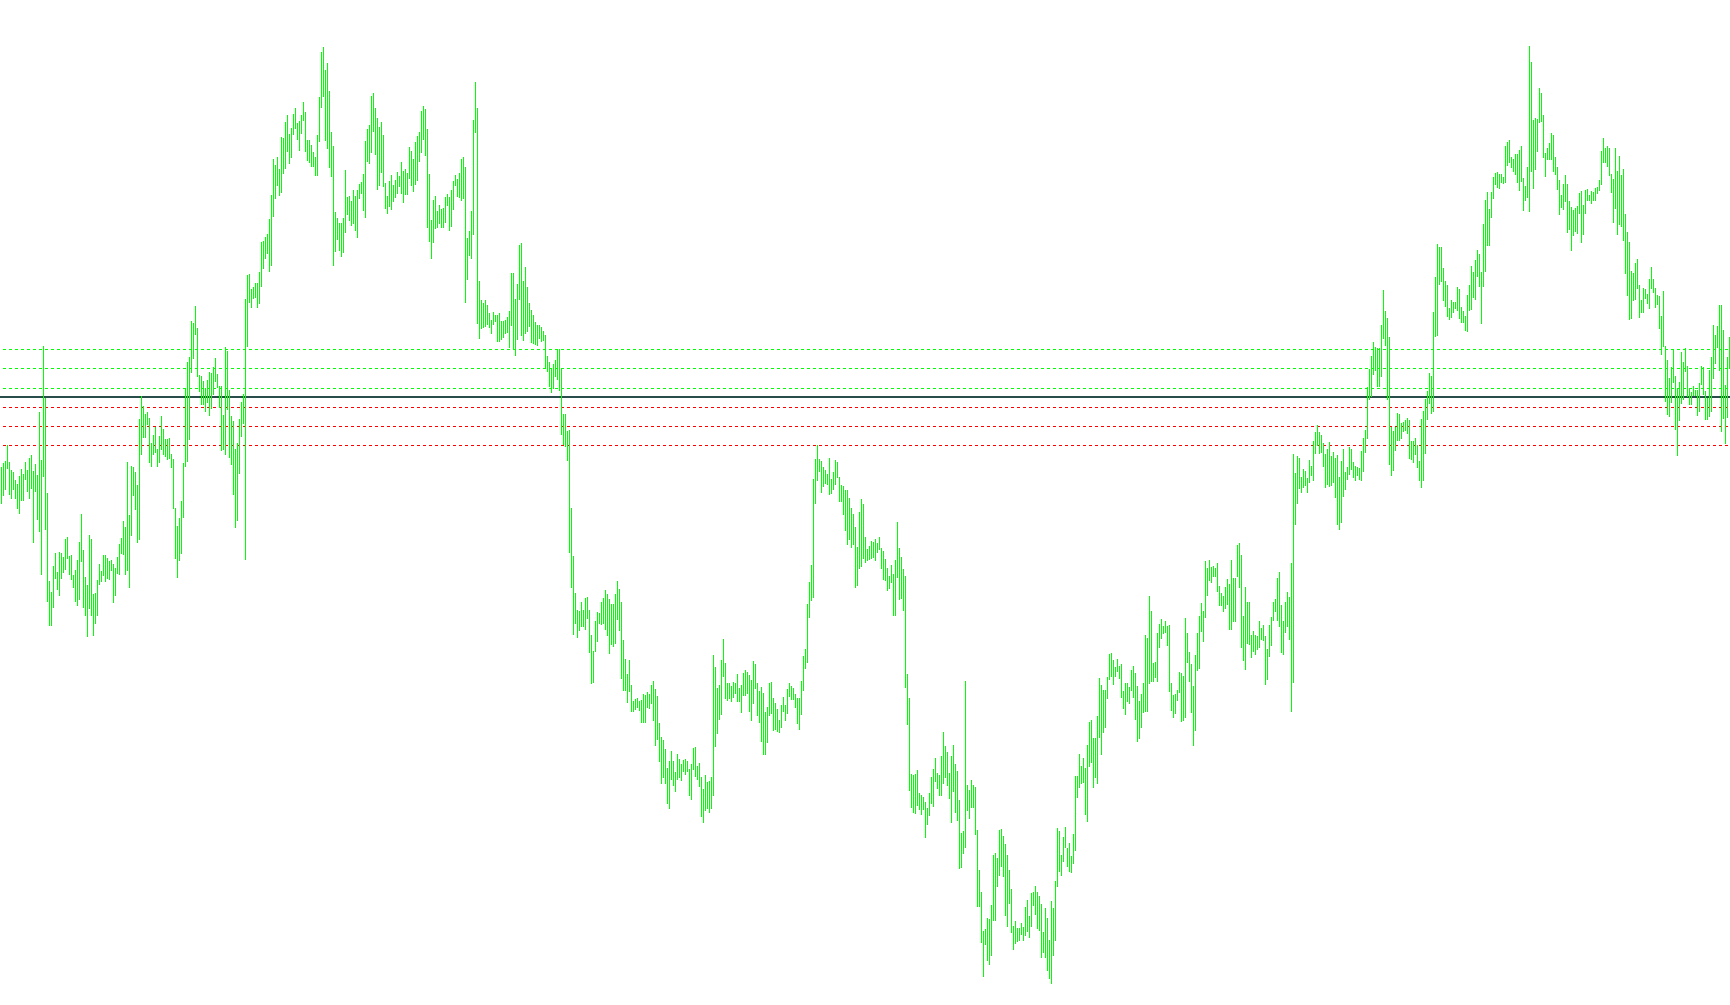
This indicator categorizes fractal price extremes by comparing their respective Money Flow Index (MFI) and cumulative volume against preceding historical peaks.

olyakish_fractals_02
Indicator

olyakish_fractals_02

iFractals

This indicator categorizes price fractals into four distinct types by comparing historical relative volume and Money Flow Index (MFI) signatures.

olyakish_fractals_03
Indicator

olyakish_fractals_03

iFractals

This indicator categorizes fractal price points by comparing multi-bar volume spikes against Money Flow Index (MFI) momentum to identify bullish, bearish, and fading market structures.

olyakish_fractals_04
Indicator

olyakish_fractals_04

iAlligatoriFractals

This indicator identifies fractal extremes by cross-referencing historical volume surges and Money Flow Index (MFI) shifts, subsequently filtering price action through an Alligator moving average envelope.

olyakish_fractals_06
Indicator

olyakish_fractals_06

iFractals

This indicator classifies fractal structures into four distinct categories by analyzing the correlation between historical price volatility, volume expansion, and median force intensity.

olyakish_fractals_06a
Indicator

olyakish_fractals_06a

This indicator identifies and categorizes fractal extremes by comparing current volume and price range momentum against historical patterns to detect significant trend shifts.

Indicator

OnChart MFI

iATRiMA
Indicator

OnChart Rsi

iATRiMAiRSI
Indicator

OnChart Rsi[1]

iATRiMAiRSI
Indicator

OnChart Rsi_001

iATRiMAiRSI
Indicator

OnChart Rsi_v1

iATRiMAiRSI
Indicator

OnChart Stochastic

iATRiMAiStochastic
Indicator

OnChart Stochastic_v1

iATRiMAiStochastic
Indicator

OnChart_Stochastic_Channel_(FL_MTF)

iATRiMAiStochastic
Indicator

OnChart_Stochastic_Channel_3TFx3

iATRiMAiStochastic
Indicator

OneOrderControl

Indicator

OneSideGaussian

OneSideGaussianLibrary
Indicator

OneSideGaussianLibrary

iMA

This library computes non-linear price smoothing by applying Gaussian distribution weights mapped onto Fibonacci sequence intervals to generate weighted moving averages.

Indicator

OneTypeOrdersControl

Opening_Range_MTF
Indicator

Opening_Range_MTF

This indicator identifies the price extremes of the first period of each hour to project multi-tier breakout targets and signal zones based on historical volatility.

OpenOnlyTest
Indicator

OpenOnlyTest

Captures and prints real-time price action telemetry, including current candle boundaries and previous close prices, to the terminal log.

Open_Pivot_PlusLevels
Indicator

Open_Pivot_PlusLevels

This indicator identifies a central price anchor based on daily opening prices or pivot points and projects symmetrical support and resistance tiers using fixed point offsets.

Open_Pivot_PlusLevels_Historical
Indicator

Open_Pivot_PlusLevels_Historical

This indicator projects historical open and pivot price levels alongside three-tier support and resistance zones based on rolling daily ranges.

Indicator

OptimaticLib

Indicator

Optimisator for Combined MA Signal

iMA
OrderGuardian
Indicator

OrderGuardian

iMAiSAR

This EA automates trade management by identifying dynamic profit targets and stop-loss levels based on trendlines, channels, and technical indicators like SAR or Envelopes.

OrderHistory
Indicator

OrderHistory

This script parses the account's trading history to map out previous trade executions, profit levels, and stop-loss points directly onto the chart using directional arrows and text labels.

OrderScreenShot_v1
Indicator

OrderScreenShot_v1

This indicator monitors active trade positions and automatically captures and saves high-resolution screen snapshots of the chart at the precise moment a new transaction is opened.

Orders_Closer
Indicator

Orders_Closer

This script monitors open positions and executes immediate closures once the market price breaches a predefined pip distance from the entry point.

OS Gaussian MA
Indicator

OS Gaussian MA

The indicator calculates a non-symmetric moving average by applying a Gaussian weighting function to specific price points for enhanced trend fluidity.

OS Gaussian SR Rate
Indicator

OS Gaussian SR Rate

This indicator maps weighted price action into a normalized scale by calculating the relative position between Gaussian-smoothed high and low extremes.

OS Gaussian Support Resistance
Indicator

OS Gaussian Support Resistance

This indicator identifies dynamic price extremes by calculating the minimum and maximum values of smoothed Gaussian high/low prices over a rolling period to define structural boundaries.

OS Gaussian trend
Indicator

OS Gaussian trend

This indicator identifies directional bias by comparing the midpoint of smoothed high/low extremes against a Gaussian moving average across multiple synchronized timeframes.

Indicator

OSC-MTF_CF_SYSv1.1

iMA
osc1
Indicator

osc1

iMA

This indicator calculates a smoothed momentum value by applying a multi-stage triple exponential smoothing filter to price action to identify underlying trend trajectories.

Oscillator of ATR
Indicator

Oscillator of ATR

iMAOnArray

This indicator quantifies market momentum by calculating the differential between two moving averages of range-based price fluctuations.

OsHMA
Indicator

OsHMA

iMAiMAOnArray

This indicator calculates the difference between two Hull Moving Averages of varying periods to identify trend momentum and price velocity.

OsMA  THV
Indicator

OsMA THV

iMAiMAOnArray

This indicator calculates the difference between the MACD line and its signal line to visualize momentum shifts via a color-coded histogram and zero-line crossover alerts.

OsMA Color 1
Indicator

OsMA Color 1

iOsMA
OsMA Color 1S
Indicator

OsMA Color 1S

iOsMA
OsMA Color xb4
Indicator

OsMA Color xb4

iOsMA
OsMA Color
Indicator

OsMA Color

iOsMA
OsMA Color_004
Indicator

OsMA Color_004

iOsMA
OsMA
Indicator

OsMA

iMAiMAOnArray

Calculates the instantaneous variance between a dual-EMA spread and its moving average signal to visualize price momentum shifts.

Indicator

osma15M

iOsMA
Indicator

osma30M

iOsMA
Indicator

OsMACD

iMACDiOsMA