NRTR_color_line1
Download script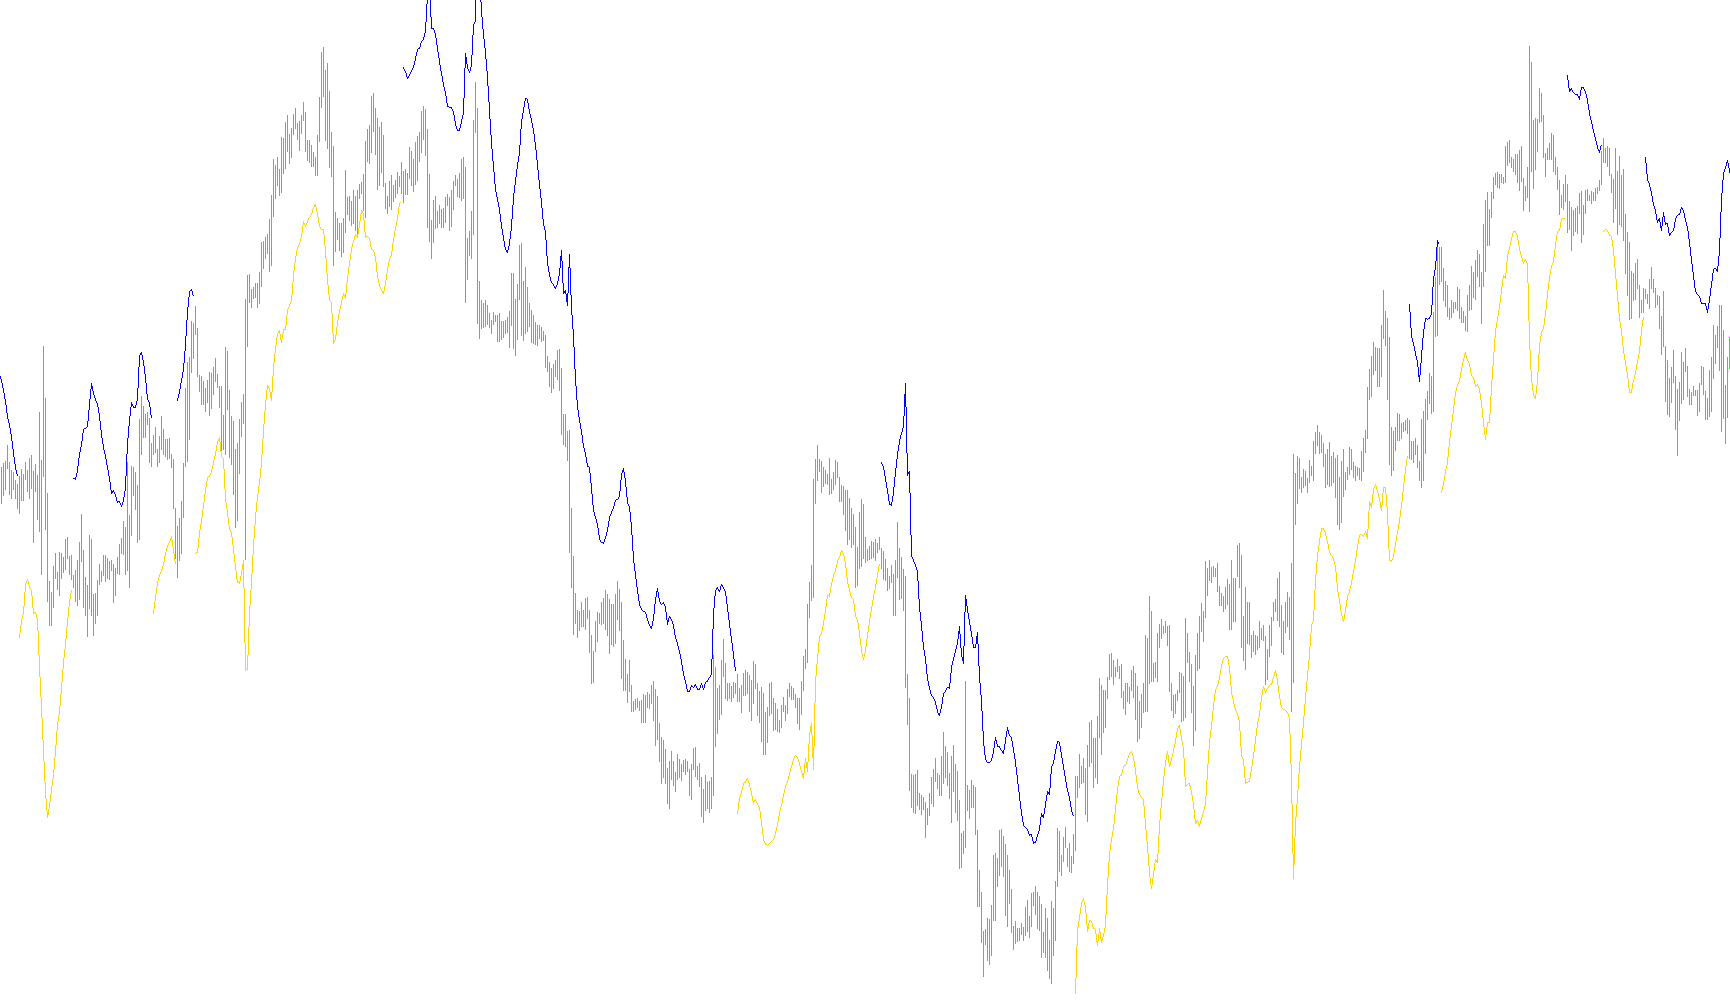
This script is designed to provide visual clarity on a trading chart by identifying and mapping price trends based on volatility. Instead of just showing where the price currently sits, it analyzes how much the market "swings" to create dynamic boundaries that help traders visualize the direction of the current movement.
Core Logic Overview
The indicator functions by measuring the intensity of market price movements over a specific period. It calculates the distance between highs and lows to determine the "volatility" of the asset. By multiplying this volatility by a user-defined coefficient, the tool creates a dynamic channel or "buffer zone" around the price.
How it Works
The logic operates through three main stages:
1. Trend Identification The script begins by looking at historical data to establish an initial direction (Upward or Downward). It does this by comparing recent closing prices. From that starting point, it continuously monitors whether the price is breaking out of its established range.
2. Dynamic Boundary Calculation Unlike static lines, the boundaries used by this script move and expand based on market conditions:
- In a volatile market (large price swings), the boundaries widen to reflect higher uncertainty.
- In a calm market (small price swings), the boundaries tighten to reflect more stable movement.
3. Trend Reversal Detection The script constantly checks if the price has breached these dynamic boundaries:
- For an Uptrend: If the price drops significantly below the calculated lower boundary, the script identifies a trend reversal and switches to a Downward state.
- For a Downtrend: If the price rises significantly above the upper boundary, it identifies a reversal to an Upward state.
Visual Output
The tool translates these calculations into two distinct lines on your chart:
- When the market is in an Uptrend, it highlights the lower boundary line (representing the support level the price is "holding" above).
- When the market is in a Downtrend, it highlights the upper boundary line (representing the resistance level the price is "holding" below."
Essentially, this script acts as a trend-tracking guide that adjusts itself automatically to the "speed" and "mood" of the market, helping you see where the current trend's limits are in real-time.
/*-----------------------------+
|			       |
| Shared by www.Aptrafx.com    |
|			       |
+------------------------------*/

//+------------------------------------------------------------------+
//|                                              NRTR_color_line.mq4 |
//+------------------------------------------------------------------+

#property indicator_chart_window
#property indicator_buffers 2
#property indicator_color1 Blue
#property indicator_color2 Red
//---- input parameters
extern int ATRPeriod=14;
extern double Coefficient=4.0;
extern int StartBar=1000;

//---- buffers
double value1[];
double value2[];

bool TrendUP;
double Extremum,TR,ATR,Values[100],ChannelWidth;
int J,Head,Weight,Curr;

int init() {

//---- indicator line
   IndicatorBuffers(2);
   SetIndexStyle(0,DRAW_LINE);
   SetIndexArrow(0,167);
   SetIndexEmptyValue(0,0);
   SetIndexEmptyValue(1,0);
   SetIndexStyle(1,DRAW_LINE);
   SetIndexArrow(1,167);
   SetIndexBuffer(0,value1);
   SetIndexBuffer(1,value2);
   return(0);
}

int start() {
   int Shift;

   if (Close[StartBar-2] > Close[StartBar-1]) TrendUP = true;
   else TrendUP = false;
   Extremum = Close[ StartBar - 2 ];

   for (Shift = StartBar - 3; Shift>=0; Shift--) {
	   TR = High[Shift] - Low[Shift];
	   if ( MathAbs( High[ Shift ] - Close[ Shift + 1 ]) > TR ) TR = MathAbs( High[ Shift ] - Close[ Shift + 1 ]);
	   if ( MathAbs( Low[ Shift ] - Close[ Shift + 1 ]) > TR )  TR = MathAbs( Low[ Shift ] - Close[ Shift + 1 ]);
	   if (Shift == StartBar - 3)
		   for (J = 0; J<ATRPeriod; J++) {
			   Values[J] = TR;
		   }
	   Values[ Head ] = TR;
	   ATR = 0;
	   Weight = ATRPeriod;
	   Curr = Head;
	   for (J = 0; J<ATRPeriod; J++) {
		   ATR += Values[ Curr ] * Weight;
		   Weight -= 1;
		   Curr -= 1;
		   if ( Curr == -1 ) Curr = ATRPeriod - 1;
	   }
	   ATR = ( 2.0 * ATR ) / ( ATRPeriod * ( ATRPeriod + 1.0 ));
	   Head += 1;
	   if (Head == ATRPeriod) Head = 0;
	   ChannelWidth = Coefficient * ATR;
	   if (TrendUP && ( Low[ Shift ] < ( Extremum - ChannelWidth ) ) )  {
		   TrendUP = false;
		   Extremum = High[ Shift ];
	   }
	   if ( !TrendUP && ( High[ Shift ] > ( Extremum + ChannelWidth) ) ) {
		   TrendUP = true;
		   Extremum = Low[ Shift ];
	   }

	   if ( TrendUP && ( Low[Shift] > Extremum ) ) Extremum = Low[ Shift ];
	   if ( !TrendUP && ( High[ Shift ] < Extremum ) ) Extremum = High[ Shift ];

	   if (TrendUP) {
		   value1[Shift]=Extremum - ChannelWidth;
		   value2[Shift]=0;
	   } else {
		   value1[Shift]=0;
		   value2[Shift]=Extremum + ChannelWidth;
	   }
	}
}
Comments