AggZ
Indicator

AggZ

iMAiStdDev

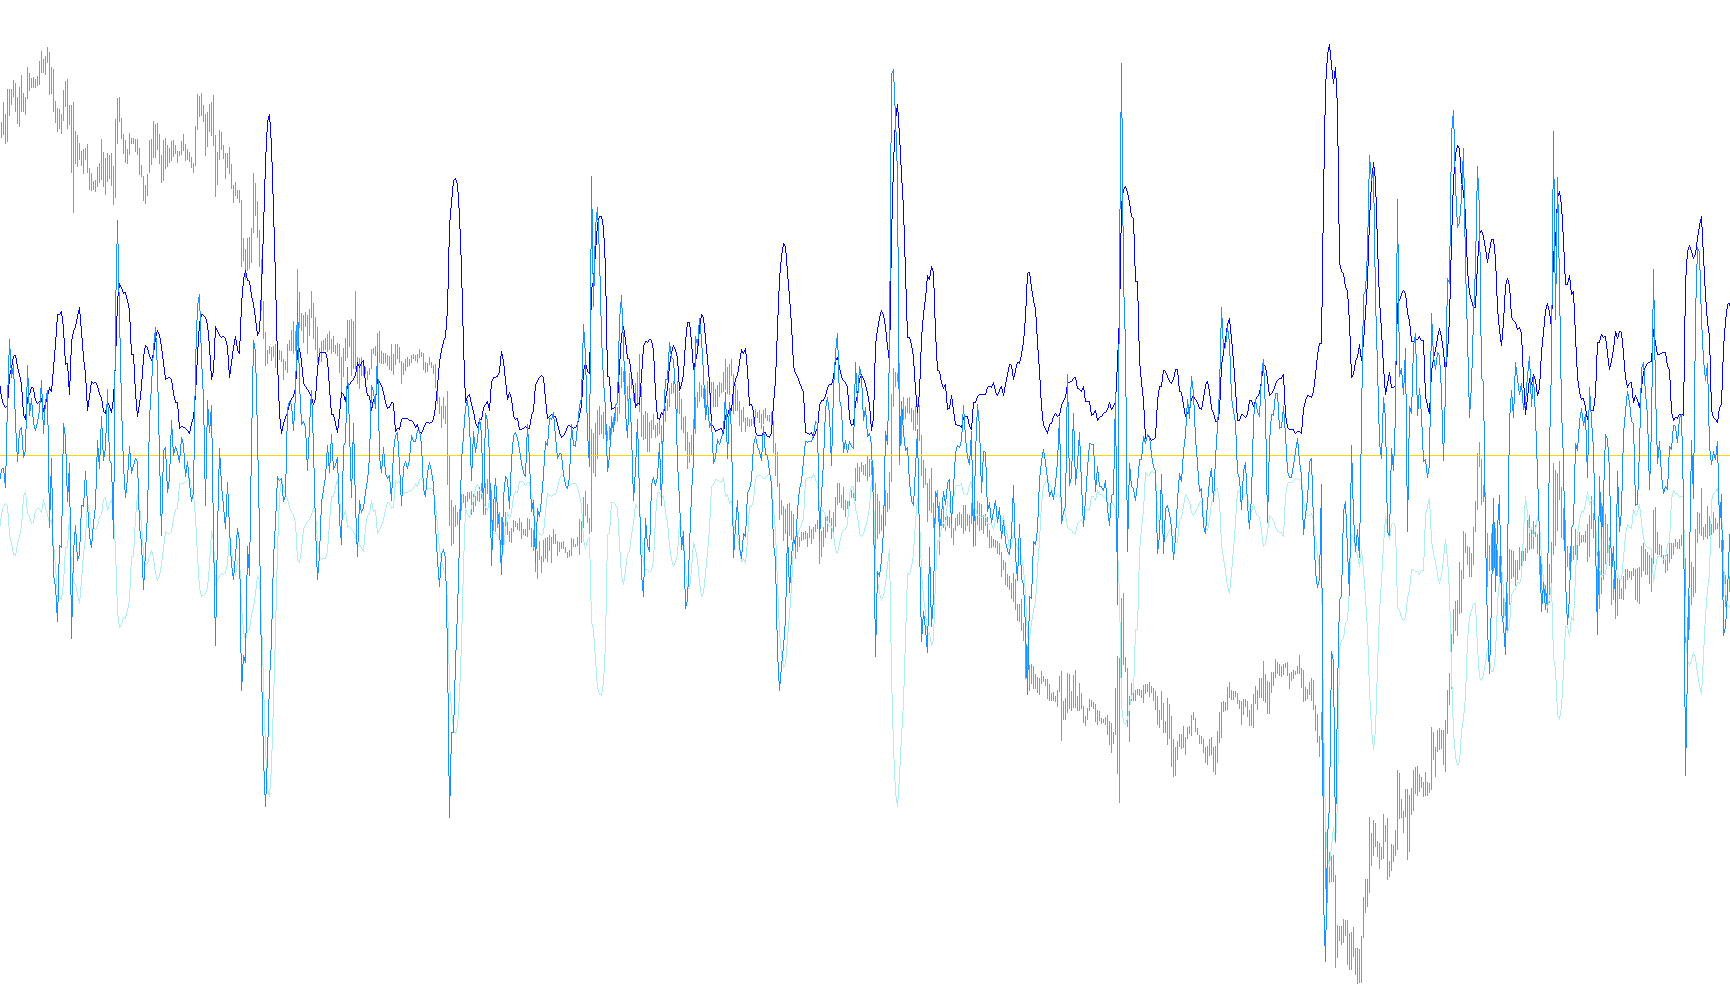
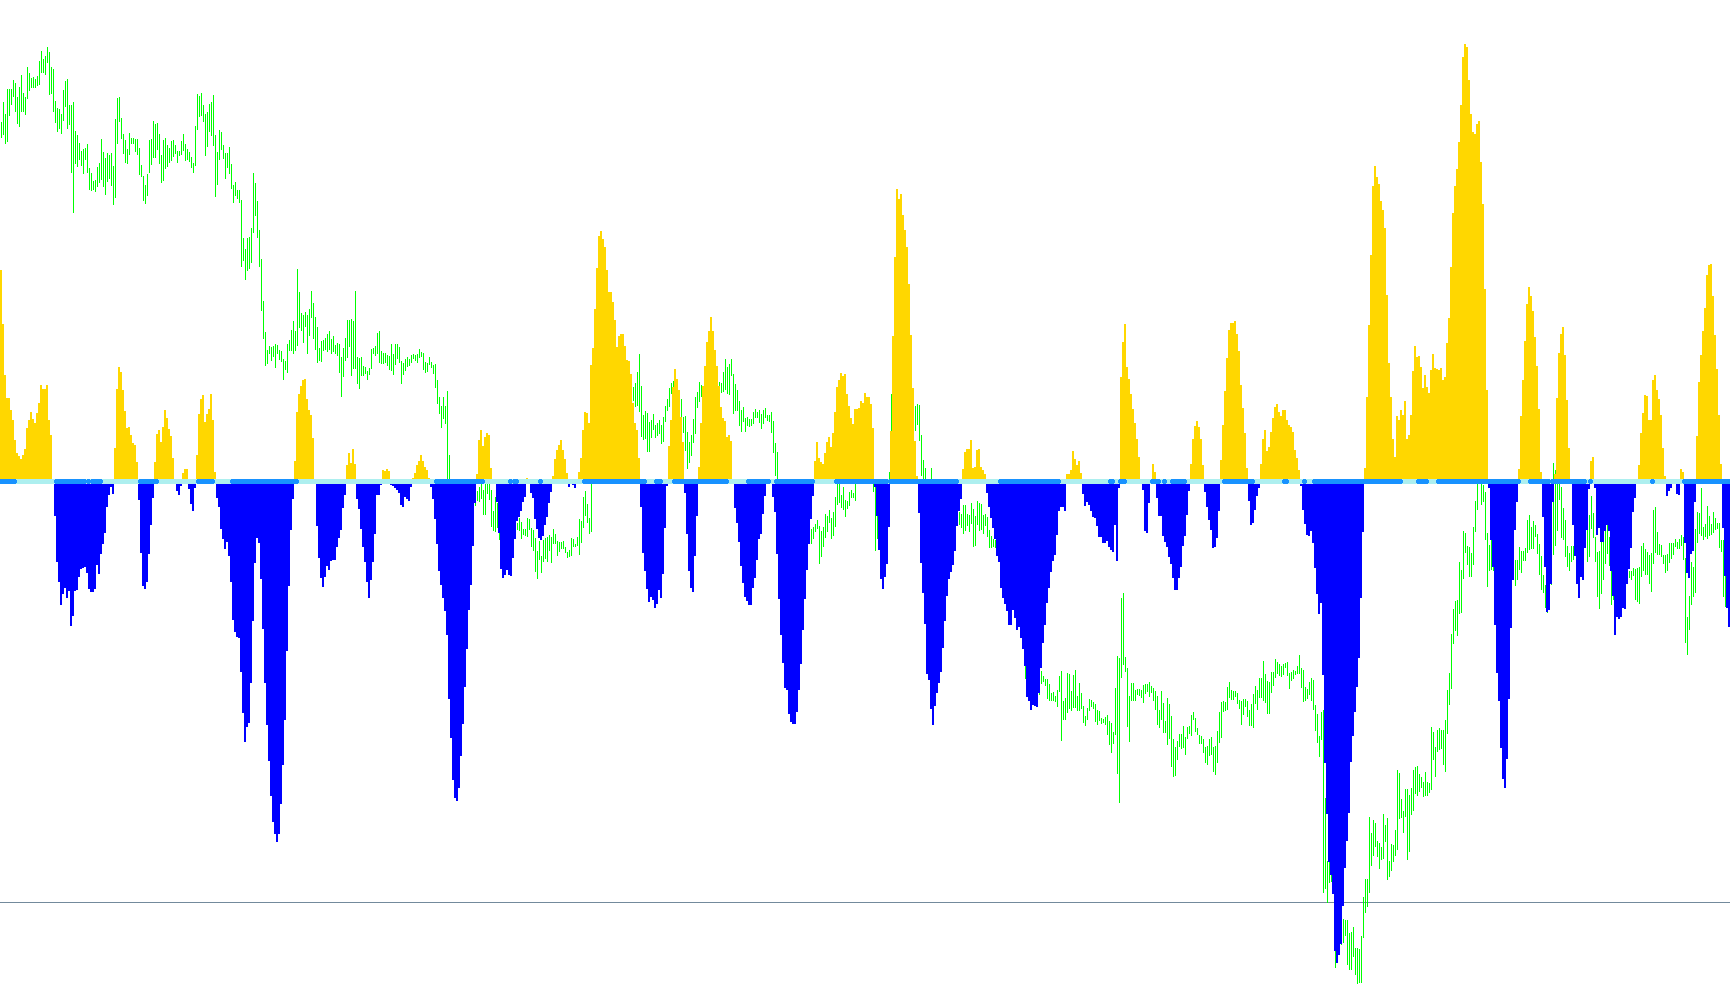
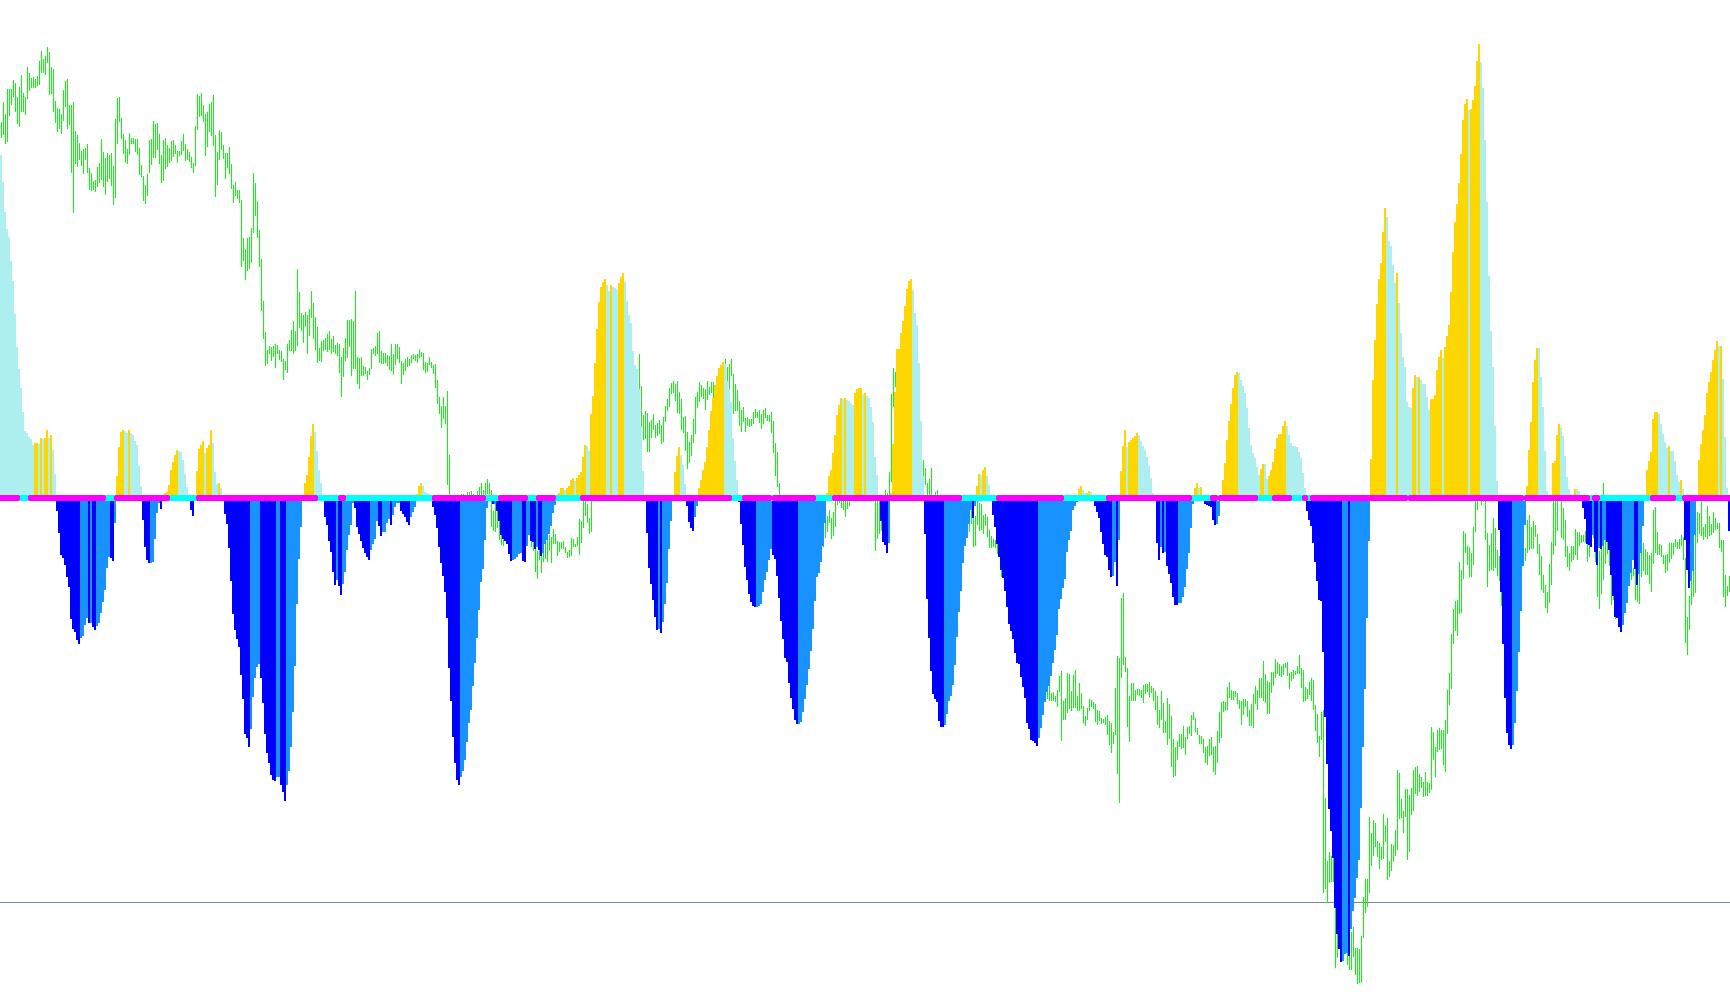
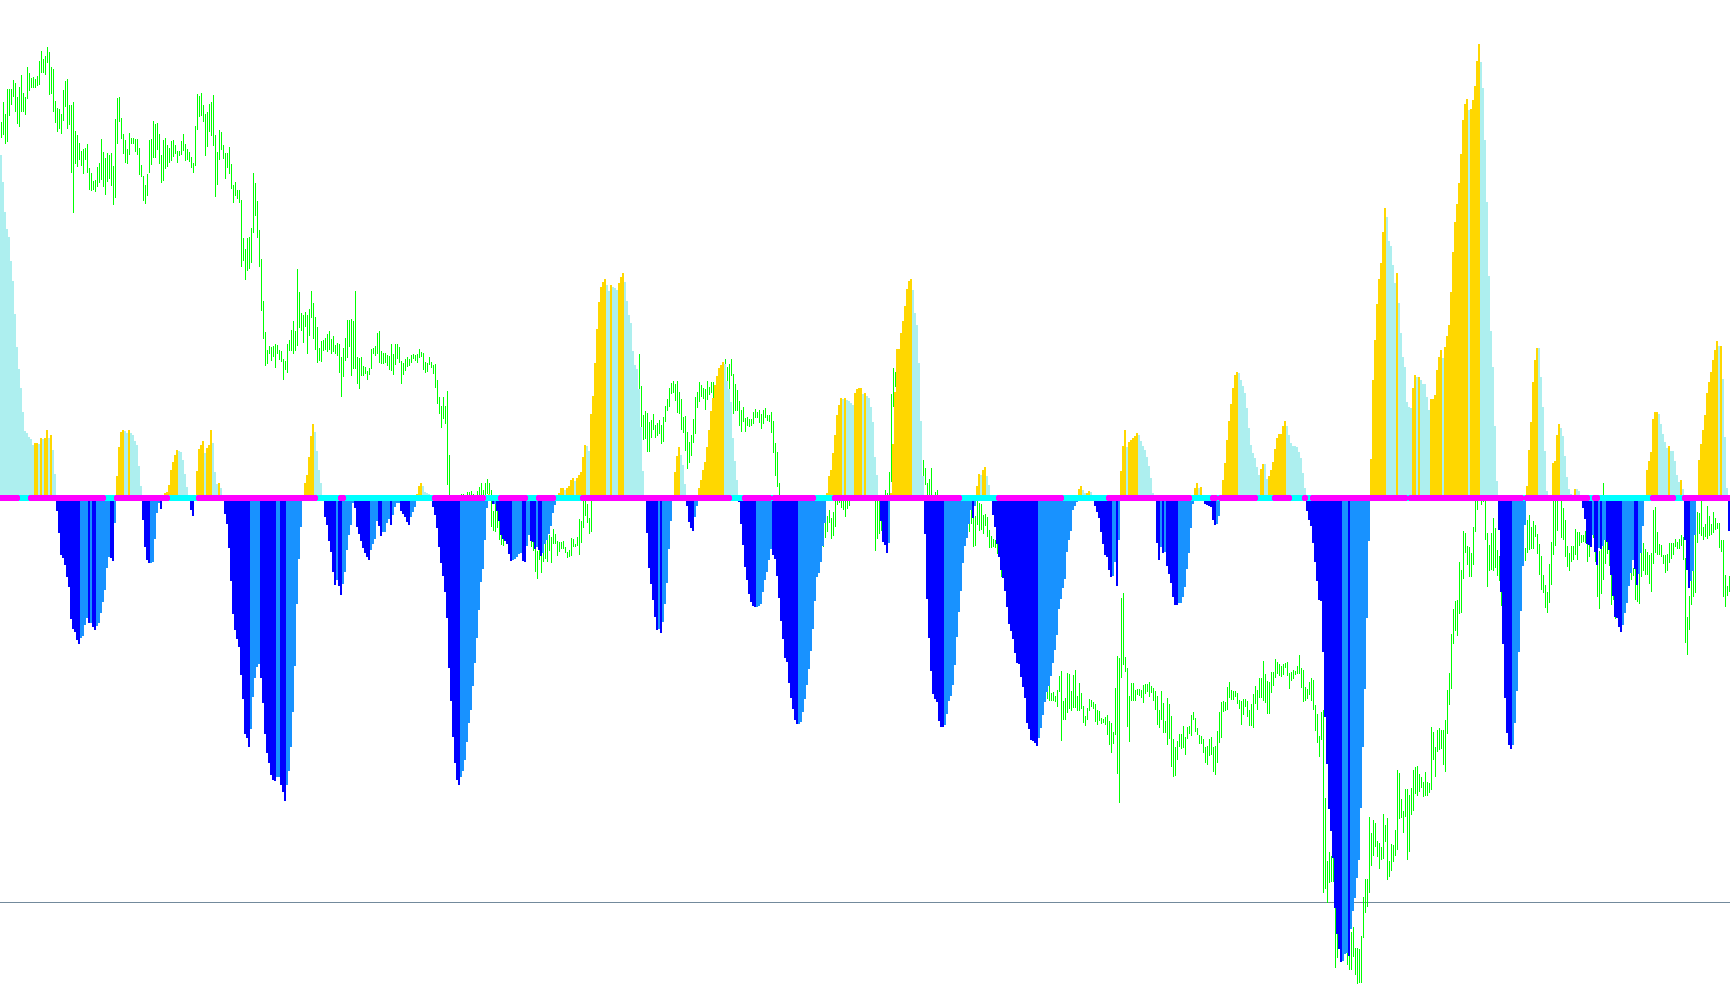
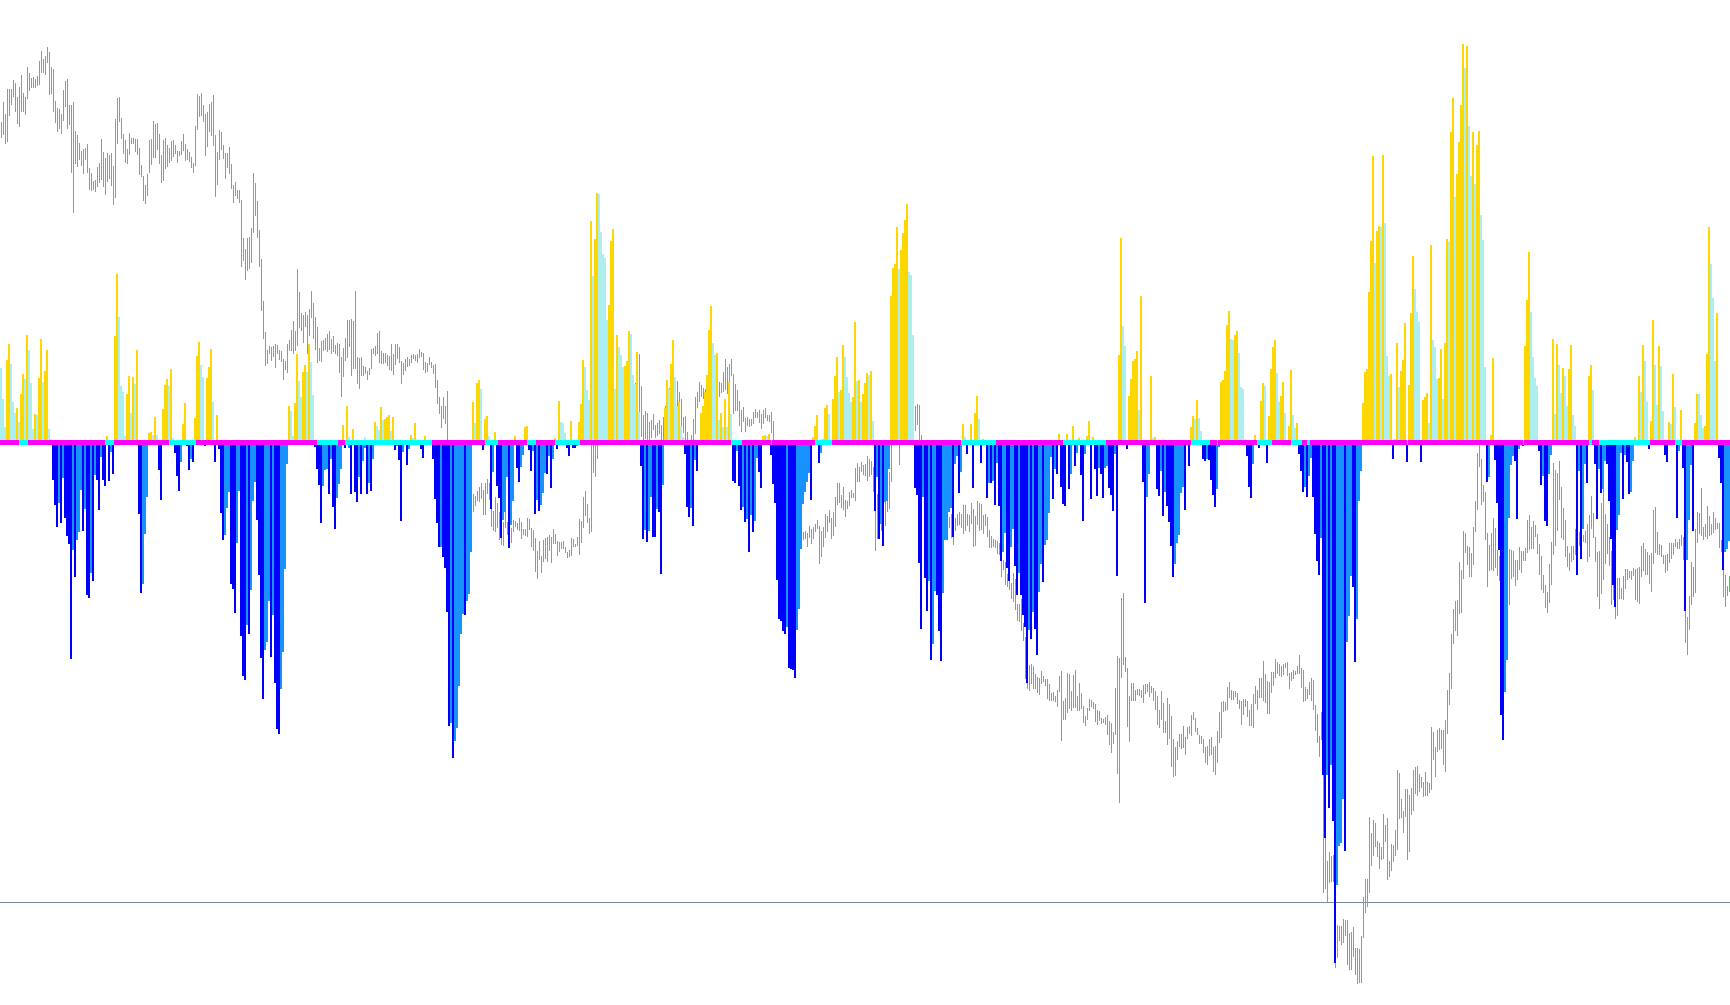
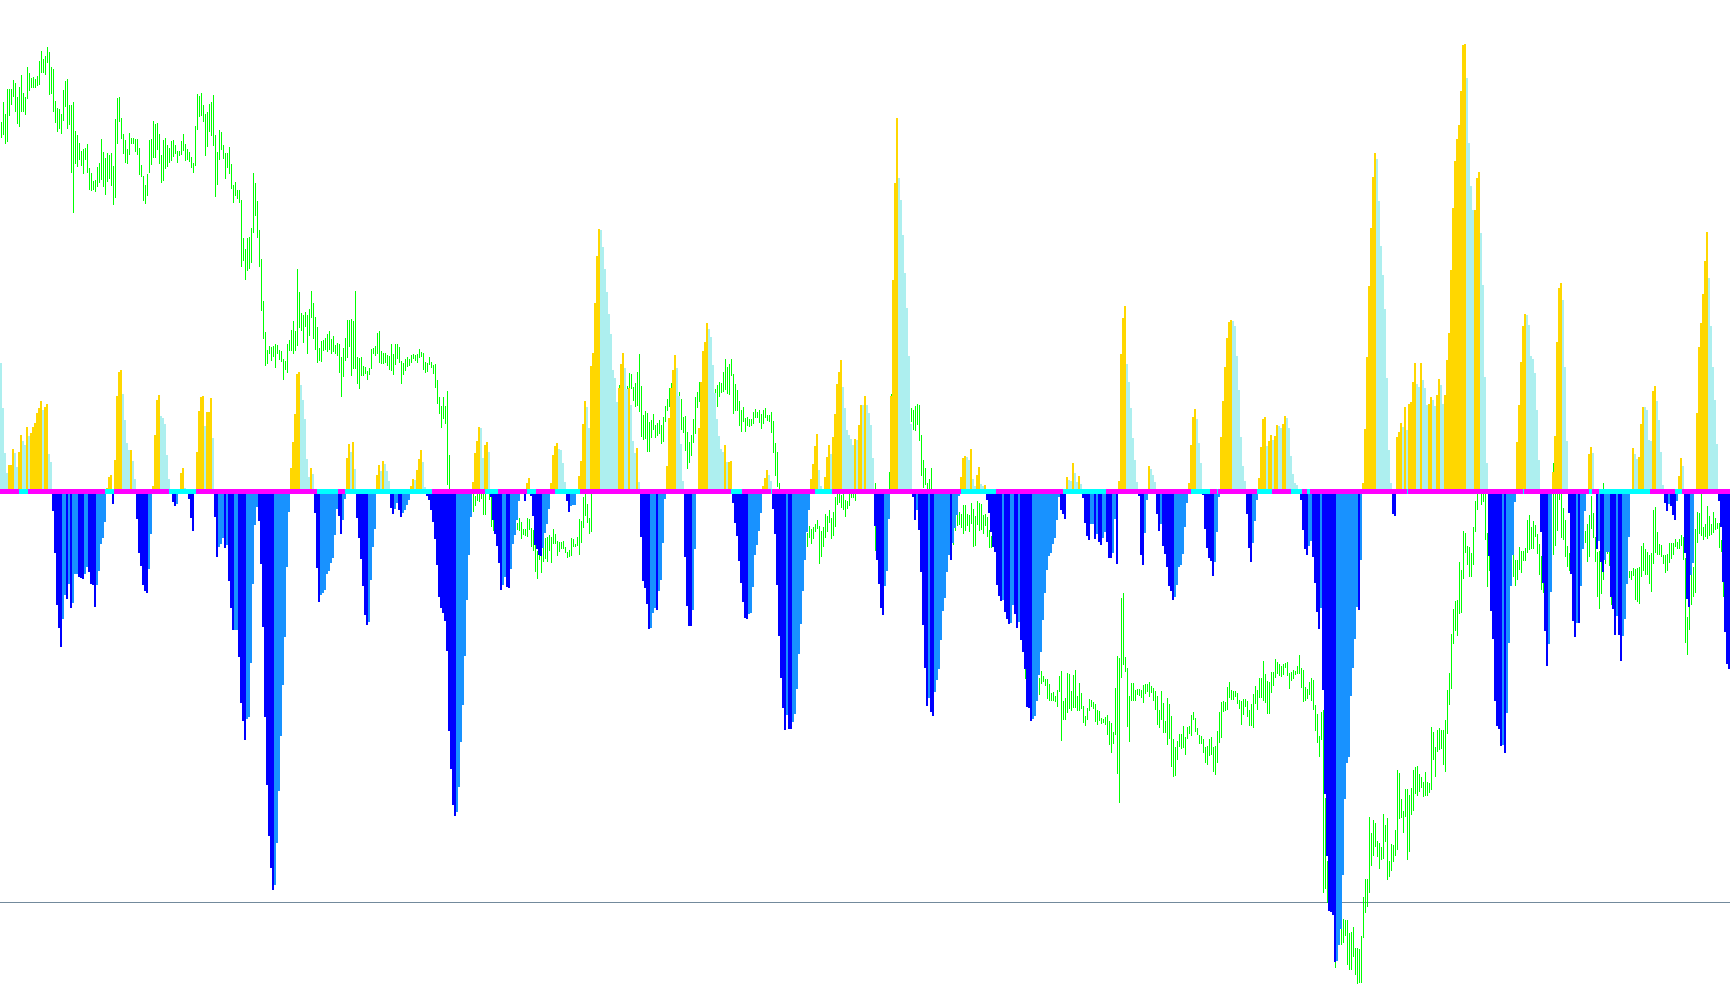
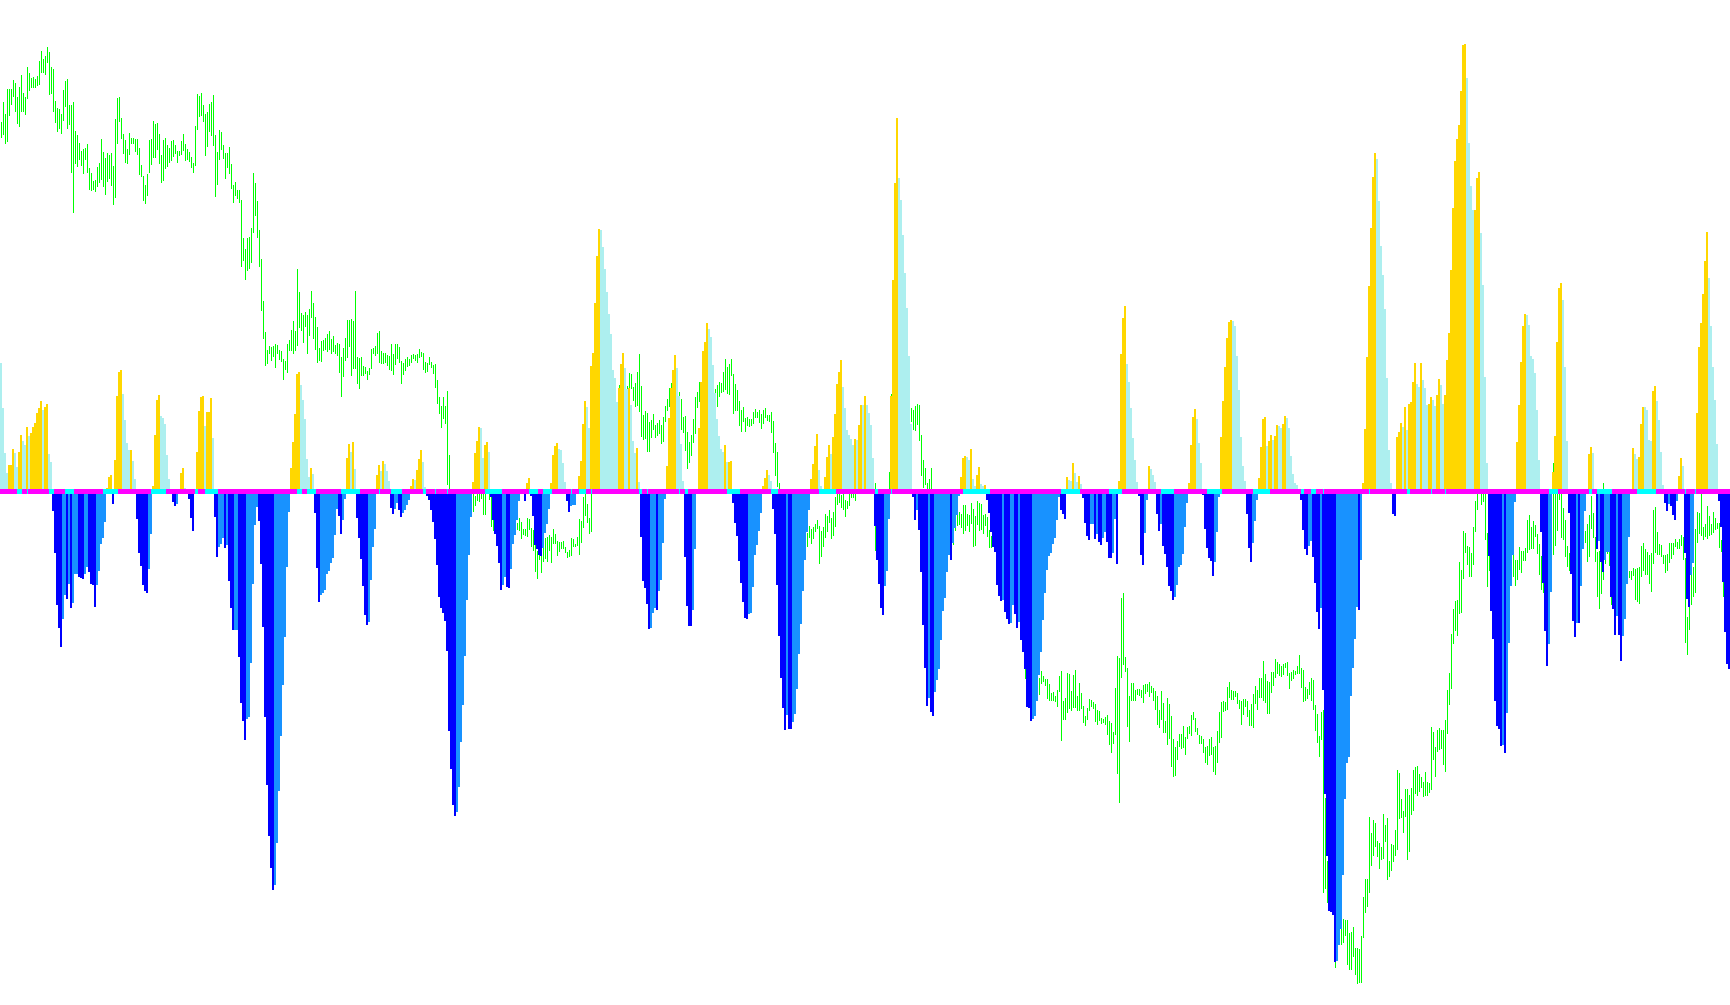
This indicator computes a composite momentum oscillator by averaging the inverse short-term z-score with the long-term z-score to identify mean reversion and trend exhaustion.

ang_PR (Din)-v1+SQStdN
Indicator

ang_PR (Din)-v1+SQStdN

iStdDev

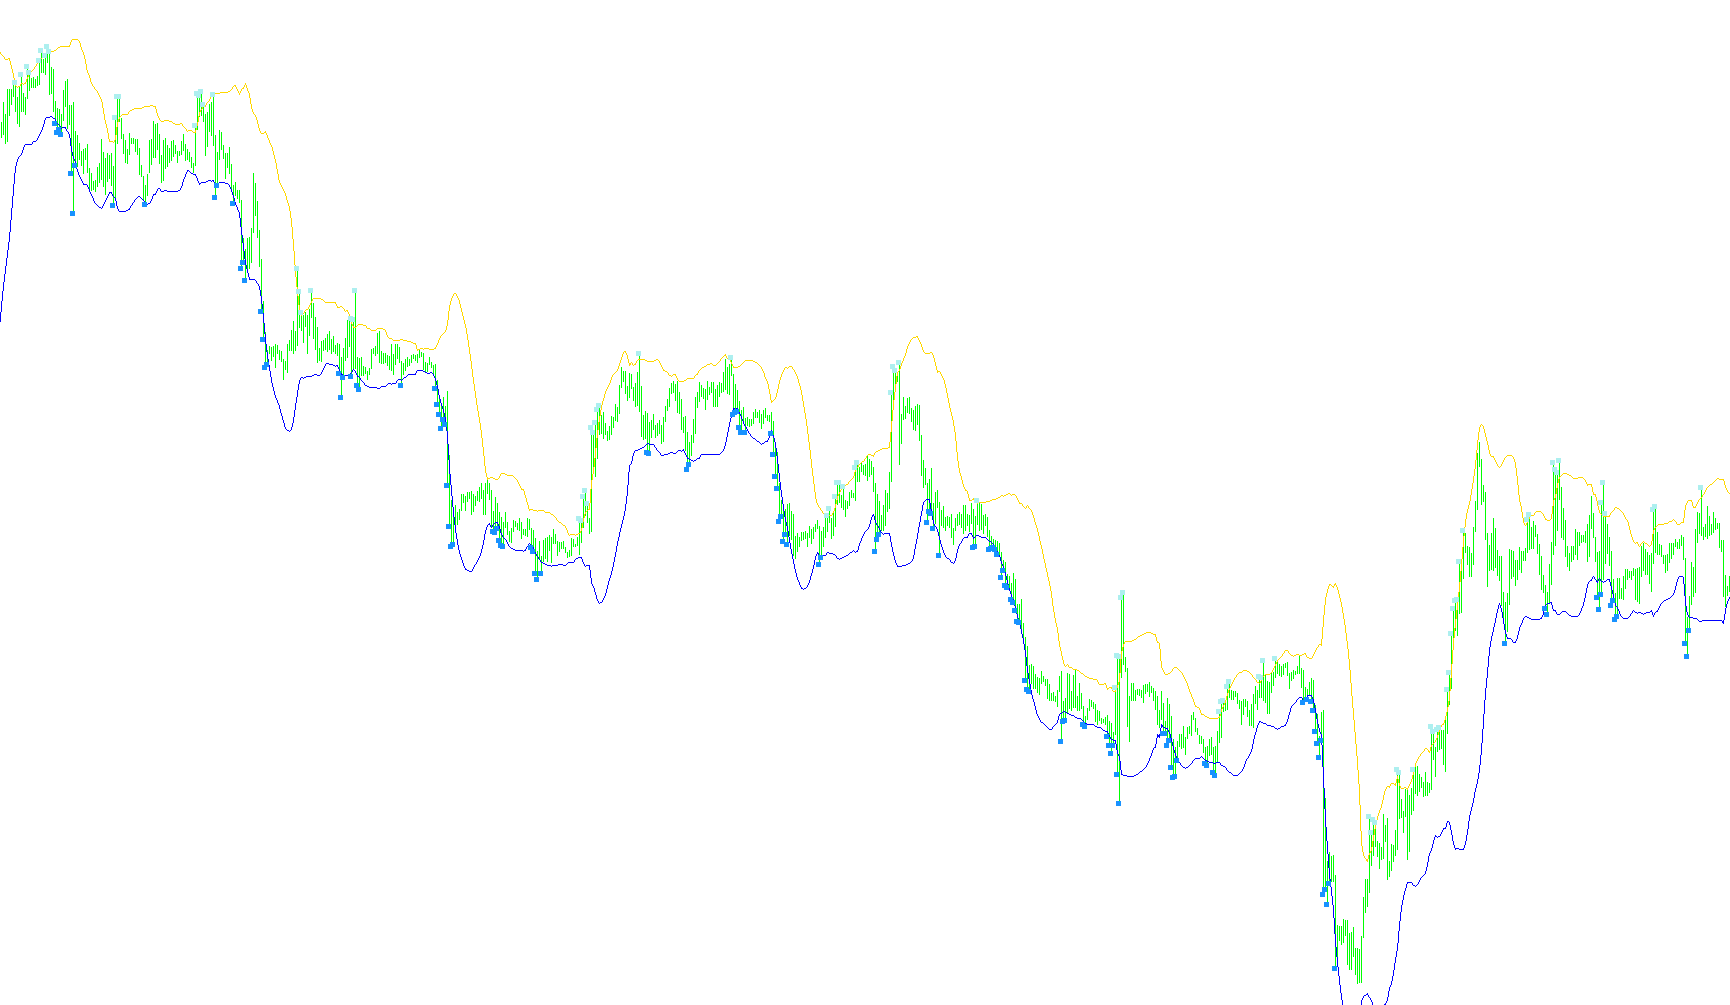
The indicator utilizes Gaussian elimination to solve a system of linear equations, projecting a polynomial curve and dynamic volatility bands onto price action.

ang_PR (Din)-v1+SQStdN_v1
Indicator

ang_PR (Din)-v1+SQStdN_v1

iStdDev

This indicator utilizes Gaussian elimination to solve a matrix of polynomial coefficients, creating a smoothed regression curve and dynamically calculated standard deviation boundaries.

ang_PR (Din)-v1+SQStdN_v2
Indicator

ang_PR (Din)-v1+SQStdN_v2

iStdDev

This indicator utilizes a Gaussian elimination matrix algorithm to perform polynomial regression on price data, generating dynamic upper and lower standard deviation envelopes.

ATM_LRCpath
Indicator

ATM_LRCpath

iStdDev
AutoEnvelope
Indicator

AutoEnvelope

iMAiStdDev

This indicator calculates dynamic trading bands around a moving average, using standard deviation smoothed by another moving average to adapt to market volatility, based on Alexander Elder's envelope concept.
basevolatility
Indicator

basevolatility

iStdDev

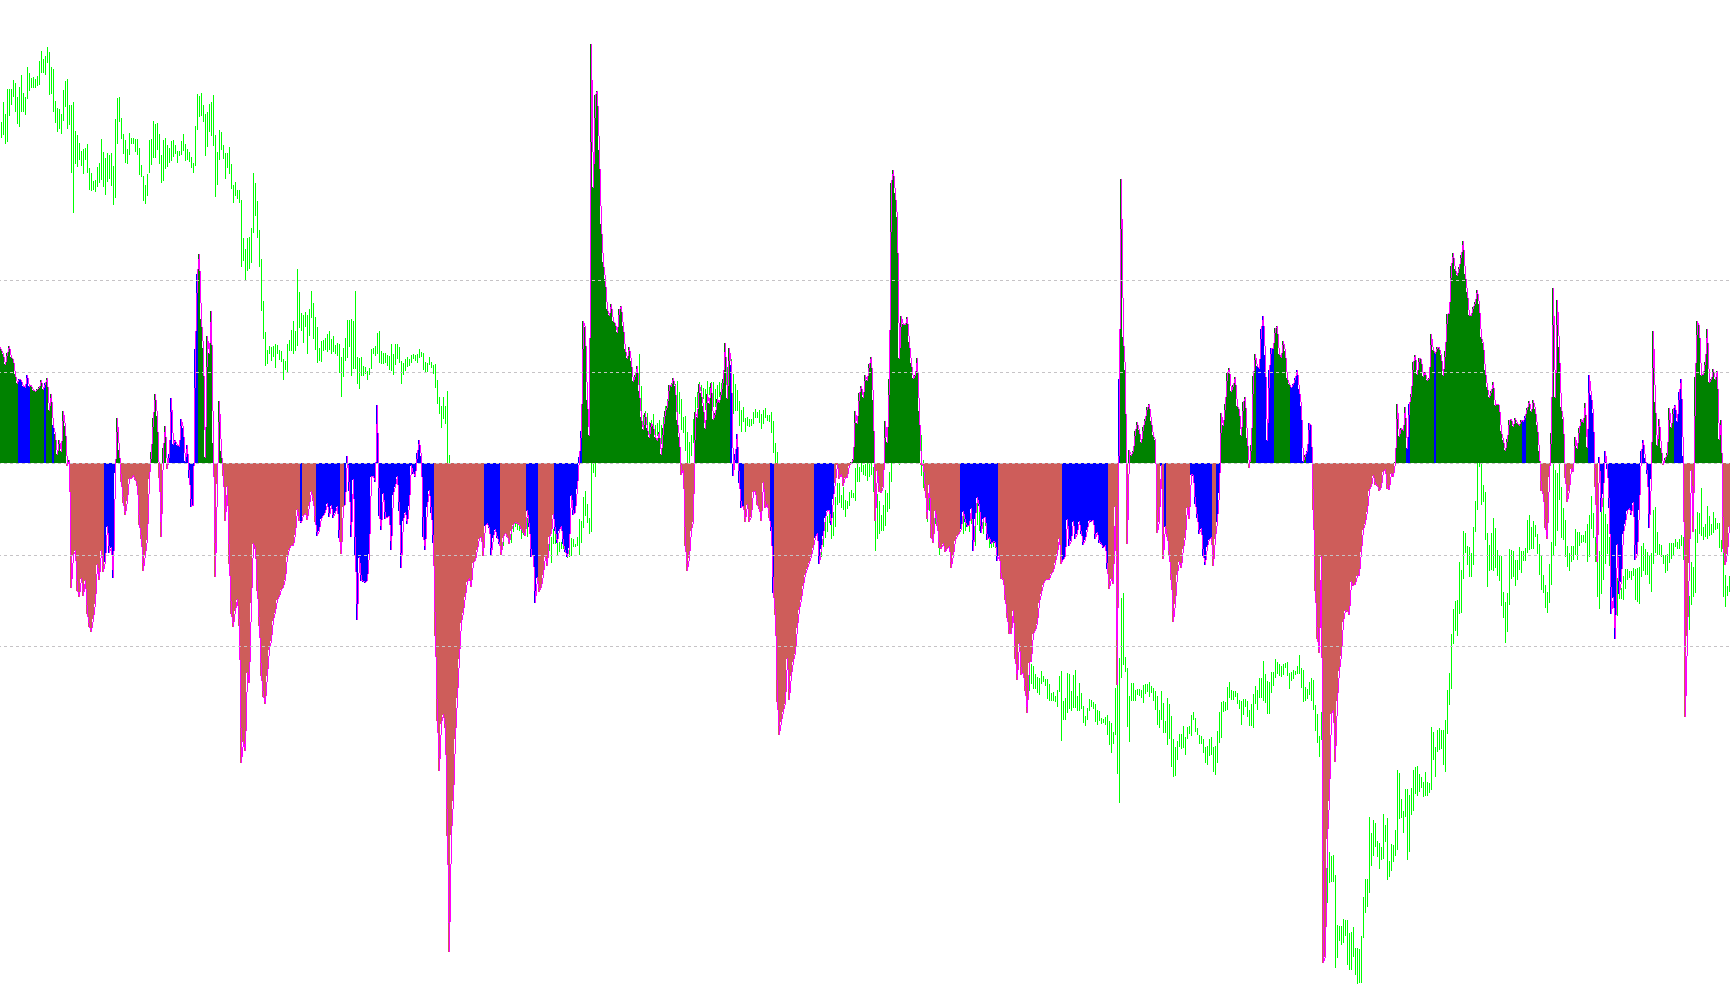
This indicator quantifies market instability by calculating a moving average of standard deviation values sampled at randomized intervals to filter noise.
BBflat
Indicator

BBflat

iMAiStdDev

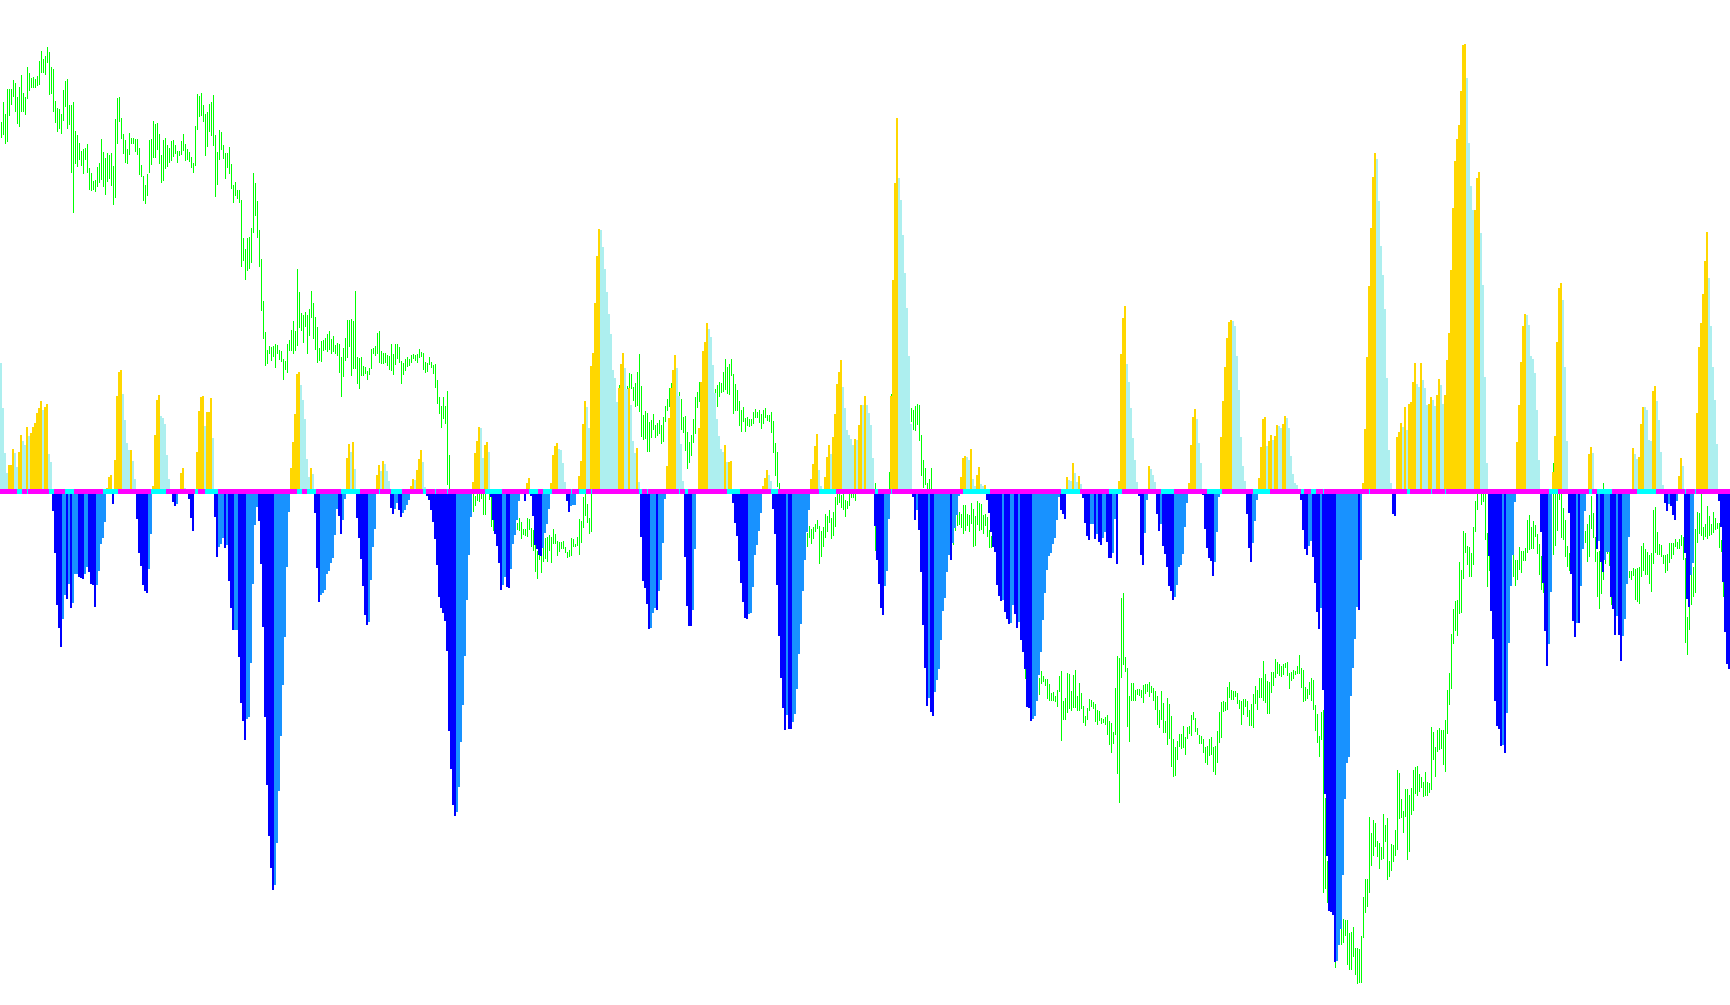
This indicator quantifies market volatility by mapping the standard deviation bands and calculating the real-time price distance from the moving average.

BBflat_sw
Indicator

BBflat_sw

iMAiStdDev
BBflat_sw_v1
Indicator

BBflat_sw_v1

iMAiStdDev

This indicator quantifies market sentiment by visualizing the absolute distance of price action from its moving average relative to standard deviation thresholds.

BBhisto
Indicator

BBhisto

iMAiStdDev

This indicator quantifies the price's relative position within a Bollinger Band structure by calculating a normalized variance value plotted as a histogram.

bbhisto_sq
Indicator

bbhisto_sq

iATRiMAiStdDev

Identifies periods of extreme market stagnation by calculating the ratio between Bollinger Band standard deviation and ATR-based volatility to pinpoint potential breakout signals.

bbhisto_v1
Indicator

bbhisto_v1

iMAiStdDev
bbhisto_v2
Indicator

bbhisto_v2

iMAiStdDev
BbSq-OsMA
Indicator

BbSq-OsMA

iATRiOsMAiStdDev
Indicator

bbsqueeze w Alert

iATRiMAiStdDev
bbsqueeze
Indicator

bbsqueeze

iATRiMAiStdDev

This indicator identifies high-volatility expansion phases by measuring the ratio between Bollinger Band deviation and ATR-adjusted volatility, while using linear regression slopes to determine trend direction.

bbsqueeze1
Indicator

bbsqueeze1

iATRiMAiStdDev

Identifies high-probability breakout opportunities by monitoring the ratio between linear regression slopes and volatility-adjusted standard deviations.

bbsqueeze1_v1
Indicator

bbsqueeze1_v1

iATRiMAiStdDev
bbsqueezemodified
Indicator

bbsqueezemodified

iATRiMAiStdDev
bbsqueeze_001
Indicator

bbsqueeze_001

iATRiMAiStdDev

This indicator identifies high-probability trend reversals by detecting periods of low volatility relative to linear regression price action.

bbsqueeze_003
Indicator

bbsqueeze_003

iATRiMAiStdDev

This indicator identifies trend momentum using a custom linear regression slope while signaling potential volatility breakouts by comparing standard deviation against ATR-based price expansion.

bbsqueeze_dark
Indicator

bbsqueeze_dark

iATRiMAiStdDev

This indicator identifies volatility compression and expansion by cross-referencing linear regression trends with a modified Bollinger Band squeeze metric.

bbsqueeze_dark[1]
Indicator

bbsqueeze_dark[1]

iATRiMAiStdDev
bbsqueeze_dark_001
Indicator

bbsqueeze_dark_001

iATRiMAiStdDev
bbsqueeze_v1
Indicator

bbsqueeze_v1

iATRiMAiStdDev

This indicator identifies potential trend breakouts by calculating the ratio between Bollinger Band standard deviation and ATR-based volatility to detect price compression.

BB_FlatSq_mtf_sw
Indicator

BB_FlatSq_mtf_sw

iATRiMAiStdDev
BB_SqueezeLRSml_4c
Indicator

BB_SqueezeLRSml_4c

iATRiMAiStdDev

This indicator identifies volatility compression by calculating the ratio between Bollinger Band deviation and Keltner Channel width while mapping price momentum via linear regression slopes.

BB_SqueezeLRSm_4c
Indicator

BB_SqueezeLRSm_4c

iATRiMAiStdDev

This indicator identifies market volatility compression by comparing Keltner Channel width against Bollinger Band standard deviation while plotting linear regression slopes to detect directional momentum shifts.

BB_Squeeze_4c_JMA
Indicator

BB_Squeeze_4c_JMA

iATRiStdDev
Indicator

BB_Squeeze_Advanced_v2

iCCIiMACDiRSIiStochastic
Indicator

BB_Squeeze_Advanced_v2M

iCCIiMACDiRSIiStochastic
Indicator

BB_Squeeze_Advanced_v2M2

iCCIiMACDiRSIiStochastic
Indicator

BB_Squeeze_Advanced_v2M3

iCCIiMACDiRSIiStochastic
Indicator

BB_Squeeze_Advanced_v2M3B

iCCIiMACDiRSIiStochastic
Indicator

BB_Squeeze_Advanced_v2M3BC

iCCIiMACDiRSIiStochastic
Indicator

BB_Squeeze_Advanced_v2_v1

iCCIiMACDiRSIiStochastic
BB_Sqz_sBar_mtf_sw
Indicator

BB_Sqz_sBar_mtf_sw

iATRiStdDev
Bollinger Squeeze Basic
Indicator

Bollinger Squeeze Basic

iATRiMomentumiStdDev

This indicator identifies market compression by comparing momentum deviations against ATR-adjusted standard deviation thresholds to detect potential explosive breakouts.

Bollinger Squeeze v3
Indicator

Bollinger Squeeze v3

iATRiMomentumiMAiStdDev
Bollinger Squeeze v4
Indicator

Bollinger Squeeze v4

iATRiMAiStdDev

This indicator identifies potential volatility breakouts by measuring the ratio between Bollinger Band deviations and ATR-based fluctuations while tracking linear regression momentum shifts.

Bollinger Squeeze v4_001
Indicator

Bollinger Squeeze v4_001

iATRiMAiStdDev

This indicator identifies potential market breakouts by measuring the compression of price action using a ratio of Standard Deviation to Average True Range, overlaid with Linear Regression momentum histograms.

Bollinger Squeeze v4_v1
Indicator

Bollinger Squeeze v4_v1

iATRiMAiStdDev
Indicator

Bollinger Squeeze v5

iCCIiATRiStdDev
Bollinger Squeeze v6
Indicator

Bollinger Squeeze v6

iCCIiATRiRSIiStochastic

This indicator identifies potential explosive price movements by detecting periods of low volatility relative to historical averages and filtering them against momentum oscillators like CCI, RSI, or Stochastic.

Bollinger Squeeze v7
Indicator

Bollinger Squeeze v7

iCCIiATRiRSIiStochastic

This indicator identifies high-probability breakout points by filtering momentum oscillators through a normalized ratio of standard deviation against Average True Range to detect price squeezes.

Bollinger Squeeze v8
Indicator

Bollinger Squeeze v8

iCCIiATRiRSIiStochastic

This indicator detects low-volatility environments by comparing Bollinger Band width against ATR-derived expansion to filter momentum signals from Stochastic, CCI, or RSI oscillators.

Bollinger Squeeze
Indicator

Bollinger Squeeze

iATRiMAiStdDev

This indicator identifies trend shifts by correlating Linear Regression Momentum values with an ATR-based Bollinger Band squeeze ratio to pinpoint volatility breakouts.

Bollinger_SqueezeX
Indicator

Bollinger_SqueezeX

iATRiMAiStdDev

This indicator identifies periods of low market volatility by comparing standard deviation to ATR, while utilizing a custom linear regression formula to map price momentum trends.

BolliToucher_001
Indicator

BolliToucher_001

iMAiStdDev