basevolatility
Download script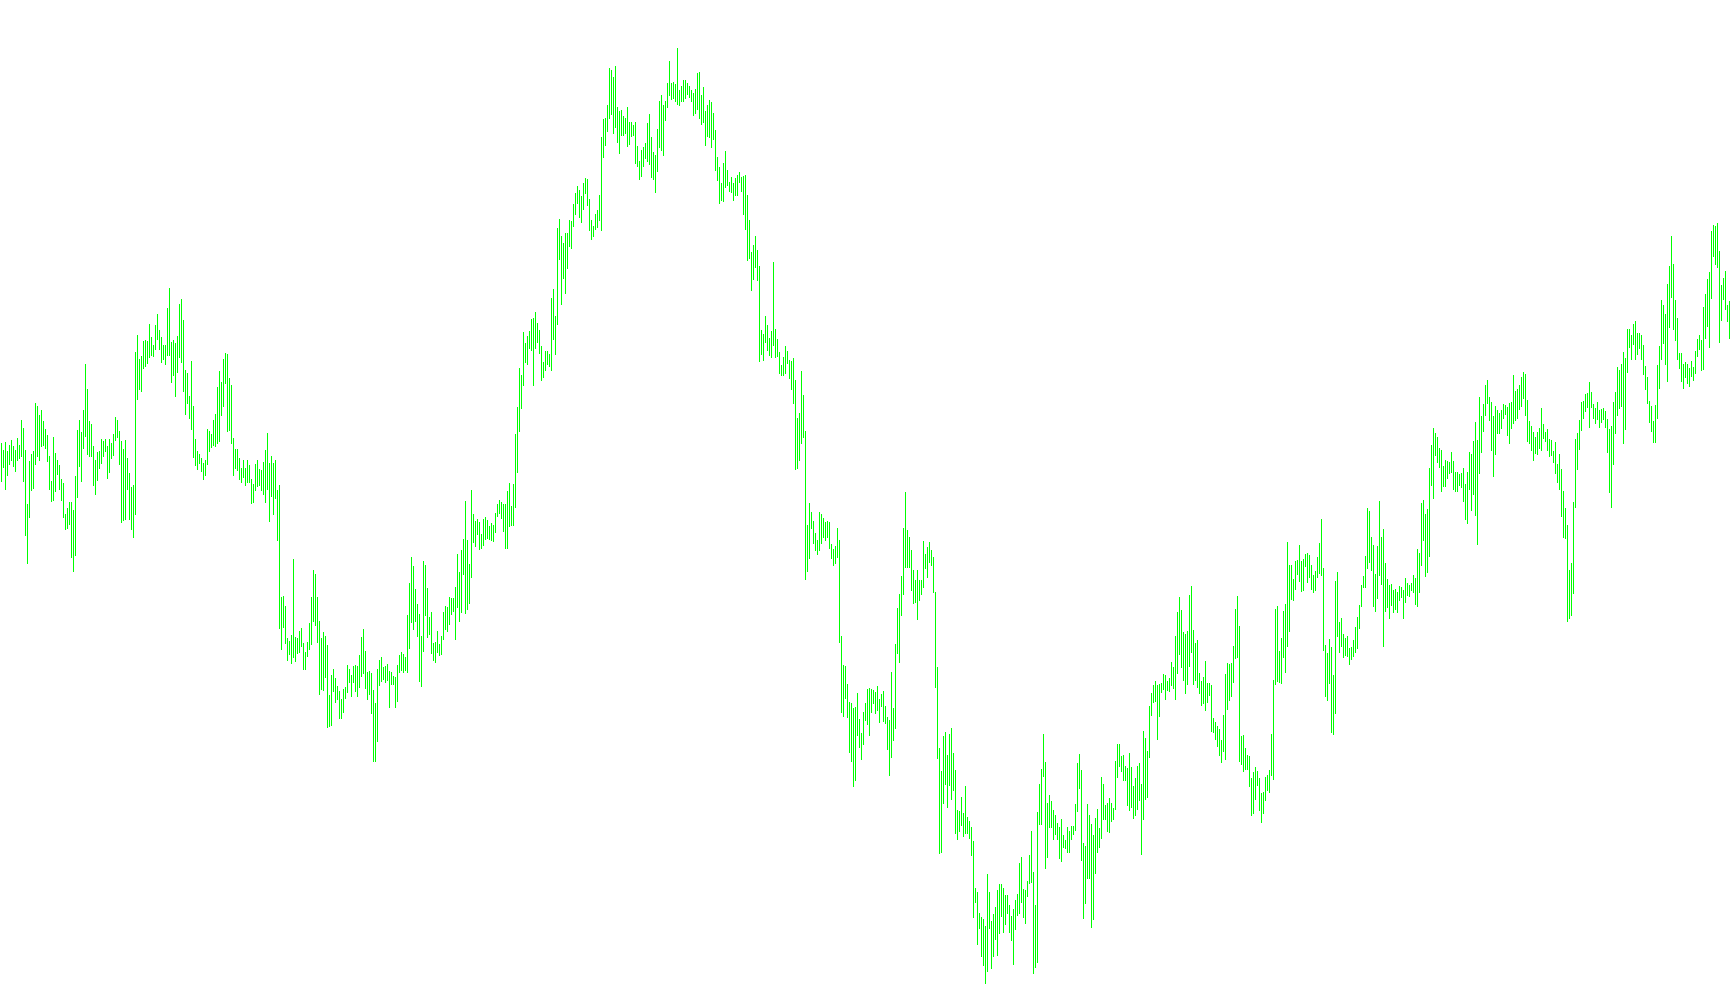
The BaseVolatility indicator is designed to provide a visual representation of market activity by measuring price fluctuations over time. Rather than simply looking at the direction of the price, this tool focuses on how "nervous" or stable the market is, helping traders identify periods of high and low volatility.
Core Logic & Mechanics
The script operates through a two-stage calculation process to smooth out market noise and provide a reliable trend line:
1. Measuring Short-Term Deviation The first step involves looking at a small window of recent price data (defined by the "Fast Period"). It calculates the standard deviation—a statistical measure of how much prices are moving away from their average. By focusing on this smaller timeframe, the script captures immediate market reactions and sudden spikes in activity.
2. Smoothing for Long-Term Trends To prevent the indicator from being too erratic or "jumpy," the results from the first step are then fed into a second calculation. The script takes these short-term deviations and averages them over a much larger window (the "Slow Period"). This creates a smoothed trend line that represents the underlying volatility of the market.
Key Features
- Smoothing Technique: The tool utilizes a specific Moving Average method (Smooth Moving Average) to ensure that the resulting line flows naturally across the chart, making it easier for the human eye to spot significant shifts in momentum without being distracted by minor price flickers.
- Dynamic Responsiveness: By allowing users to adjust the "Fast" and "Slow" periods, the indicator can be tuned to be more sensitive to rapid changes or more stable for long-term analysis.
- Visual Output: The final result is displayed as a distinct line in a separate window below the main price chart. When the line rises, it indicates that market volatility is increasing; when it falls, it suggests the market is stabilizing.
Summary for the Trader
Think of this indicator as a "heart rate monitor" for the financial market. It filters out the insignificant "noise" of minor price ticks to show you the true pulse of the market's energy. It helps you see whether the current environment is characterized by calm, steady movement or high-intensity price swings.
//+------------------------------------------------------------------+
//|                                               BaseVolatility.mq4 |
//|                                           Copyright 2015, fxborg |
//|                                   http://fxborg-labo.hateblo.jp/ |
//+------------------------------------------------------------------+
#property copyright "Copyright 2015, fxborg"
#property link      "http://fxborg-labo.hateblo.jp/"
#property version   "1.00"
#property strict
#property indicator_separate_window
#property indicator_buffers 1
#property indicator_type1 DRAW_LINE
#property indicator_color1 DarkTurquoise
#property indicator_width1 2
//--- input parameters
input int      InpFastPeriod=10; //  Fast Period
input int      InpSlowPeriod=70; //  Slow Period
input ENUM_MA_METHOD InpMaMethod=MODE_SMMA; // Ma Method
//---
int   CalcPeriod=2*(InpSlowPeriod+InpFastPeriod);
//---
int min_rates_total;
//--- indicator buffers
double StdDevBuffer[];
double MainBuffer[];
//+------------------------------------------------------------------+
//| Custom indicator initialization function                         |
//+------------------------------------------------------------------+
int OnInit()
  {
//--- indicator buffers mapping
//---- Initialization of variables of data calculation starting point
   min_rates_total=1+InpFastPeriod+1+InpSlowPeriod+1;
//--- indicator buffers mapping
   IndicatorBuffers(4);
//--- indicator buffers
   SetIndexBuffer(0,MainBuffer);
   SetIndexBuffer(1,StdDevBuffer);
//---
   SetIndexEmptyValue(0,EMPTY_VALUE);
   SetIndexEmptyValue(1,EMPTY_VALUE);
   SetIndexDrawBegin(0,min_rates_total);
   SetIndexDrawBegin(1,min_rates_total);
//---
   string short_name="BaseVolatility ("+IntegerToString(InpSlowPeriod)+","+IntegerToString(InpFastPeriod)+")";
   IndicatorShortName(short_name);
//---
   return(INIT_SUCCEEDED);
  }
//+------------------------------------------------------------------+
//| Custom indicator iteration function                              |
//+------------------------------------------------------------------+
int OnCalculate(const int rates_total,
                const int prev_calculated,
                const datetime &time[],
                const double &open[],
                const double &high[],
                const double &low[],
                const double &close[],
                const long &tick_volume[],
                const long &volume[],
                const int &spread[])
  {
//---
   int i,j,first;
//--- check for bars count
   if(rates_total<=min_rates_total)
      return(0);
//---
   MathSrand(int(TimeLocal()));
//--- indicator buffers
   ArraySetAsSeries(StdDevBuffer,false);
   ArraySetAsSeries(MainBuffer,false);
//--- rate data
//+----------------------------------------------------+
//|Set High Low Buffeer                                |
//+----------------------------------------------------+
   first=InpFastPeriod+1-1;
   if(first+1<prev_calculated)
      first=prev_calculated-2;
   else
   for(i=0; i<first; i++)
         StdDevBuffer[i]=EMPTY_VALUE;
//---
   for(i=first; i<rates_total-1 && !IsStopped(); i++)
     {
      if(!random(20) && rates_total-i>CalcPeriod && StdDevBuffer[i]!=EMPTY_VALUE) continue;
      StdDevBuffer[i]=iStdDev(Symbol(),PERIOD_CURRENT,InpFastPeriod,0,InpMaMethod,PRICE_CLOSE,rates_total-i);
     }
//+----------------------------------------------------+
//| Set MA Buffeer                                     |
//+----------------------------------------------------+
   first=InpFastPeriod+1+InpSlowPeriod-1+1;
   if(first+1<prev_calculated)
      first=prev_calculated-2;
   else
   for(i=0; i<first; i++)
         MainBuffer[i]=EMPTY_VALUE;
//--- ma cycle
   for(i=first; i<rates_total-1 && !IsStopped(); i++)
     {
      double sd=0.0;
      for(j=(i-InpSlowPeriod+1);j<=i;j++)
         sd+=StdDevBuffer[j];
      //--- Ma Buffer
      MainBuffer[i]=sd/InpSlowPeriod;
     }
//--- return value of prev_calculated for next call
   return(rates_total);
  }
//+----------------------------------------------------+
//| random func                                        |
//+----------------------------------------------------+
bool random(int x)
  {
   int ran=MathRand();
   bool res=(MathMod(ran,x)==0);
   return(res);
  }
//+------------------------------------------------------------------+
Comments