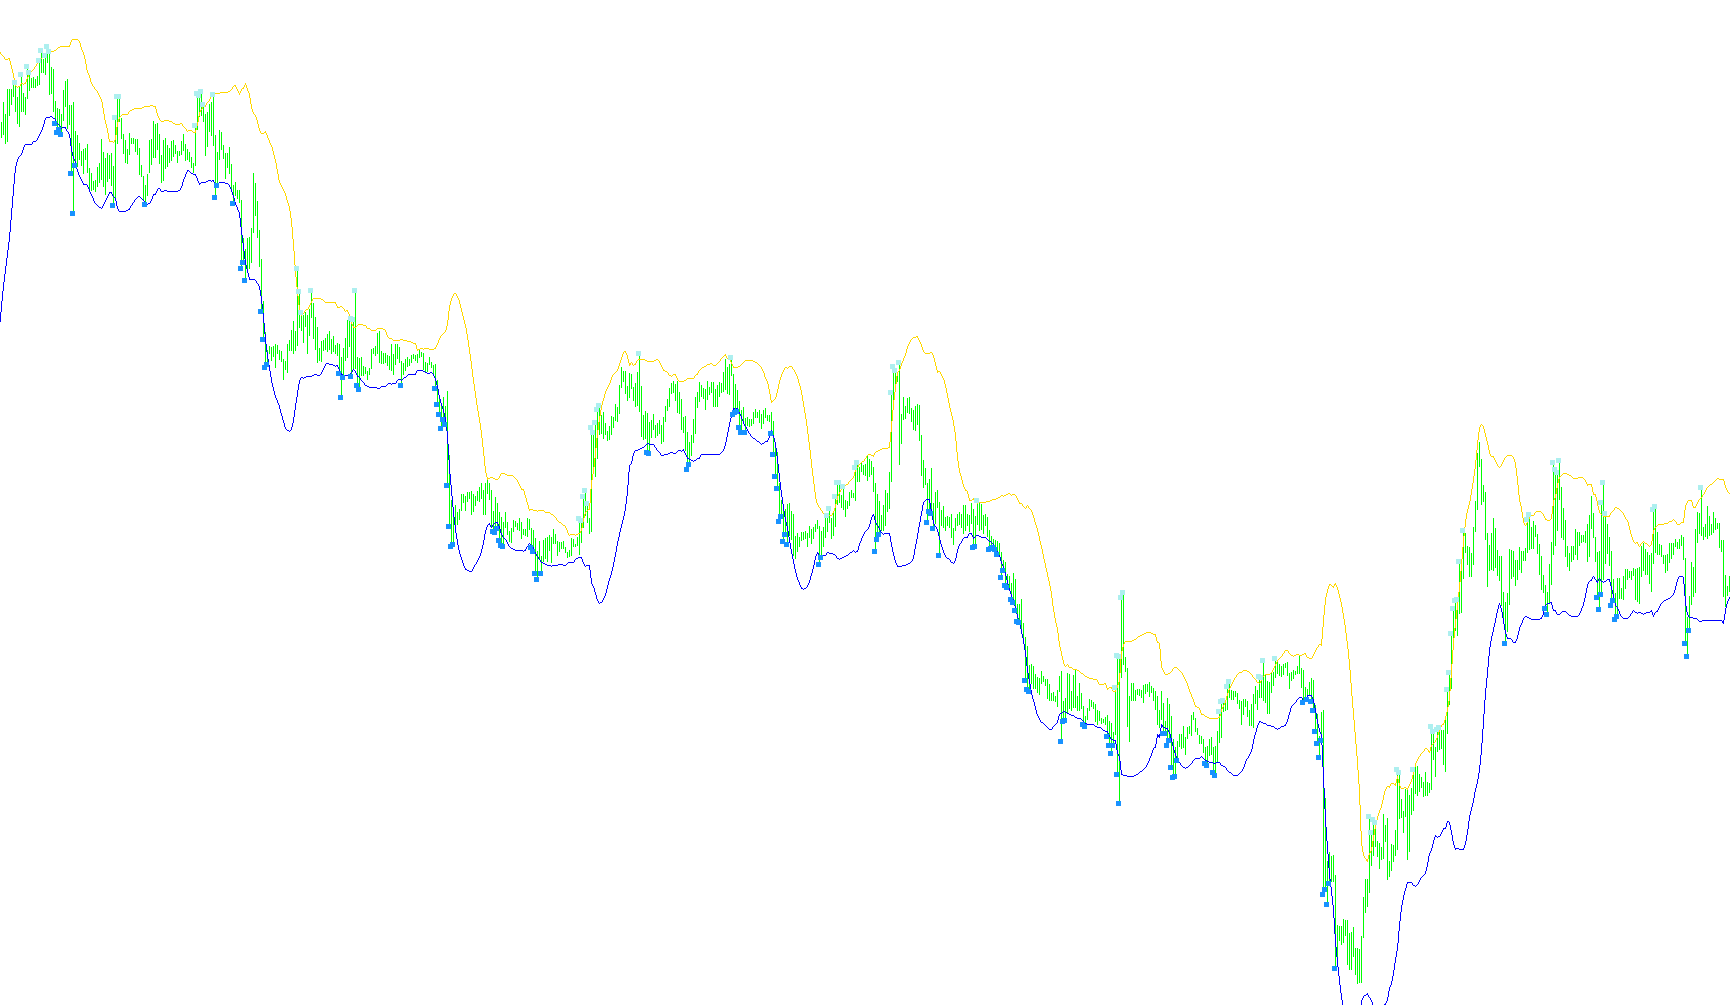
BolliToucher_002
Indicator

BolliToucher_002

iMAiStdDev

This indicator identifies 'Gimmee Bar' patterns based on price touching Bollinger Bands and closing in the opposite direction, marking potential entry points and triggering alerts on new bar formations when configured.

Brooky_Trend_Strength
Indicator

Brooky_Trend_Strength

iATRiMAiMAOnArrayiStdDev

This indicator quantifies market trend intensity by calculating the differential between Standard Deviation and Average True Range, filtered through price action sensitivity and moving average directionality.

CCISqueeze
Indicator

CCISqueeze

iATRiMAiStdDev

This indicator identifies market compression by measuring the ratio between Bollinger Band width and Keltner Channel range, overlaid with a Commodity Channel Index (CCI) momentum histogram.

cci_on_stepchannel
Indicator

cci_on_stepchannel

iStdDev
Center of Gravity 1
Indicator

Center of Gravity 1

iStdDev

This indicator utilizes a Gauss elimination matrix to perform high-order polynomial regression, mapping the underlying price curve and calculating dynamic variance bands for structural trend analysis.

Center of Gravity
Indicator

Center of Gravity

iStdDev
Center of GravityTrl
Indicator

Center of GravityTrl

iStdDev
Center of Gravity_v3
Indicator

Center of Gravity_v3

iStdDev
CenterofGravityalerttoughprice2
Indicator

CenterofGravityalerttoughprice2

iStdDev
Center_Of_Gravity
Indicator

Center_Of_Gravity

iStdDev
Indicator

CentreOfGravityV2

iStdDev
CheckMarkPattern_AD
Indicator

CheckMarkPattern_AD

iMACDiMomentumiRVIiRSI

This indicator identifies bullish and bearish patterns by detecting inverse price-to-oscillator extremums across multiple technical metrics.

CK_Speed
Indicator

CK_Speed

iATRiRSIOnArrayiStdDev
CMA
Indicator

CMA

iMAiStdDev
COG THV
Indicator

COG THV

iStdDev

This indicator utilizes a Gauss elimination matrix to solve for polynomial coefficients, projecting price trends and calculating multi-layered standard deviation envelopes based on regression variance.

COG
Indicator

COG

iStdDev

This indicator calculates a dynamic non-linear price path using polynomial regression coefficients and generates multi-layered volatility bands based on weighted standard deviation.

Damiani_volatmeter
Indicator

Damiani_volatmeter

iATRiStdDev

This indicator identifies high-intensity market movements by calculating the ratio between short-term and long-term Average True Ranges while filtering for signal-to-noise thresholds.

Damiani_volatmeter2.i
Indicator

Damiani_volatmeter2.i

iATRiStdDev
Damiani_volatmeterNoInputs
Indicator

Damiani_volatmeterNoInputs

iATRiStdDev
Damiani_volatmeter_v1
Indicator

Damiani_volatmeter_v1

iATRiStdDev
Damiani_volatmeter_v2
Indicator

Damiani_volatmeter_v2

iATRiStdDev
Damiani_volatmeter_v3
Indicator

Damiani_volatmeter_v3

iATRiStdDev
Damiani_Volt
Indicator

Damiani_Volt

iATRiStdDev
Damiani_Volt_v1
Indicator

Damiani_Volt_v1

iATRiStdDev
dex_2Trales_V1
Indicator

dex_2Trales_V1

iATRiStdDev
dex_SCALP
Indicator

dex_SCALP

iStdDev
divergencepetr_s7
Indicator

divergencepetr_s7

iADiACiATRiADX
divergenceviewer_ad
Indicator

divergenceviewer_ad

iMACDiMomentumiRVIiRSI

This indicator identifies and classifies complex price-momentum discrepancies by synchronizing market extremums with multiple technical oscillators, including William %R, RSI, MACD, and custom inputs.

Indicator

Divergence_Petr

iADiACiATRiADX
Doda-Trend
Indicator

Doda-Trend

iATRiStdDev

The logic identifies market regimes by comparing current Average True Range (ATR) against the Exponential Moving Average of Standard Deviation to distinguish between consolidation and momentum.

Donchian%20Channels%20plus%20SD%20borders
Indicator

Donchian%20Channels%20plus%20SD%20borders

iStdDev
Flat
Indicator

Flat

iStdDev

This indicator calculates a normalized percentage based on the standard deviation of price movements relative to local high and low volatility extremes.

Flat_v1
Indicator

Flat_v1

iStdDev
Flat_v2
Indicator

Flat_v2

iStdDev
Indicator

FN Diver Osc

iMAiMAOnArrayiStdDev
FN Signal
Indicator

FN Signal

iMAiMAOnArrayiStdDev
FN Signal_v2
Indicator

FN Signal_v2

iMAiMAOnArrayiStdDev
FNCD
Indicator

FNCD

iMAiMAOnArrayiStdDev
FN_Signal
Indicator

FN_Signal

iMAiMAOnArrayiStdDev
Indicator

Hamyar-V2

iACiATRiMAiStdDev
HVR test
Indicator

HVR test

iStdDev
Indicator

i-CAi

iMAiStdDev
Indicator

i-CAi_v1

iMAiStdDev
Ind-GG01M
Indicator

Ind-GG01M

iBandsiMAiSARiStdDev

Identifies trend reversals by synchronizing smoothed moving average crossovers with Parabolic SAR filters and expanding Bollinger Band volatility thresholds.

Ind-GG01M1
Indicator

Ind-GG01M1

iBandsiMAiSARiStdDev
Ind-GG01M_sw
Indicator

Ind-GG01M_sw

iBandsiMAiSARiStdDev

This indicator identifies high-probability reversal points by synchronizing Parabolic SAR trend breaks with expanding Bollinger Band dynamics and smoothed moving average deviations.

Ind-StDev-AVG
Indicator

Ind-StDev-AVG

iStdDev
Index_pair_Dev_v1
Indicator

Index_pair_Dev_v1

iMAOnArrayiMAiRSIOnArrayiStdDev

This indicator calculates synthetic currency strength indices using geometric means of standard deviations and moving averages across multiple forex pairs, subsequently applying a smoothed RSI filter to identify momentum.

i_DCG_ModStDev
Indicator

i_DCG_ModStDev

iMAOnArrayiStdDev
i_DCG_ModStDev_v1
Indicator

i_DCG_ModStDev_v1

iMAOnArrayiStdDev