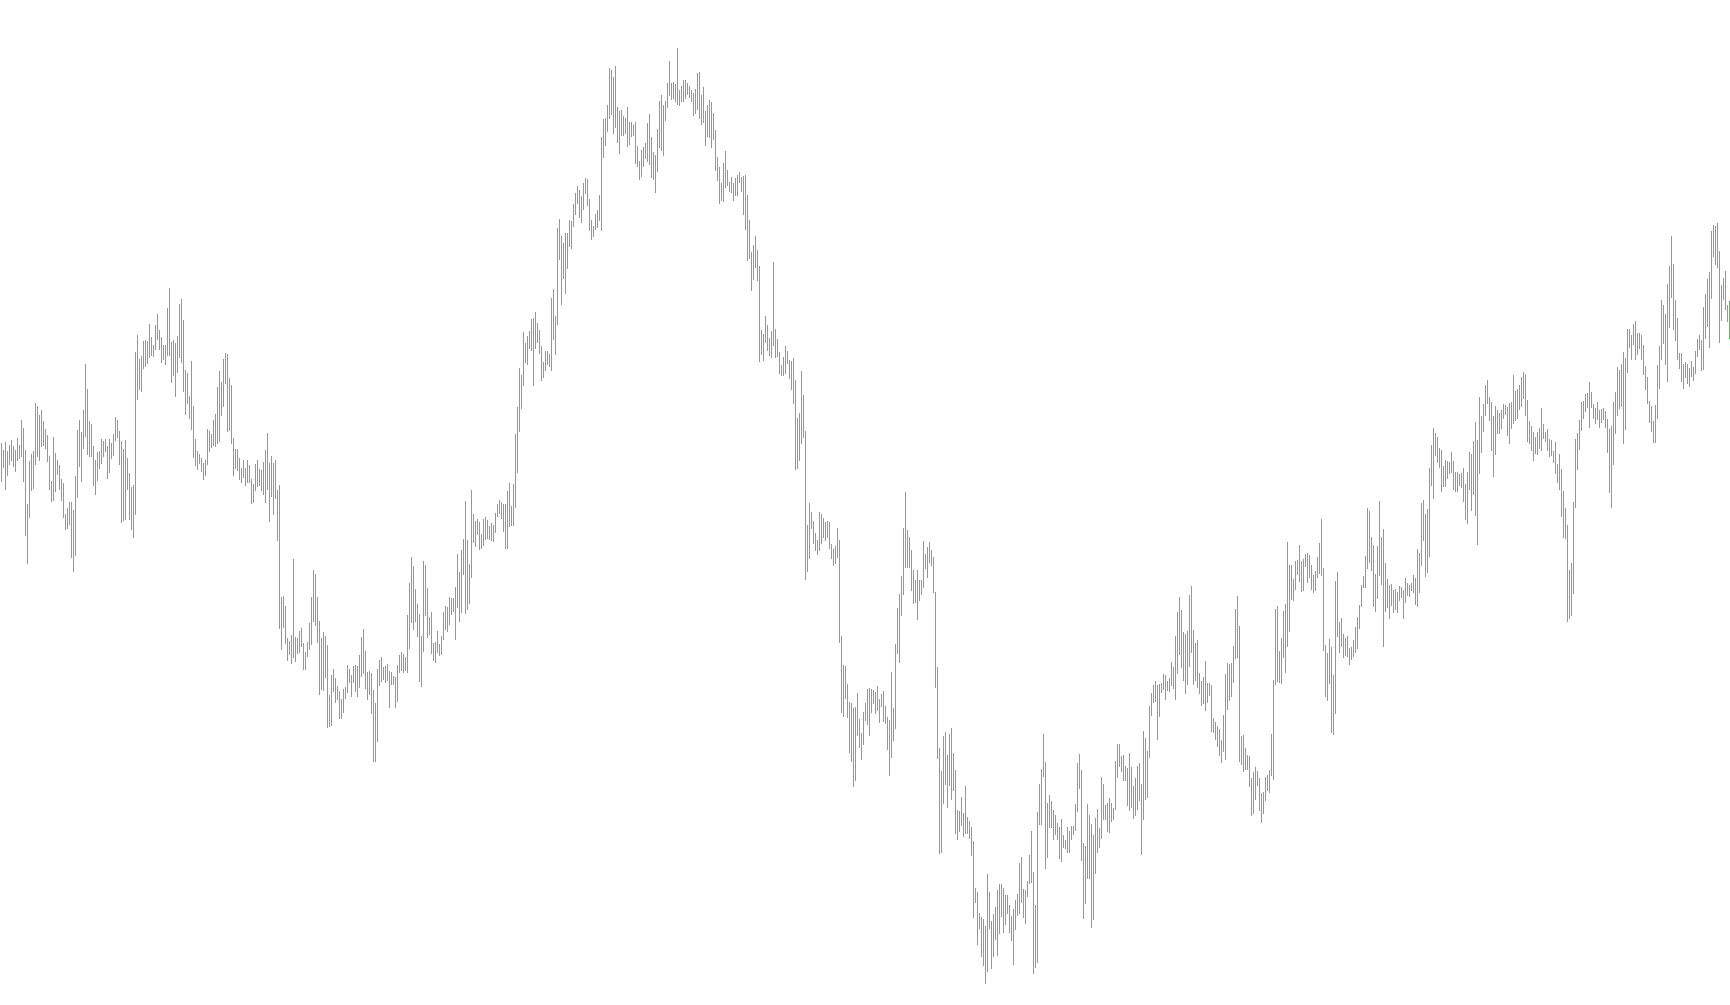
This custom technical indicator is designed to provide traders with a visual representation of market momentum and volatility by combining several well-known trading concepts into a single display. Instead of looking at multiple complex charts, this tool summarizes price action into a streamlined movement profile.
Core Functionality
The logic operates through three distinct layers of analysis:
1. Momentum Tracking (Moving Average of an Oscillator) At its foundation, the script calculates a "Moving Average of an Oscillator" (OsMA). Rather than just looking at the raw price of an asset, it examines the relationship between different moving averages to determine the strength and direction of the current trend.
2. Directional Visualization To make this momentum easier to read at a glance, the script separates the data into two distinct movements:
- Upward Momentum: When the oscillator is rising compared to the previous period, it is displayed as an upward-moving histogram.
- Downward Momentum: When the oscillator is falling, it is displayed as a separate downward-moving histogram.
- Neutrality: If there is no significant change between periods, the indicator remains neutral. This allows traders to quickly see if the market is gaining steam, losing power, or moving sideways.
3. Volatility Filtering The script also performs a sophisticated "background" calculation to monitor market volatility. It compares the standard deviation (how much the price swings) against the Average True Range (the typical size of a price move).
By calculating a ratio between these two types of volatility, the indicator creates a filtering mechanism. While the primary visual focus is on the momentum histograms, this logic provides an underlying framework to help distinguish between stable market trends and erratic, high-volatility spikes.
Summary for Traders
Essentially, this tool acts as a "trend thermometer." It smooths out the noise of constant price fluctuations to show you the true direction of the move. By separating upward and downward momentum into clear visual bars, it helps you identify who is currently in control of the market while simultaneously factoring in volatility to ensure the movement is significant enough to be meaningful.
//+------------------------------------------------------------------+
//|                                                    BbSq-OsMA.mq4 |
//|                                         Copyright © 2011, Remyn. |
//|                                                                  |
//+------------------------------------------------------------------+
#property  copyright "Copyright © 2011, Remyn."
#property  link      "http://codebase.mql4.com/"
//---- indicator settings
#property  indicator_separate_window
#property  indicator_buffers 4
#property indicator_color1 SteelBlue
#property indicator_color2 MediumBlue
//#property indicator_color3 Blue
#property indicator_color4 Lime
//---- indicator parameters
extern int       bolPrd=20;
extern double    bolDev=2.0;
extern int       keltPrd=10;
extern double    keltFactor=1.2;

extern int FastEMA=12;
extern int SlowEMA=26;
extern int SignalSMA=9;
extern int Histo=2;

//---- indicator buffers
double     upOsMA[];
double     downOsMA[];
double     OsmaBuffer[];
double     upK[];
//+------------------------------------------------------------------+
//| Custom indicator initialization function                         |
//+------------------------------------------------------------------+
int init()
  {
//---- 2 additional buffers are used for counting.
   IndicatorBuffers(4);
//---- drawing settings
   SetIndexStyle(0, DRAW_HISTOGRAM, STYLE_SOLID, Histo);
   SetIndexStyle(1, DRAW_HISTOGRAM, STYLE_SOLID, Histo);
   SetIndexDrawBegin(0,SignalSMA);
   IndicatorDigits(Digits+2);
//---- 3 indicator buffers mapping
   SetIndexBuffer(0,upOsMA);
   SetIndexBuffer(1,downOsMA);
   SetIndexBuffer(2,OsmaBuffer);
   SetIndexStyle(3,DRAW_ARROW,EMPTY);
   SetIndexBuffer(3,upK);
   SetIndexEmptyValue(3,EMPTY_VALUE);
   SetIndexArrow(3,159);
//---- name for DataWindow and indicator subwindow label
   IndicatorShortName("OsMA("+FastEMA+","+SlowEMA+","+SignalSMA+")");
//---- initialization done
   return(0);
  }
//+------------------------------------------------------------------+
//| Moving Average of Oscillator                                     |
//+------------------------------------------------------------------+
int start()
  {
   int limit;
   int counted_bars=IndicatorCounted();
   double diff,d, std,bbs;
//---- last counted bar will be recounted
   if(counted_bars>0) counted_bars--;
   limit=Bars-counted_bars;
//---- macd counted in the 1-st additional buffer
   for(int i=0; i<limit; i++)
   OsmaBuffer[i] = iOsMA(NULL, 0, FastEMA, SlowEMA, SignalSMA, PRICE_CLOSE, i);
//+------------------------------------------------------------------+
   for(i=0; i<limit; i++)
     {
       if (OsmaBuffer[i] > OsmaBuffer[i+1])
     {
      upOsMA[i] = OsmaBuffer[i];
      downOsMA[i] = 0;
     }
   else
       if(OsmaBuffer[i] < OsmaBuffer[i+1])
         {
           downOsMA[i] = OsmaBuffer[i];
           upOsMA[i] = 0;
         }
   else
     {
       upOsMA[i] = 0;
       downOsMA[i] = 0;
     }
		diff = iATR(NULL,0,keltPrd,i)*keltFactor;
		std = iStdDev(NULL,0,bolPrd,MODE_SMA,0,PRICE_CLOSE,i);
		bbs = bolDev * std / diff;
      if(bbs<1) {
         upK[i]=0;
      } else {
         upK[i]=EMPTY_VALUE;
      }
      }
//---- done
   return(0);
  }
//+------------------------------------------------------------------+
Comments