Linear_Price_BarM_mtf
Download script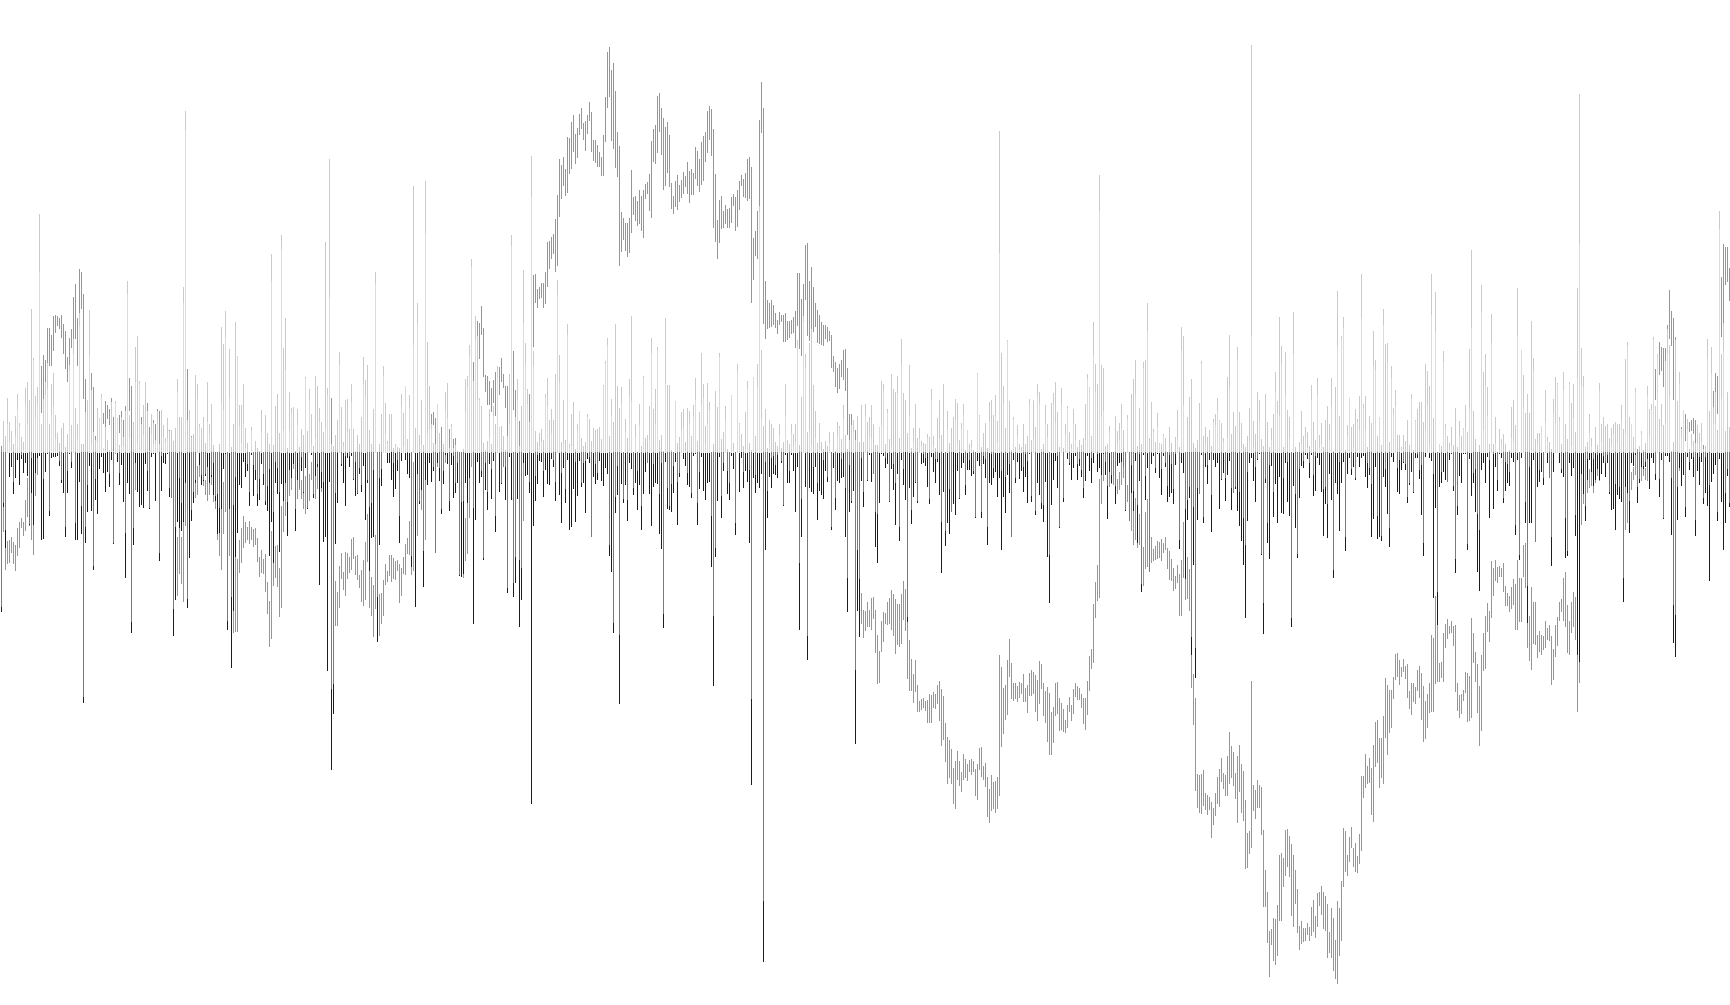
The Linear Price Bar indicator is designed to provide a visual representation of price movement by analyzing specific historical timeframes and translating raw market data into easy-to-read visual components. Instead of just looking at a standard price chart, this tool processes data to highlight the relationship between opening prices and subsequent movements.
Core Functionality
The script works by scanning through a specified number of bars on your chart to calculate how much the price has moved relative to the "Open" price of a specific timeframe. It creates a visual map that separates different types of price action into four distinct components:
- Price Range Metrics: The logic calculates the distance between the opening price and the highest point reached (the upper bound), as well as the distance between the opening price and the lowest point reached (the lower bound).
- Movement Tracking: It identifies whether a price bar closed higher or lower than it opened. This allows the indicator to differentiate between "Bullish" (upward) movement and "Bearish" (downward) movement.
Visual Logic
The indicator populates a separate window with four different visual elements (histograms), which categorize the market data as follows:
- Upper Expansion: Represents the distance from the open to the high.
- Lower Expansion: Represents the distance from the open to the low.
- Positive Momentum: If a price bar closes higher than its opening price, this component captures that specific upward movement value.
- Negative Momentum: If a price bar closes lower than its opening price, this component captures that specific downward movement value.
Key Features for the User
- Multi-Timeframe Analysis: You can set the indicator to monitor specific timeframes (such as M1, H1, D1, etc.). This allows you to see higher-level market trends even while viewing a smaller, more detailed chart.
- Customizable Depth: The script includes a "Max Bars" limit, which ensures the platform remains responsive by only processing a set amount of historical data at one time.
- Visual Distinction: By using different colors and widths for the various bars (such as DeepSkyBlue, OrangeRed, and others), the indicator makes it easy to distinguish between pure volatility (the range) and actual directional results (the close).
In summary, this tool transforms standard price candles into a "linear" format that highlights how far the price traveled from its starting point versus where it ultimately finished.
//+------------------------------------------------------------------+
//|                                             Linear Price Bar.mq4 |
//|                                      Copyright © 2006, Keris2112 |
//| 2008txtsd ki                                                none |
//+------------------------------------------------------------------+
#property copyright "Copyright © 2006, Keris2112"
#property link      "none"

#property indicator_separate_window
#property indicator_buffers 4
#property indicator_color1 DeepSkyBlue
#property indicator_color2 OrangeRed
#property indicator_color3 DodgerBlue
#property indicator_color4 Red

#property indicator_width1 1
#property indicator_width2 1
#property indicator_width3 4
#property indicator_width4 4


#property indicator_level1  15
#property indicator_level2 -15
#property indicator_levelcolor DarkSlateBlue
//---- buffers

extern int TimeFrame = 0;
extern int MaxBarsToCount   = 1500;

extern string note_timeFrames = "M1;5,15,30,60H1;240H4;1440D1;10080W1;43200MN";


double ExtMapBuffer1[];
double ExtMapBuffer2[];
double ExtMapBuffer3[];
double ExtMapBuffer4[];

//+------------------------------------------------------------------+
//| Custom indicator initialization function                         |
//+------------------------------------------------------------------+
int init()
  {
//---- indicators
   SetIndexStyle(0,DRAW_HISTOGRAM);
   SetIndexBuffer(0,ExtMapBuffer1);
   SetIndexStyle(1,DRAW_HISTOGRAM);
   SetIndexBuffer(1,ExtMapBuffer2);
   SetIndexStyle(2,DRAW_HISTOGRAM);
   SetIndexBuffer(2,ExtMapBuffer3);
   SetIndexStyle(3,DRAW_HISTOGRAM);
   SetIndexBuffer(3,ExtMapBuffer4);

    switch(TimeFrame)
    {
      case 1 : string TimeFrameStr= "M1";  break;
      case 5 : TimeFrameStr=        "M5";  break;
      case 15 : TimeFrameStr=       "M15"; break;
      case 30 : TimeFrameStr=       "M30"; break;
      case 60 : TimeFrameStr=       "H1";  break;
      case 240 : TimeFrameStr=      "H4";  break;
      case 1440 : TimeFrameStr=     "D1";  break;
      case 10080 : TimeFrameStr=    "W1";  break;
      case 43200 : TimeFrameStr=    "MN1"; break;
      default : TimeFrameStr=    "CurrTF";
    }


     IndicatorShortName("LPB ["+TimeFrameStr+"]");
    if (TimeFrame<Period()) TimeFrame=Period();


//----
   return(0);
  }
//+------------------------------------------------------------------+
//| Custor indicator deinitialization function                       |
//+------------------------------------------------------------------+
int deinit()
  {

   return(0);
  }
//+------------------------------------------------------------------+
//| Custom indicator iteration function                              |
//+------------------------------------------------------------------+
int start()
  {
   int UpDays, DownDays, NeutralDays;
   double BarH, BarL, BarC;
   double open, close, high, low;

   datetime TimeArray[];
   int    i,limit,y=0,counted_bars=IndicatorCounted();

   ArrayCopySeries(TimeArray,MODE_TIME,Symbol(),TimeFrame);
   limit= Bars-counted_bars;
   limit= MathMax(limit,TimeFrame/Period());
   limit= MathMin(limit,MaxBarsToCount);

   for(i=0,y=0;i<limit;i++)
   {
   if (Time[i]<TimeArray[y]) y++;

      open  = iOpen (NULL,TimeFrame,y);
      close = iClose(NULL,TimeFrame,y);
      high  = iHigh (NULL,TimeFrame,y);
      low   = iLow  (NULL,TimeFrame,y);


      BarH = (high-open)/Point;
      BarL = (low-open)/Point;
      BarC = (close-open)/Point;
      if(BarC>0) UpDays += 1;
         else if(BarC<0) DownDays +=1;
         else if(BarC==0) NeutralDays +=1;


      ExtMapBuffer1[i] = BarH;
      ExtMapBuffer2[i] = BarL;
//      SortBuffer1[i] = BarH;
//      SortBuffer2[i] = BarL;
      if(close>open)
         {
         ExtMapBuffer3[i] = BarC;
         ExtMapBuffer4[i] = 0;
         }
         else
         {
         ExtMapBuffer3[i] = 0;
         ExtMapBuffer4[i] = BarC;
         }

      }

//----
   return(0);
  }

//+------------------------------------------------------------------+
Comments