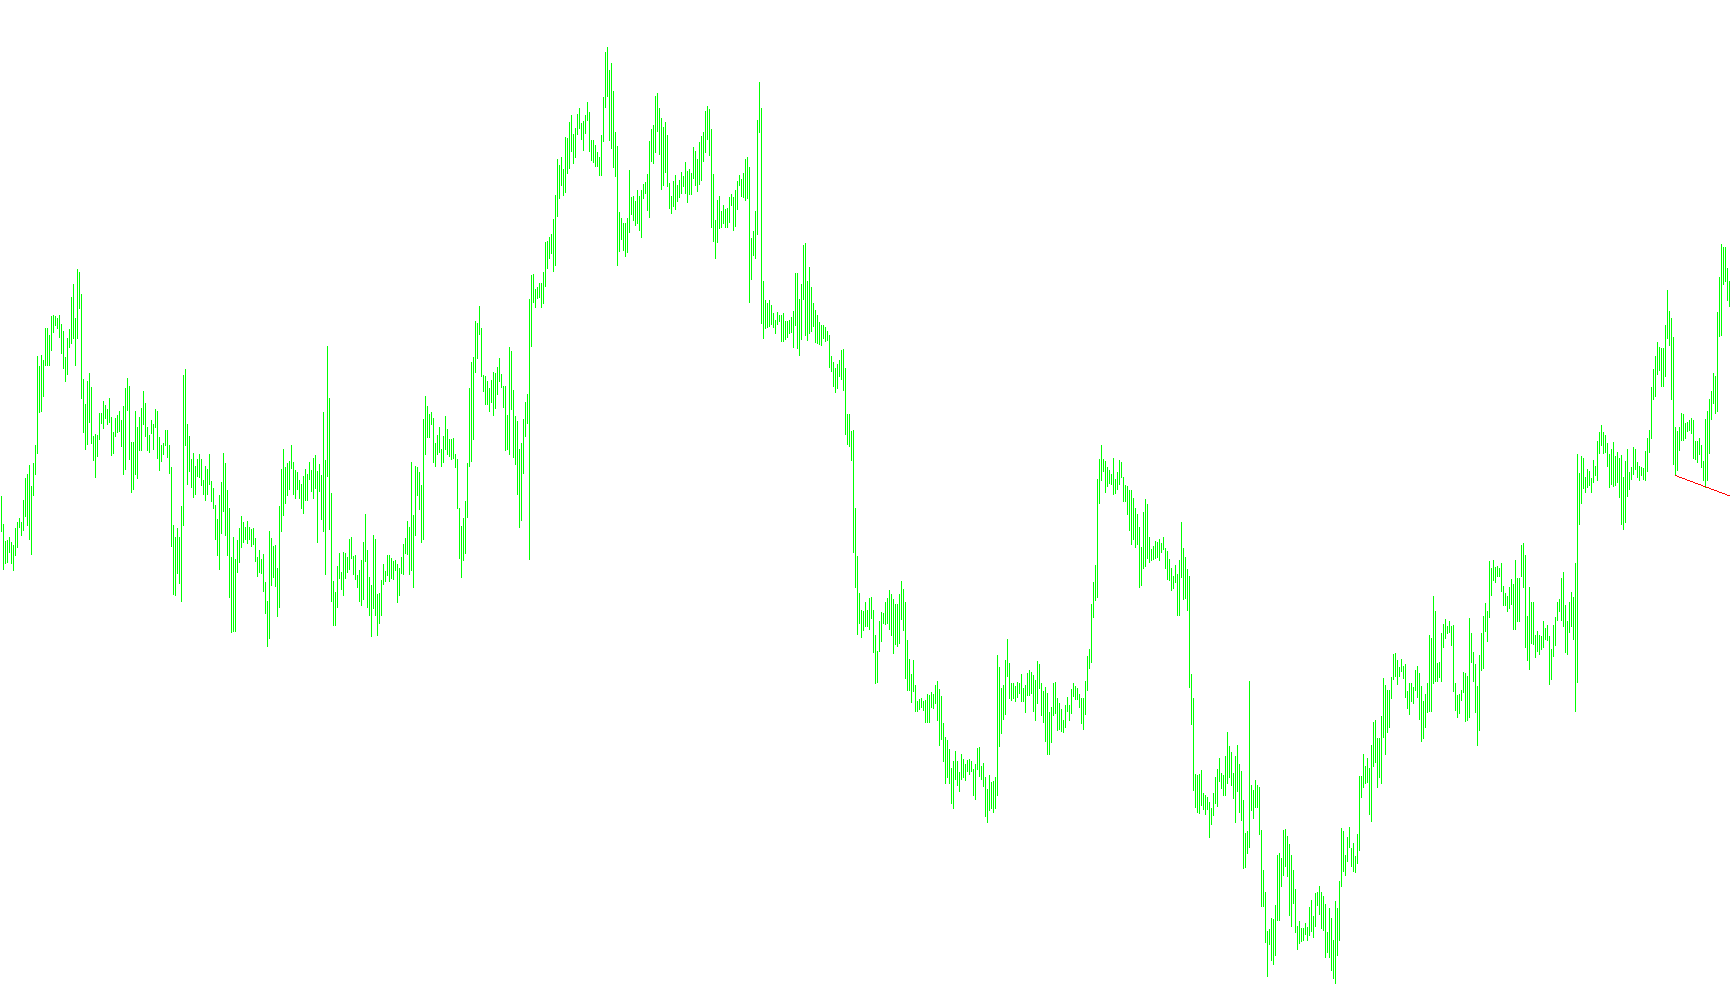
This technical tool is designed to automatically identify and visualize specific price patterns on your trading chart to help pinpoint potential support levels. By utilizing the "Fractals" methodology, the script scans recent historical price action to detect significant structural lows.
How the Logic Works
The core functionality of this script revolves around a dynamic search process. Instead of simply drawing a static line, the tool performs the following steps automatically:
- Automated Pattern Detection: The script continuously monitors the market for "Fractals"—specific price points where the low of a candle is significantly lower than the candles immediately preceding and following it. These points are often viewed by traders as areas where buying interest may emerge.
- Sequential Search: The logic is programmed to look backward through the chart's history. It searches for the two most recent significant "lower" price points. By looking back incrementally, it ensures that it captures the most relevant and current data available on the live feed.
- Dynamic Support Mapping: Once the script identifies these two distinct price points, it automatically draws a trend line connecting them. This creates a visual "support" bridge on your screen.
- Real-Time Updates: The script is designed to refresh its calculations constantly. As new candles form and new price data becomes available, the tool adjusts the position of the support line to reflect the most current fractal points discovered by the system.
Visual Customization
To ensure the tool fits your specific trading setup, the logic allows for several visual adjustments:
- Color and Thickness: You can modify the appearance of the support line to match your chart's aesthetic.
- Line Style: The script allows you to choose between solid, dashed, or dotted lines.
- Extension (Ray): You can toggle a setting to decide whether the support line should project infinitely into the future (as a "ray") or remain fixed between the two identified points.
In summary, this tool automates the tedious task of identifying historical price lows and connecting them into a visual guide, allowing you to see potential support zones clearly at a glance.
//+------------------------------------------------------------------+
//|                                                     LineFrakDown.mq4 |
//|                                                     Yuriy Tokman |
//|                                            yuriytokman@gmail.com |
//|                                             mod by Darkkiller    |
//+------------------------------------------------------------------+
#property copyright "Yuriy Tokman"
#property link      "yuriytokman@gmail.com"


#property indicator_chart_window


extern color Color = Red;
extern int Width = 1;
extern int Style = 0;
extern bool Ray = True;
//+------------------------------------------------------------------+
//| Custom indicator initialization function                         |
//+------------------------------------------------------------------+
int init()
  {
//---- indicators
    ObjectCreate("Saport", OBJ_TREND, 0,0,0,0,0);//ñîçäàíèå òðåíäîâîé ëèíèè
//----
   return(0);
  }
//+------------------------------------------------------------------+
//| Custom indicator deinitialization function                       |
//+------------------------------------------------------------------+
int deinit()
  {
//----
  ObjectDelete("Saport");//óäàëåíèå îáåêòà
//----
   return(0);
  }
//+------------------------------------------------------------------+
//| Custom indicator iteration function                              |
//+------------------------------------------------------------------+
int start()
  {

//----
  double F1=0, F3=0, F13;    // íîìåðà ôðàêòàëîâ
  int    B1, B3, SR=2;               // íîìåðà áàðîâ

  while(F3==0)                       //ïîèñê ôðàêòàëîâ
  {
    F13=iFractals(NULL,0,MODE_LOWER,SR);
    if (F13!=0)
    {
      if      (F1==0){B1=SR; F1=F13;}
      else if (F3==0){B3=SR; F3=F13;}
    }
    SR++;
  }
    ObjectSet("Saport", OBJPROP_TIME1 ,iTime(NULL,0,B3));
    ObjectSet("Saport", OBJPROP_TIME2 ,iTime(NULL,0,B1));
    ObjectSet("Saport", OBJPROP_PRICE1,iLow(NULL,0,B3));
    ObjectSet("Saport", OBJPROP_PRICE2,iLow(NULL,0,B1));
    ObjectSet("Saport", OBJPROP_RAY,Ray);
    ObjectSet("Saport", OBJPROP_COLOR,Color);
    ObjectSet("Saport", OBJPROP_WIDTH,Width);
    ObjectSet("Saport", OBJPROP_STYLE,Style);

//----
   return(0);
  }
//+------------------------------------------------------------------+
Comments