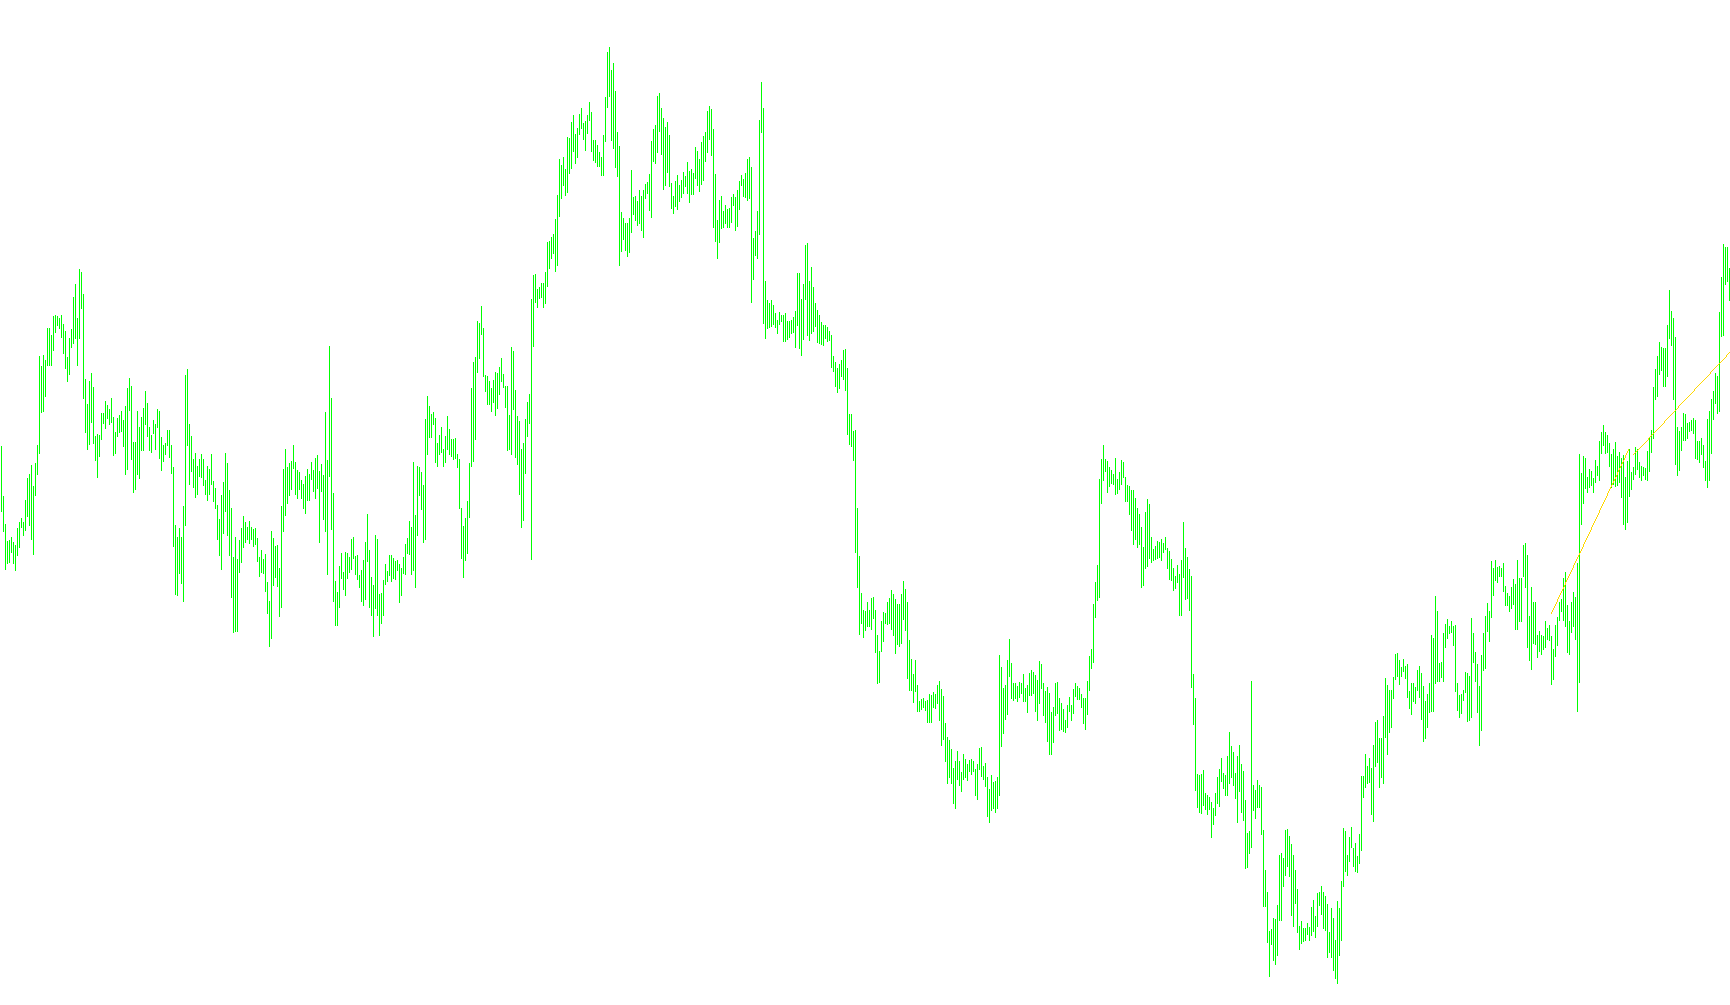
This tool is designed to provide a visual representation of the prevailing price trend by calculating and plotting a Linear Regression line directly on your trading chart. Instead of just showing where the price has been, it acts as a mathematical "best-fit" line that smooths out market noise to reveal the underlying direction of the asset.
How the Logic Works
The script operates by analyzing a specific window of recent market history, which you can customize (the default setting looks back at the last 50 bars). Here is the step-by-step breakdown of its logic:
- Data Collection: The tool identifies the closing prices for every candle within your chosen timeframe. It looks at these prices as a series of coordinates to understand how the market has moved over that specific period.
- Mathematical Modeling: It applies a statistical formula to calculate the "line of best fit." Rather than connecting dots (like a standard trend line), it calculates a trajectory that minimizes the distance between the actual price points and the resulting line. This identifies the mathematical equilibrium of the price action.
- Trend Calculation: The script solves for two primary variables:
- The Slope: This determines the angle and direction of the trend (whether the price is moving up, down, or sideways).
- The Intercept: This establishes the starting point of the line to ensure it aligns correctly with the current market values.
- Visual Output: Once the calculation is complete, the tool draws a smooth gold line on your chart. This line represents the "fair value" trend of the recent price history.
Key Purpose for Traders
By using this indicator, you can distinguish between temporary price fluctuations (noise) and the broader momentum of the market. Because it is based on regression analysis, it provides a more objective view of the trend than a simple moving average, helping you see where the price "should" be according to its recent historical path.
//////////////////////////////////////////////////////////////////////
//
//                                                LinearRegression.mq4
//                                       Copyright © 2008 Antonuk Oleg
//
//////////////////////////////////////////////////////////////////////
#property copyright "Copyright © 2008 Antonuk Oleg"
#property link      "antonukoleg@gmail.com"
#property indicator_chart_window

#property indicator_buffers 1
#property indicator_width1 1
#property indicator_color1 Gold

extern int barsToCount=50;

double buffer0[];

//////////////////////////////////////////////////////////////////////
int init()
{
   IndicatorShortName("linearRegression");
   SetIndexStyle(0,DRAW_LINE);
   SetIndexBuffer(0,buffer0);
   SetIndexEmptyValue(0,0.0);
   return(0);
}

//////////////////////////////////////////////////////////////////////
int deinit()
{
   return(0);
}

//////////////////////////////////////////////////////////////////////
int start()
{
   // calculate price values
   double a,b,c,
          sumy=0.0,
          sumx=0.0,
          sumxy=0.0,
          sumx2=0.0;

   for(int i=0; i<barsToCount; i++)
   {
      sumy+=Close[i];
      sumxy+=Close[i]*i;
      sumx+=i;
      sumx2+=i*i;
   }

   c=sumx2*barsToCount-sumx*sumx;

   if(c==0.0)
   {
      Alert("LinearRegression error: can\'t resolve equation");
      return;
   }

   b=(sumxy*barsToCount-sumx*sumy)/c;
   a=(sumy-sumx*b)/barsToCount;

   // drawing Linear regression trendline in indicator buffer
   for(int x=0;x<barsToCount;x++)
      buffer0[x]=a+b*x;

   // clear last bar
   buffer0[x]=0.0;

   return(0);
}
Comments