LinearRegSlope_v1_v1
Download script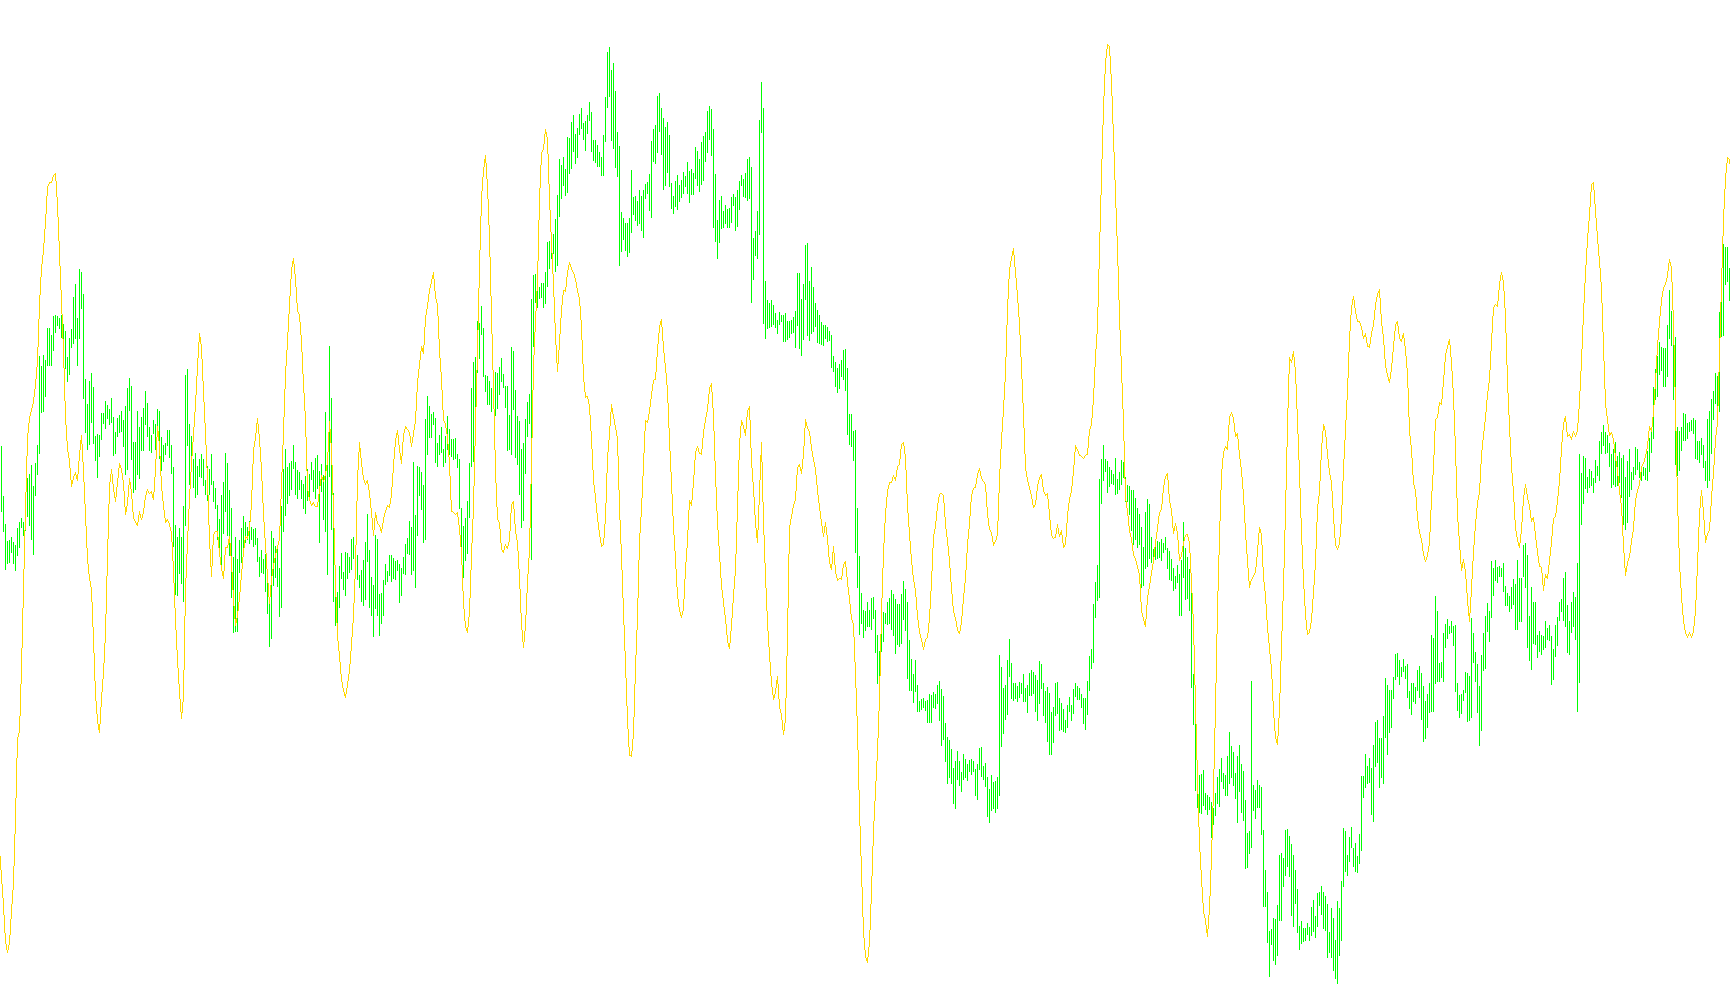
This tool is designed to help traders visualize the momentum and direction of a market's price movement by calculating a "Linear Regression Slope." Instead of simply looking at where the price is currently sitting, this script analyzes the trend over a specific period of time to determine how steeply that trend is rising or falling.
How the Logic Works
1. Data Selection and Timeframe The indicator begins by looking at a user-defined "Length" (the number of past candles or bars) and a specific price type (such as the Closing price, High, or Low). By focusing on these parameters, the tool creates a consistent window of data to analyze.
2. The Mathematical Foundation (Linear Regression) The script uses a mathematical method called Linear Regression. Imagine drawing a straight line through a series of scattered data points (price movements) so that it passes as close as possible to all of them. This is often referred to as the "line of best fit."
3. Calculating the Slope Once the tool identifies this "best fit" line for your chosen period, it calculates the slope. In simple terms:
- Positive Slope: If the line points upward, the indicator shows positive momentum. The higher the value, the steeper the upward trend.
- Negative Slope: If the line points downward, the indicator shows negative momentum. The lower the value, the steeper the downward trend.
- Flat Slope: If the line is horizontal, it suggests the market is moving sideways or consolidating without a clear directional bias.
4. Visual Output The results are displayed in a separate window below the main price chart as a smooth line (Sky Blue). Because it calculates the slope based on a specific period, it filters out some of the "noise" of minor price fluctuations, allowing traders to see the underlying direction of the trend more clearly.
Summary for the User
Rather than just telling you what the price is, this indicator tells you where the price is headed based on its recent path. It transforms complex price history into a single, readable line that represents the speed and strength of the current market trend.
//+------------------------------------------------------------------+
//|                                            LinearRegSlope_v1.mq4 |
//|                                Copyright © 2006, TrendLaboratory |
//|            http://finance.groups.yahoo.com/group/TrendLaboratory |
//|                                   E-mail: igorad2003@yahoo.co.uk |
//+------------------------------------------------------------------+
#property copyright "Copyright © 2006, TrendLaboratory"
#property link      "http://finance.groups.yahoo.com/group/TrendLaboratory"
//----
#property indicator_separate_window
#property indicator_buffers 1
#property indicator_color1 SkyBlue
#property indicator_width1 2
//---- input parameters
extern int     Price         =0;   //Apply to Price(0-Close;1-Open;2-High;3-Low;4-Median price;5-Typical price;6-Weighted Close)
extern int     Length        =14;  //Period of NonLagMA
//---- indicator buffers
double RegSlope[];
//+------------------------------------------------------------------+
//| Custom indicator initialization function                         |
//+------------------------------------------------------------------+
  int init()
  {
   SetIndexStyle(0,DRAW_LINE);
   SetIndexBuffer(0,RegSlope);
   string short_name;
//---- indicator line
   IndicatorDigits(MarketInfo(Symbol(),MODE_DIGITS));
//---- name for DataWindow and indicator subwindow label
   short_name="LinearRegSlope("+Length+")";
   IndicatorShortName(short_name);
   SetIndexLabel(0,"LinearRegSlope");
   SetIndexDrawBegin(0,Length);
//----
   return(0);
  }
//+------------------------------------------------------------------+
//| LinearRegSlope_v1                                                |
//+------------------------------------------------------------------+
int start()
  {
   int    i,shift, counted_bars=IndicatorCounted(),limit;
   double price;
   if(counted_bars > 0) limit=Bars-counted_bars;
   if(counted_bars < 0) return(0);
   if(counted_bars ==0) limit=Bars-Length-1;
   if(counted_bars < 1)
      for(i=1;i<Length;i++) RegSlope[Bars-i]=0;
   double SumBars=Length * (Length - 1) * 0.5;
   double SumSqrBars=(Length - 1.0) * Length * (2.0 * Length - 1.0)/6.0;
   for(shift=limit;shift>=0;shift--)
     {
      double Sum1=0;
      for(i=0;i<=Length-1;i++) Sum1+=i*iMA(NULL,0,1,0,1,Price,i+shift);
      double SumY=0;
      for(i=0;i<=Length-1;i++) SumY+=iMA(NULL,0,1,0,1,Price,i+shift);
      double Sum2=SumBars * SumY;
      double Num1=Length * Sum1 - Sum2;
      double Num2=SumBars * SumBars - Length * SumSqrBars;
      if(Num2!=0)
         RegSlope[shift]=100*Num1/Num2;
      else
         RegSlope[shift]=0;
     }
//----
   return(0);
  }
//+------------------------------------------------------------------+
Comments