Linear Regression Line_v2
Download script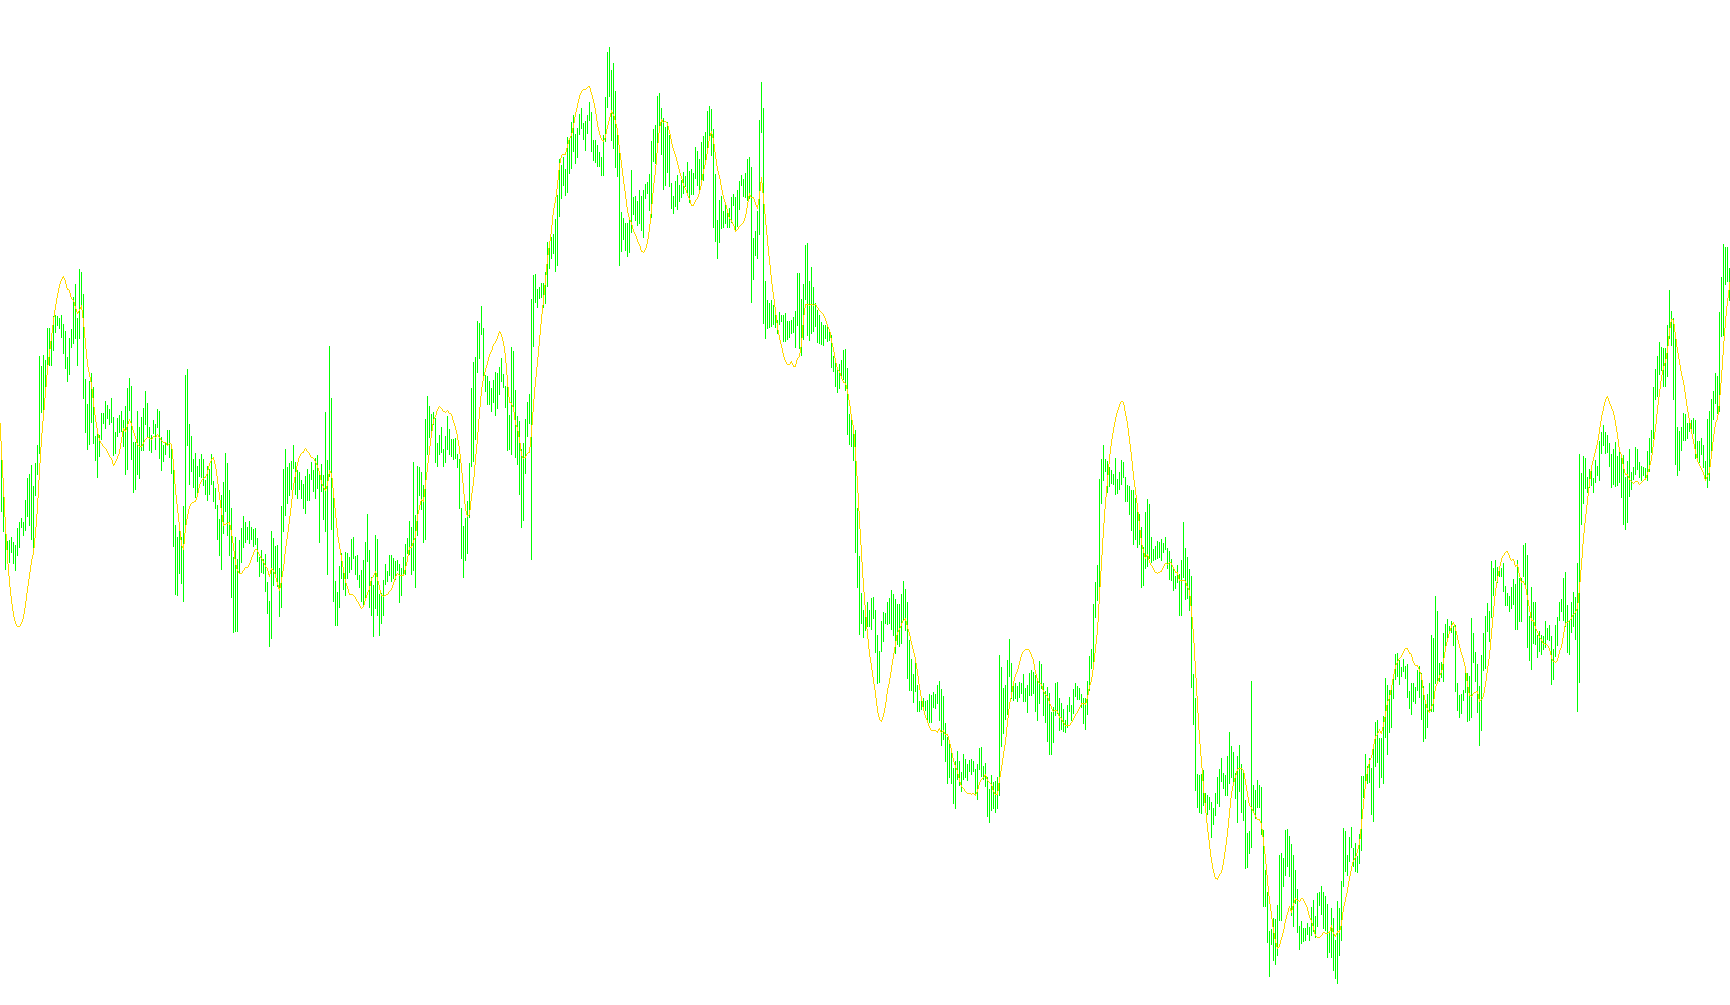
This tool is designed to provide a visual guide for traders by identifying the underlying trend of price movements over a specific period. It functions by calculating a "Linear Regression Line," which is essentially a mathematical way of finding the "best-fit" straight line through a series of historical price points.
How the Logic Works
1. Defining the Observation Window The script begins by looking at a specific number of previous bars (the "Period"). Instead of reacting to every tiny fluctuation in the market, it focuses on a set block of time to determine the general direction of the price.
2. Data Collection and Averaging For every point on your chart, the script looks back at the closing prices within that defined period. It performs a series of background calculations where it sums up these prices and weighs them against their position in time. This allows the tool to distinguish between temporary "noise" (minor price spikes) and the actual path the market is taking.
3. Calculating the Trend Angle (Slope) The script determines the "slope" of the movement. It calculates how much the price tends to rise or fall on average for every new unit of time. By calculating this consistently across the entire period, it establishes whether the current momentum is upward, downward, or flat.
4. Pinpointing the Starting Point Once the angle of the trend is known, the script calculates the "intercept"—the point where the trend began within that specific window. By combining the starting point with the calculated slope, it creates a continuous, smooth line that represents the most statistically likely path of the price.
Visual Output
The result is a blue line drawn on your chart. This line acts as a baseline for market behavior:
- Trend Identification: It helps you see if the market is currently in a sustained move or simply oscillating.
- Price Relativity: By seeing where the current price sits in relation to this line, you can better understand if the market is "overextended" above the trend or "oversold" below it.
- Smoothing: It filters out the erratic jumps of live trading to show you the "big picture" of the current market cycle.
//+------------------------------------------------------------------+
//|                                       Linear Regression Line.mq4 |
//+------------------------------------------------------------------+
#property copyright "MetaTrader 4"
#property link      "http://metatrader.com"
//---- indicator settings
#property indicator_chart_window
#property indicator_buffers 1
#property indicator_color1 Blue
#property indicator_width1 2
//---- input parameters
extern int LRLPeriod=21;
//---- buffers
double LRLBuffer[];

int shift=0;
int n=0;
double sumx=0, sumy=0, sumxy=0, sumx2=0, sumy2=0;
double m=0, yint=0, r=0;
//+------------------------------------------------------------------+
//| Custom indicator initialization function                         |
//+------------------------------------------------------------------+
int init()
  {
//---- indicators
   SetIndexStyle(0,DRAW_LINE);
   SetIndexBuffer(0,LRLBuffer);
   IndicatorDigits(Digits);
   if(LRLPeriod < 2) LRLPeriod=2;
   IndicatorShortName("Linear Regression Line ("+LRLPeriod+")");
   SetIndexDrawBegin(0,LRLPeriod+2);
   IndicatorDigits(MarketInfo(Symbol(),MODE_DIGITS)+4);
//----
   return(0);
  }
//+------------------------------------------------------------------+
//| Custom indicator deinitialization function                       |
//+------------------------------------------------------------------+
int deinit()
  {
   return(0);
  }
//+------------------------------------------------------------------+
//| Linear Regression Line                                           |
//+------------------------------------------------------------------+
int start()
  {
   int limit;
   int counted_bars=IndicatorCounted();
   if(counted_bars<0) counted_bars=0;
   if(counted_bars>0) counted_bars--;
   limit=Bars-counted_bars;

   for(int shift=limit-1; shift>=0; shift--)
     {
      sumx=0;
      sumy=0;
      sumxy=0;
      sumx2=0;
      sumy2=0;
      for(n=0; n<=LRLPeriod-1; n++)
        {
         sumx=sumx + n;
         sumy=sumy + Close[shift + n];
         sumxy=sumxy + n * Close[shift + n];
         sumx2=sumx2 + n * n;
         sumy2=sumy2 + Close[shift + n] * Close[shift + n];
        }
      m=(LRLPeriod*sumxy-sumx*sumy)/(LRLPeriod*sumx2-sumx*sumx);
      yint=(sumy+m*sumx)/LRLPeriod;
      r=(LRLPeriod*sumxy-sumx*sumy)/MathSqrt((LRLPeriod*sumx2-sumx*sumx)*(LRLPeriod*sumy2-sumy*sumy));
      LRLBuffer[shift]=yint-m*LRLPeriod;
     }
   return(0);
  }
//+------------------------------------------------------------------+
Comments