Linear_Price_Bar_mtf
Download script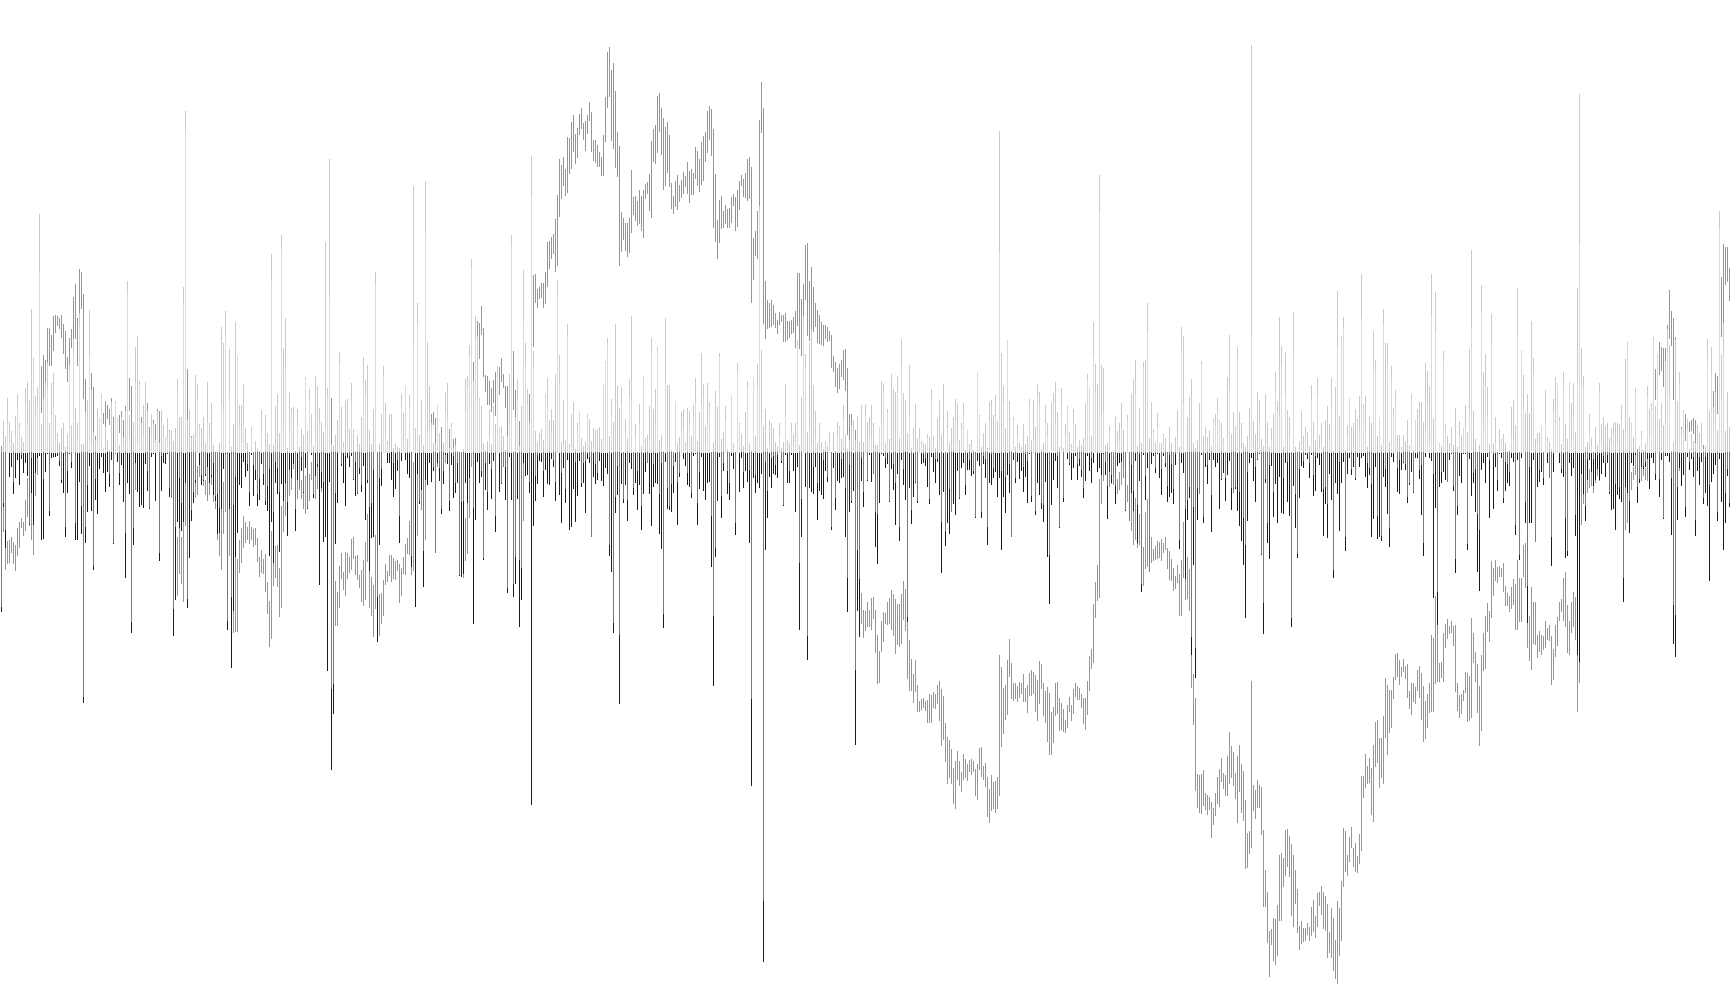
The Linear Price Bar indicator is designed to provide a visual representation of price action by calculating the mathematical relationship between a bar's opening price and its high, low, and closing points. Unlike standard charts that show raw price values, this tool transforms that data into relative movements to help traders visualize market dynamics more clearly.
Core Logic and Functionality
The indicator operates by analyzing specific timeframes (such as Minutes, Hours, Days, or Weeks) and processing a defined amount of historical data to generate the following visuals:
1. Price Range Identification For every period analyzed, the script identifies four key price points: the Open, High, Low, and Close. It then calculates the "Linear" distance of each point relative to the opening price:
- It determines how far the price traveled upward from the start (High minus Open).
- It determines how far the price traveled downward from the start (Low minus Open).
2. Directional Movement Tracking The tool distinguishes between bullish (upward) and bearish (downward) movements to provide a clear visual distinction:
- Positive Movement: If a bar closes higher than it opened, the indicator captures the positive change as an upward metric.
- Negative Movement: If a bar closes lower than it opened, the indicator captures the negative change as a downward metric.
3. Visual Representation (The Histogram) The results of these calculations are displayed in a separate window on your trading platform using a multi-layered histogram:
- Thin Lines: Used to represent the total range of the price movement (the distance between the highest and lowest points reached during that period).
- Thicker Bars: These highlight the actual "body" or result of the price action—specifically, the difference between the opening and closing prices.
Key Features for the User
- Multi-Timeframe Analysis: The script can be configured to look at higher timeframes than what is currently displayed on your main chart, allowing you to see broader market trends while looking at smaller price fluctuations.
- Dynamic Scaling: By calculating everything relative to the "Open" price, the indicator normalizes the data, making it easier to compare the intensity of price movements across different sessions or days regardless of the actual price value.
- Visual Clarity: By separating the total range (extremes) from the actual close (result), the tool helps you quickly see if a market period was volatile (large range) but ultimately resulted in little to no net movement, or if it was a decisive move in one direction.
//+------------------------------------------------------------------+
//|                                             Linear Price Bar.mq4 |
//|                                      Copyright © 2006, Keris2112 |
//| 2008txtsd ki                                                none |
//+------------------------------------------------------------------+
#property copyright "Copyright © 2006, Keris2112"
#property link      "none"

#property indicator_separate_window
#property indicator_buffers 4
#property indicator_color1 Blue
#property indicator_color2 Red
#property indicator_color3 Blue
#property indicator_color4 Red

#property indicator_width1 1
#property indicator_width2 1
#property indicator_width3 4
#property indicator_width4 4

#property indicator_levelcolor SlateBlue
//---- buffers

extern int TimeFrame = 0;
extern int MaxBarsToCount   = 1500;

extern string note_timeFrames = "M1;5,15,30,60H1;240H4;1440D1;10080W1;43200MN";


double ExtMapBuffer1[];
double ExtMapBuffer2[];
double ExtMapBuffer3[];
double ExtMapBuffer4[];

//+------------------------------------------------------------------+
//| Custom indicator initialization function                         |
//+------------------------------------------------------------------+
int init()
  {
//---- indicators
   SetIndexStyle(0,DRAW_HISTOGRAM);
   SetIndexBuffer(0,ExtMapBuffer1);
   SetIndexStyle(1,DRAW_HISTOGRAM);
   SetIndexBuffer(1,ExtMapBuffer2);
   SetIndexStyle(2,DRAW_HISTOGRAM);
   SetIndexBuffer(2,ExtMapBuffer3);
   SetIndexStyle(3,DRAW_HISTOGRAM);
   SetIndexBuffer(3,ExtMapBuffer4);

    switch(TimeFrame)
    {
      case 1 : string TimeFrameStr= "M1";  break;
      case 5 : TimeFrameStr=        "M5";  break;
      case 15 : TimeFrameStr=       "M15"; break;
      case 30 : TimeFrameStr=       "M30"; break;
      case 60 : TimeFrameStr=       "H1";  break;
      case 240 : TimeFrameStr=      "H4";  break;
      case 1440 : TimeFrameStr=     "D1";  break;
      case 10080 : TimeFrameStr=    "W1";  break;
      case 43200 : TimeFrameStr=    "MN1"; break;
      default : TimeFrameStr=    "CurrTF";
    }


     IndicatorShortName("LPB ["+TimeFrameStr+"]");
    if (TimeFrame<Period()) TimeFrame=Period();


//----
   return(0);
  }
//+------------------------------------------------------------------+
//| Custor indicator deinitialization function                       |
//+------------------------------------------------------------------+
int deinit()
  {

   return(0);
  }
//+------------------------------------------------------------------+
//| Custom indicator iteration function                              |
//+------------------------------------------------------------------+
int start()
  {
   int UpDays, DownDays, NeutralDays;
   double BarH, BarL, BarC;
   double open, close, high, low;

   datetime TimeArray[];
   int    i,limit,y=0,counted_bars=IndicatorCounted();

   ArrayCopySeries(TimeArray,MODE_TIME,Symbol(),TimeFrame);
   limit= Bars-counted_bars;
   limit= MathMax(limit,TimeFrame/Period());
   limit= MathMin(limit,MaxBarsToCount);

   for(i=0,y=0;i<limit;i++)
   {
   if (Time[i]<TimeArray[y]) y++;

      open  = iOpen (NULL,TimeFrame,y);
      close = iClose(NULL,TimeFrame,y);
      high  = iHigh (NULL,TimeFrame,y);
      low   = iLow  (NULL,TimeFrame,y);


      BarH = high-open;
      BarL = low-open;
      BarC = close-open;
      if(BarC>0) UpDays += 1;
         else if(BarC<0) DownDays +=1;
         else if(BarC==0) NeutralDays +=1;


      ExtMapBuffer1[i] = BarH;
      ExtMapBuffer2[i] = BarL;
//      SortBuffer1[i] = BarH;
//      SortBuffer2[i] = BarL;
      if(close>open)
         {
         ExtMapBuffer3[i] = BarC;
         ExtMapBuffer4[i] = 0;
         }
         else
         {
         ExtMapBuffer3[i] = 0;
         ExtMapBuffer4[i] = BarC;
         }

      }

//----
   return(0);
  }

//+------------------------------------------------------------------+
Comments