Loco
Download script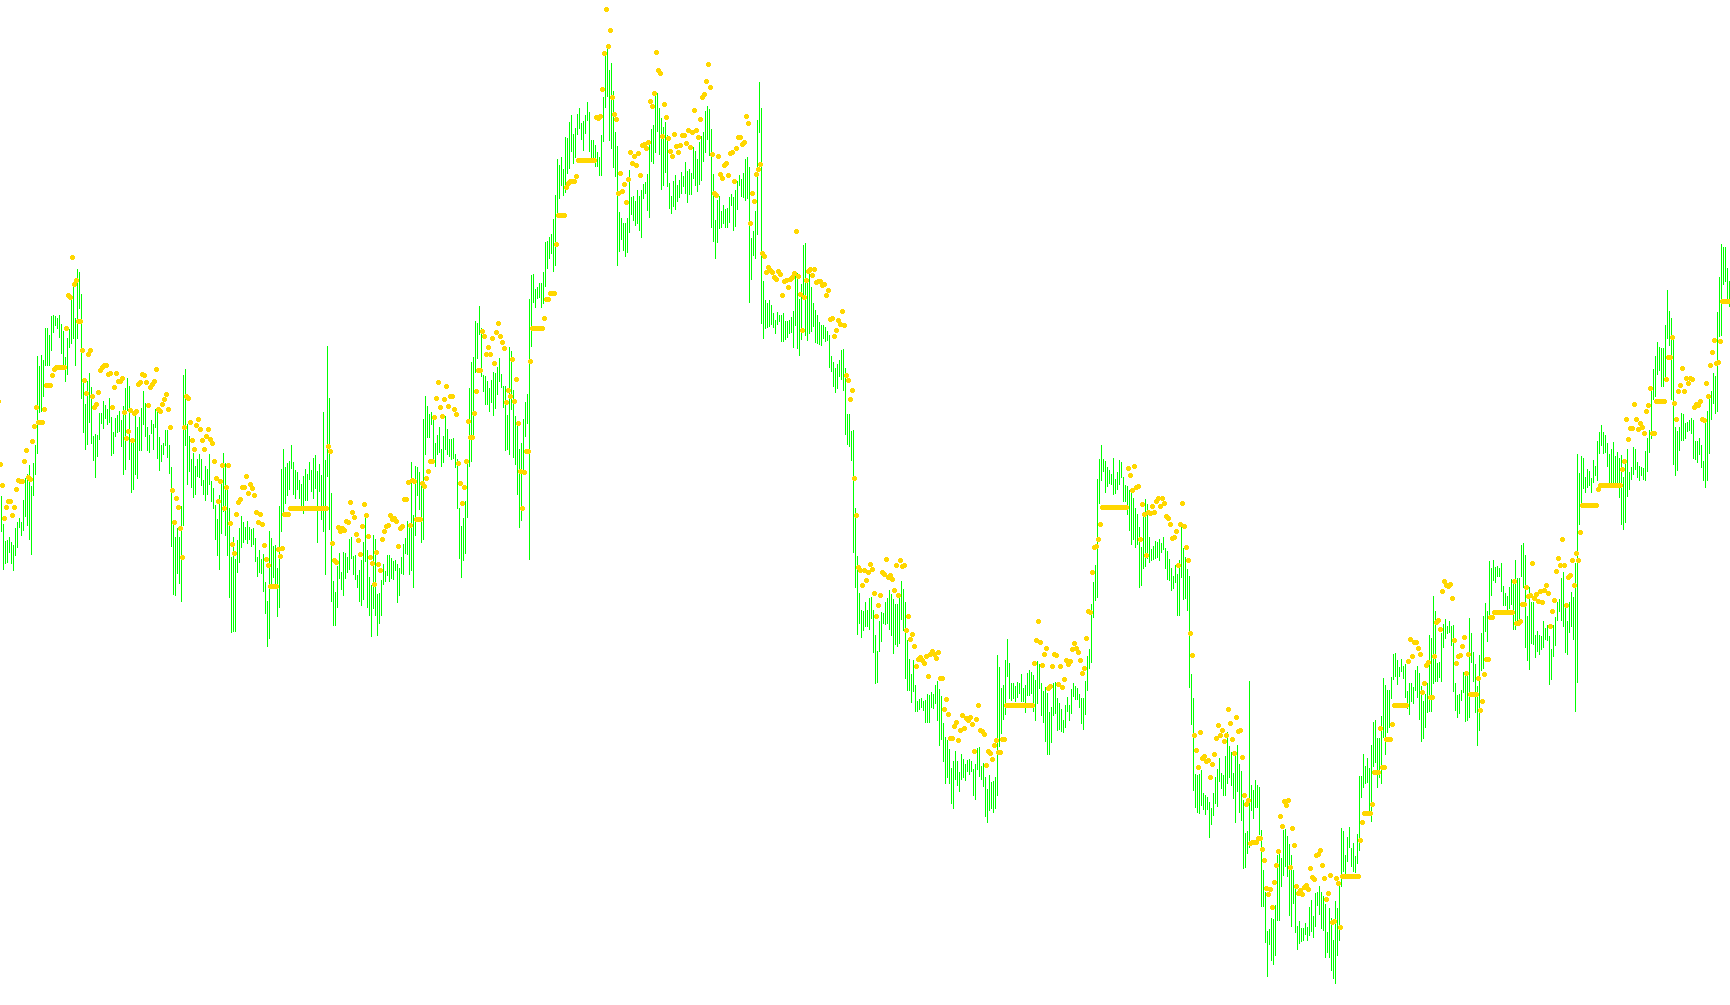
This script functions as a visual tracking tool designed to monitor and map price movement on your trading chart. Its primary goal is to identify specific price "levels" by creating a continuous path that follows the opening price of each candle.
Core Logic Overview
The indicator works by evaluating the relationship between the current price and the price level established immediately before it. Rather than simply plotting the raw price, it applies a logic-based "step" system to determine how the line should behave as new data arrives.
How the Calculation Works
The script follows a set of specific rules to decide where to place its next point:
- Stability: If the current opening price is identical to the previous recorded level, the indicator remains steady at that same price point.
- Upward Momentum: When the price moves upward, the script looks at the direction of the move. If both the current and previous candles are above the established level, it identifies this as a consistent trend and sets the new level slightly below the current price (by a fraction of 0.1%).
- Trend Shifts: If the price moves in a different direction or crosses over the previous level, the script adjusts dynamically. It calculates the new position based on whether the price is currently higher or lower than the previous mark, again applying a very small fractional adjustment to ensure the line remains smooth and continuous.
Visual Representation
On your chart, this logic manifests as a series of red arrows. These markers act as a "trail" that tracks the evolution of price levels over time. By following these marks, you can visually observe how the script perceives shifts in market structure and where it establishes new significant price milestones based on the opening prices of the candles.
//+------------------------------------------------------------------+
//| Loco.mq4                                                         |
//| Copyright © 2005, MetaQuotes Software Corp.                      |
//| http://www.metaquotes.net                                        |
//+------------------------------------------------------------------+
#property copyright "Copyright © 2005, MetaQuotes Software Corp."
#property link "http://www.metaquotes.net"
//----
#property indicator_chart_window
#property indicator_buffers 1
#property indicator_color1 Red
//---- input parameters
extern int strata=1;
//---- buffers
double stratbuffer[];
double prev=0;
double result;
//+------------------------------------------------------------------+
//| Custom indicator initialization function                         |
//+------------------------------------------------------------------+
int init()
  {
//---- indicators
   IndicatorDigits(Digits);
   SetIndexStyle(0,DRAW_ARROW);
   SetIndexArrow(0,159);
   SetIndexBuffer(0,stratbuffer);
//----
   return(0);
  }
//+------------------------------------------------------------------+
//| Custor indicator deinitialization function                       |
//+------------------------------------------------------------------+
int deinit()
  {
//----
//----
   return(0);
  }
//+------------------------------------------------------------------+
//| Custom indicator iteration function                              |
//+------------------------------------------------------------------+
int start()
  {
   int counted_bars=IndicatorCounted();
   int pos=Bars-counted_bars-1;
   while(pos>=0)
     {
      if (Open[pos]==prev)result=prev;
      else
        {
         if (Open[pos+1]>prev && Open[pos]>prev)
           {
            result=MathMax(prev, (Open[pos]*0.999));
           }
         else
           {
            if (Open[pos] > prev){result=(Open[pos]*0.999);}
            else { result=(Open[pos]*(1.001));}
           }
        }
      prev=result;
      stratbuffer[pos]=result;
      pos--;
     }
//----
   return(0);
  }
//+------------------------------------------------------------------+
Comments