Linear%20Regression%20Line
Download script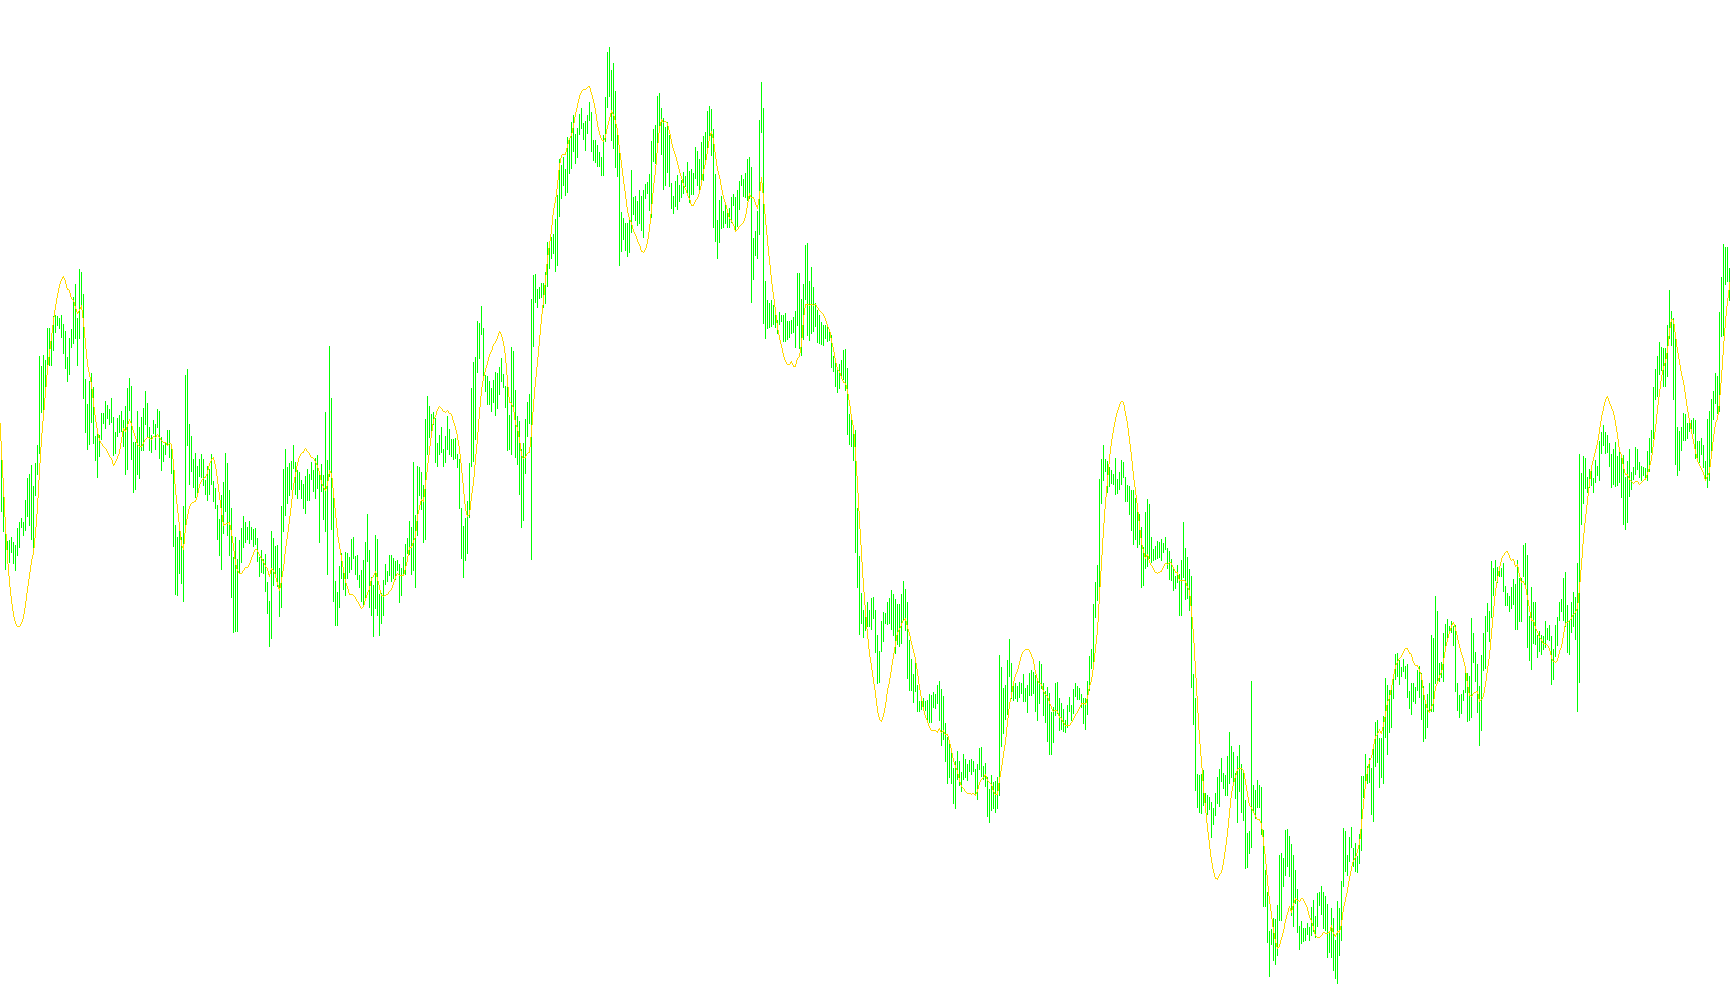
This tool is designed to provide traders with a clearer picture of a market's primary direction by smoothing out daily price fluctuations. Instead of focusing on every minor "zig and zag" of the market, it uses a mathematical method called Linear Regression to identify the underlying trend.
How It Works
The script looks at a specific number of past price points (defined by the period setting) and calculates a "best-fit" straight line through those prices. Think of it like drawing a single straight line through a scattered group of dots; the goal is to find the path that sits as close to all those points as possible.
Key Logic Components
- Trend Identification: By calculating the slope of this line, the tool helps identify whether the price is moving generally upward, downward, or staying flat.
- Data Smoothing: It takes the closing prices over a set timeframe and applies a statistical formula to filter out "noise"—the temporary spikes and dips that can often distract from the bigger picture.
- Dynamic Calculation: The tool constantly updates itself as new price data comes in. It looks back at the specified window of time, performs the calculation, and plots the resulting line on your chart.
What This Means for You
Instead of reacting to every small candle movement, this indicator allows you to see the "momentum" of the market. Because it draws a straight path based on historical averages, it provides a visual guide to help you understand where the price has been heading and where it might be naturally heading next based on current trends.
//+------------------------------------------------------------------+
//|                                       Linear Regression Line.mq4 |
//+------------------------------------------------------------------+
#property copyright "MetaTrader 4"
#property link      "http://metatrader.com"
//---- indicator settings
#property indicator_chart_window
#property indicator_buffers 1
#property indicator_color1 Blue
#property indicator_width1 2
//---- input parameters
extern int LRLPeriod=21;
//---- buffers
double LRLBuffer[];

int shift=0;
int n=0;
double sumx=0, sumy=0, sumxy=0, sumx2=0, sumy2=0;
double m=0, yint=0, r=0;
//+------------------------------------------------------------------+
//| Custom indicator initialization function                         |
//+------------------------------------------------------------------+
int init()
  {
//---- indicators
   SetIndexStyle(0,DRAW_LINE);
   SetIndexBuffer(0,LRLBuffer);
   IndicatorDigits(Digits);
   if(LRLPeriod < 2) LRLPeriod = 2;
   IndicatorShortName("Linear Regression Line ("+LRLPeriod+")");
   SetIndexDrawBegin(0,LRLPeriod+2);
   IndicatorDigits(MarketInfo(Symbol(),MODE_DIGITS)+4);
//----
   return(0);
  }
//+------------------------------------------------------------------+
//| Custom indicator deinitialization function                       |
//+------------------------------------------------------------------+
int deinit()
  {
   return(0);
  }
//+------------------------------------------------------------------+
//| Linear Regression Line                                           |
//+------------------------------------------------------------------+
int start()
  {
   int limit;
   int counted_bars=IndicatorCounted();
   if(counted_bars<0) counted_bars=0;
   if(counted_bars>0) counted_bars--;
   limit=Bars-counted_bars;

   for(int shift=limit-1; shift>=0; shift--)
      {
         sumx = 0;
         sumy = 0;
         sumxy = 0;
         sumx2 = 0;
         sumy2 = 0;
         for(n = 0; n <= LRLPeriod-1; n++)
             {
               sumx = sumx + n;
               sumy = sumy + Close[shift + n];
               sumxy = sumxy + n * Close[shift + n];
               sumx2 = sumx2 + n * n;
               sumy2 = sumy2 + Close[shift + n] * Close[shift + n];
             }
         m=(LRLPeriod*sumxy-sumx*sumy)/(LRLPeriod*sumx2-sumx*sumx);
         yint=(sumy+m*sumx)/LRLPeriod;
         r=(LRLPeriod*sumxy-sumx*sumy)/MathSqrt((LRLPeriod*sumx2-sumx*sumx)*(LRLPeriod*sumy2-sumy*sumy));
         LRLBuffer[shift]=yint-m*LRLPeriod;
      }
   return(0);
  }
//+------------------------------------------------------------------+
Comments