LineFractals_Alert
Download script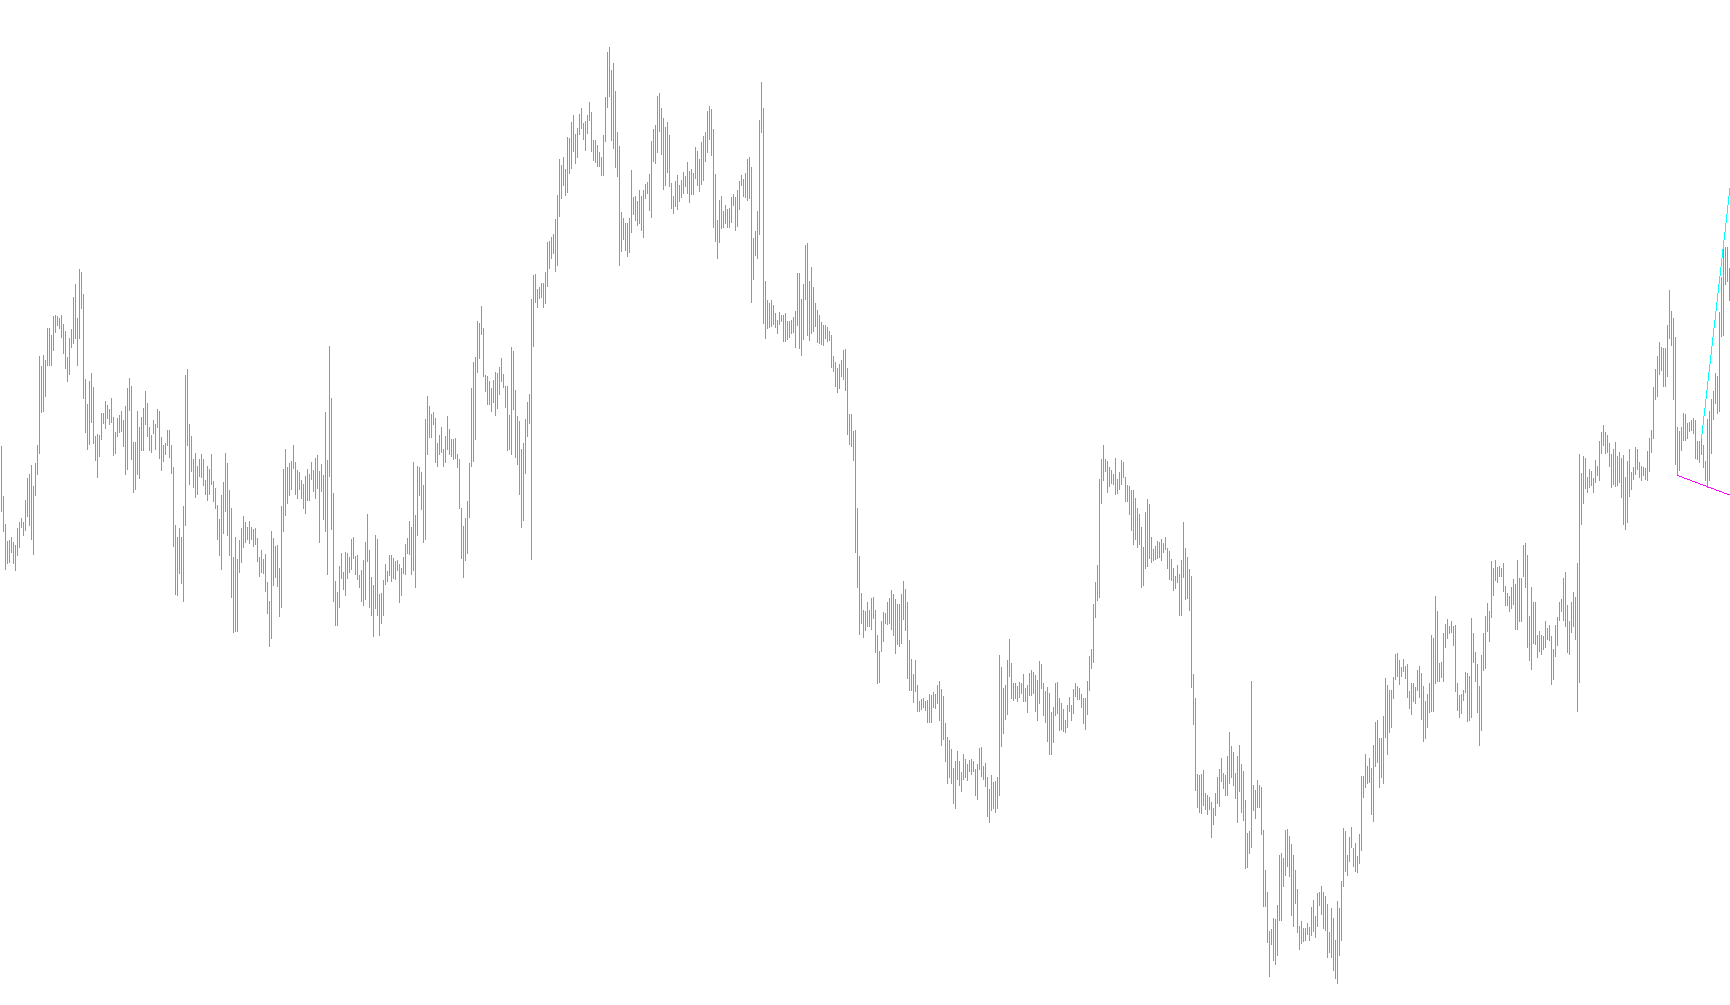
This tool is designed to automatically identify key price boundaries on a trading chart—specifically Support and Resistance levels—based on historical price "fractals." By scanning past market data, the script identifies significant high and low points where the price has historically turned around.
How it Works
1. Identifying Key Boundaries The logic scans your current chart to find two specific types of price points:
- Support Levels: It looks for local "bottoms" in the market. Once it finds these points, it draws a visual line on your chart representing a floor where the price has historically struggled to fall further.
- Resistance Levels: It looks for local "peaks." It then draws a visual line representing a ceiling where the price has historically struggled to rise further.
2. Dynamic Visuals The script places these levels directly on your trading window. The lines are configured as "rays," meaning they extend forward into the future, allowing you to see where current market trends might encounter upcoming obstacles or floors. You can customize the colors and thickness of these lines within the settings to suit your visual preferences.
3. Smart Alert System Beyond just drawing lines, the script acts as an active monitor. It watches the closing price of each new candle to see if it "breaks" through these identified levels:
- Breakout Alert (Short): If a new candle closes below a detected Support line (moving from above it to below it), the script triggers an alert notifying you that the support has broken and suggesting a potential move toward the downside.
- Breakout Alert (Long): If a new candle closes above a detected Resistance line (moving from below it to above it), the script triggers an alert notifying you that the resistance has been broken, suggesting a potential move toward the upside.
Summary for the User
This script takes the manual work out of identifying structural market barriers. It automatically calculates where "floors" and "ceilings" are based on fractal patterns and sends you immediate notifications the moment the price breaks through them, helping you spot potential trend shifts in real-time.
//+------------------------------------------------------------------+
//|                                           LineFractals_Alert.mq4 |
//+------------------------------------------------------------------+


#property indicator_chart_window

extern color SupLineColor = Magenta;
extern int   SupLnWidth = 1;
extern color ResLineColor = Aqua;
extern int   ResLnWidth = 1;
extern bool  UseAlert = true;

double   Support,Resistance,LastClose;
double   PriorSupport,PriorResistance,PriorLastClose;


bool NewBar()
{
   static datetime lastbar = 0;
   datetime curbar = Time[0];
   if(lastbar!=curbar)
   {
      lastbar=curbar;
      return (true);
   }
   else
   {
      return (false);
   }
}

//+------------------------------------------------------------------+
//| Custom indicator initialization function                         |
//+------------------------------------------------------------------+
int init()
  {
//---- indicators
    ObjectCreate("Support", OBJ_TREND, 0,0,0,0,0);
    ObjectCreate("Resistance", OBJ_TREND, 0,0,0,0,0);
//----
   return(0);
  }
//+------------------------------------------------------------------+
//| Custom indicator deinitialization function                       |
//+------------------------------------------------------------------+
int deinit()
  {
//----
  ObjectDelete("Support");
  ObjectDelete("Resistance");
//----
   return(0);
  }
//+------------------------------------------------------------------+
//| Custom indicator iteration function                              |
//+------------------------------------------------------------------+
int start()
  {

//----
  double F1=0, F3=0, F13;
  int    B1, B3, SR=2;

  while(F3==0)
  {
    F13=iFractals(NULL,0,MODE_LOWER,SR);
    if (F13!=0)
    {
      if      (F1==0){B1=SR; F1=F13;}
      else if (F3==0){B3=SR; F3=F13;}
    }
    SR++;
  }
    ObjectSet("Support", OBJPROP_TIME1 ,iTime(NULL,0,B3));
    ObjectSet("Support", OBJPROP_TIME2 ,iTime(NULL,0,B1));
    ObjectSet("Support", OBJPROP_PRICE1,iLow(NULL,0,B3));
    ObjectSet("Support", OBJPROP_PRICE2,iLow(NULL,0,B1));
    ObjectSet("Support", OBJPROP_RAY   , True);
    ObjectSet("Support", OBJPROP_COLOR, SupLineColor);
    ObjectSet("Support", OBJPROP_WIDTH, SupLnWidth);


//----
  double G1=0, G3=0, G13;
  int    C1, C3, RR=2;

  while(G3==0)
  {
    G13=iFractals(NULL,0,MODE_UPPER,RR);
    if (G13!=0)
    {
      if      (G1==0){C1=RR; G1=G13;}
      else if (G3==0){C3=RR; G3=G13;}
    }
    RR++;
  }
    ObjectSet("Resistance", OBJPROP_TIME1 ,iTime(NULL,0,C3));
    ObjectSet("Resistance", OBJPROP_TIME2 ,iTime(NULL,0,C1));
    ObjectSet("Resistance", OBJPROP_PRICE1,iHigh(NULL,0,C3));
    ObjectSet("Resistance", OBJPROP_PRICE2,iHigh(NULL,0,C1));
    ObjectSet("Resistance", OBJPROP_RAY   , True);
    ObjectSet("Resistance", OBJPROP_COLOR, ResLineColor);
    ObjectSet("Resistance", OBJPROP_WIDTH, ResLnWidth);

//====================================================================
//  Alert if last bar closes outside of trendlines
//====================================================================

Support=ObjectGetValueByShift("Support",1);
Resistance=ObjectGetValueByShift("Resistance",1);
LastClose=iClose(NULL,0,1);
PriorSupport=ObjectGetValueByShift("Support",2);
PriorResistance=ObjectGetValueByShift("Resistance",2);
PriorLastClose=iClose(NULL,0,2);


if (NewBar()==true && (UseAlert) && LastClose<Support && PriorLastClose>=PriorSupport) Alert(Symbol()+" "+Period()+": Support broken @ "+DoubleToStr(Support,Digits)+" - Look to go SHORT");
if (NewBar()==true && (UseAlert) && LastClose>Resistance && PriorLastClose<=PriorSupport) Alert(Symbol()+" "+Period()+": Resistance broken @ "+DoubleToStr(Resistance,Digits)+" - Look to go LONG");


//----
   return(0);
  }
//+------------------------------------------------------------------+
Comments