LineFrakUp_v1
Download script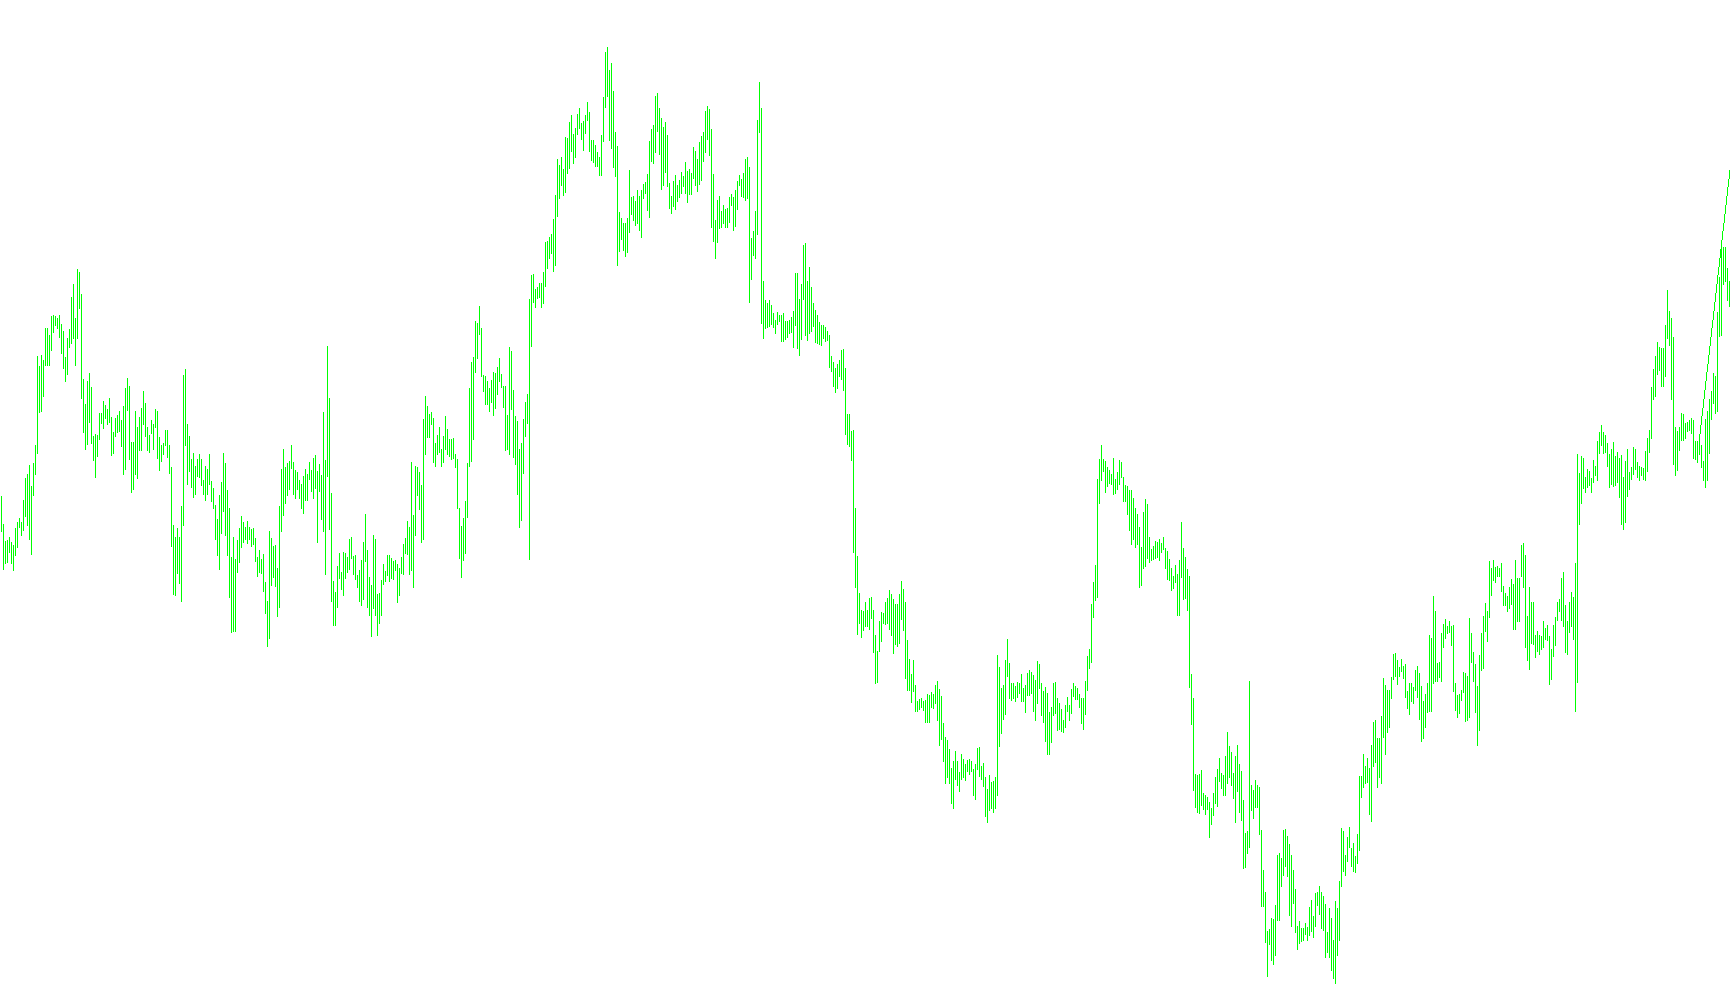
This script is designed to automatically identify and visualize specific price action patterns on your trading chart. Its primary objective is to detect "Fractals"—which are essentially pivot points where the price reaches a local peak or valley—and draw a horizontal resistance line based on these coordinates.
How the Logic Works
1. Pattern Detection The script continuously scans the historical price data to find upward-moving fractals. A fractal occurs when a specific candle's high point is higher than the highs of the candles immediately surrounding it. The script specifically looks for these "peaks" to determine where the market might be facing resistance.
2. Automated Identification Rather than requiring you to manually click on chart peaks, the logic automatically searches backward through the recent price history. It identifies the two most relevant fractal points to establish a range. Once it finds these two specific points, it captures their exact time and price coordinates.
3. Dynamic Visual Mapping Once the data points are identified, the script draws a trend line (a "Resistance" line) on your chart. It connects the price levels of these two fractals, providing a clear visual horizontal boundary. This helps traders see where the market has historically struggled to move higher.
4. User Customization While the underlying logic handles the math and searching automatically, you have control over the visual presentation. You can customize:
- Color: Choose how the line appears on your screen.
- Width & Style: Adjust the thickness and dash-pattern of the line for better visibility.
- Ray Extension: Decide whether the line should project infinitely into the future or stay confined to the specific area where the fractals were detected.
Summary for Traders
This tool simplifies technical analysis by highlighting structural price ceilings. By automatically finding these "peaks" and drawing a line across them, it saves you the time of manual identification and helps you instantly visualize potential areas where the market might encounter selling pressure.
//+------------------------------------------------------------------+
//|                                                     LineFrakDown.mq4 |
//|                                                     Yuriy Tokman |
//|                                            yuriytokman@gmail.com |
//|                                             mod by Darkkiller    |
//+------------------------------------------------------------------+
#property copyright "Yuriy Tokman"
#property link      "yuriytokman@gmail.com"

#property indicator_chart_window

extern color Color = Lime;
extern int Width = 1;
extern int Style = 0;
extern bool Ray = True;
//+------------------------------------------------------------------+
//| Custom indicator initialization function                         |
//+------------------------------------------------------------------+
int init()
  {
//---- indicators
    ObjectCreate("Rezist", OBJ_TREND, 0,0,0,0,0);//ñîçäàíèå òðåíäîâîé ëèíèè
//----
   return(0);
  }
//+------------------------------------------------------------------+
//| Custom indicator deinitialization function                       |
//+------------------------------------------------------------------+
int deinit()
  {
//----
  ObjectDelete("Rezist");//óäàëåíèå îáåêòà
//----
   return(0);
  }
//+------------------------------------------------------------------+
//| Custom indicator iteration function                              |
//+------------------------------------------------------------------+
int start()
  {

//----
  double F1=0, F3=0, F13;    // íîìåðà ôðàêòàëîâ
  int    B1, B3, SR=2;               // íîìåðà áàðîâ

  while(F3==0)                       //ïîèñê ôðàêòàëîâ
  {
    F13=iFractals(NULL,0,MODE_UPPER,SR);
    if (F13!=0)
    {
      if      (F1==0){B1=SR; F1=F13;}
      else if (F3==0){B3=SR; F3=F13;}
    }
    SR++;
  }
    ObjectSet("Rezist", OBJPROP_TIME1 ,iTime(NULL,0,B3));
    ObjectSet("Rezist", OBJPROP_TIME2 ,iTime(NULL,0,B1));
    ObjectSet("Rezist", OBJPROP_PRICE1,iHigh(NULL,0,B3));
    ObjectSet("Rezist", OBJPROP_PRICE2,iHigh(NULL,0,B1));
    ObjectSet("Rezist", OBJPROP_RAY   , Ray);
    ObjectSet("Rezist", OBJPROP_COLOR,Color);
    ObjectSet("Rezist", OBJPROP_WIDTH,Width);
    ObjectSet("Rezist", OBJPROP_STYLE,Style);

//----
   return(0);
  }
//+------------------------------------------------------------------+
Comments