iAnchMom_v3
Download script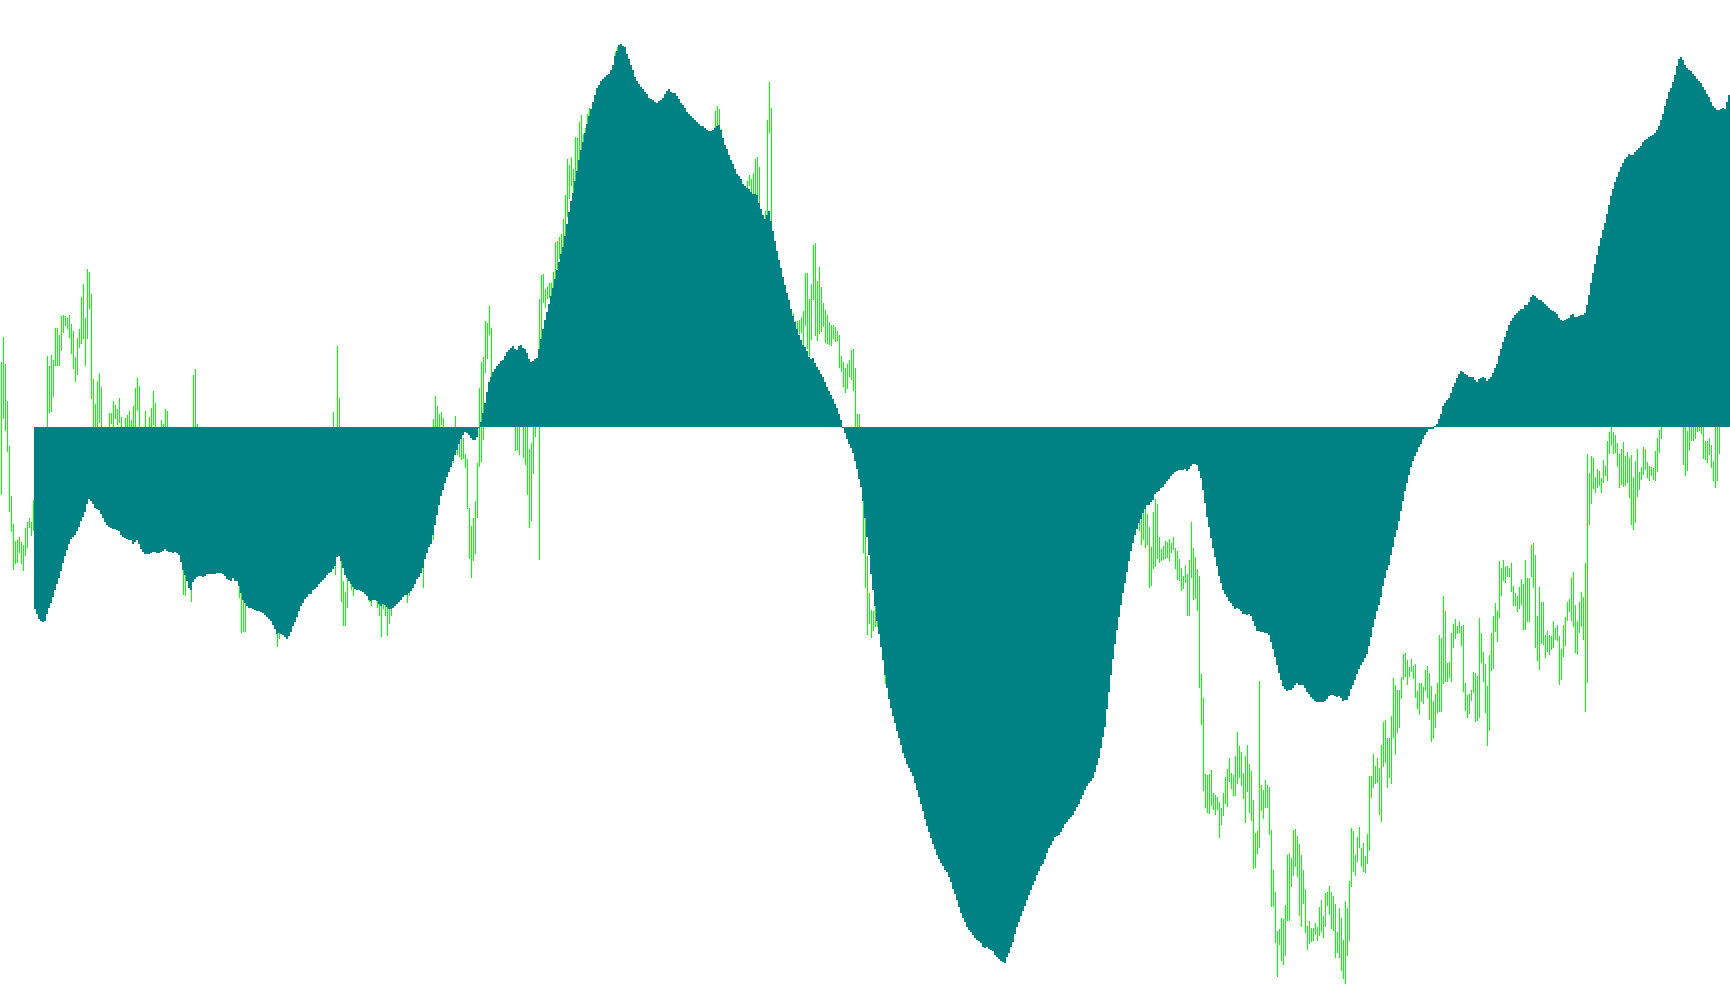
This tool is designed to provide traders with a visual representation of relative momentum by comparing two different types of moving averages. Instead of looking at raw price action, it analyzes the relationship between short-term trends and long-term trends to create a specialized histogram on your trading platform.
How the Logic Works
The script operates by calculating two distinct mathematical averages based on the closing prices of the assets:
- The Short-Term Trend: The tool first calculates an Exponential Moving Average (EMA). This type of average is designed to react more quickly to recent price fluctuations, making it sensitive to current market changes.
- The Long-Term Anchor: The tool then calculates a Simple Moving Average (SMA) using a much longer timeframe. This serves as a "baseline" or "anchor," representing the broader, sustained direction of the market over a significant period.
The Calculation Process
To determine the value shown on your screen, the script performs a specific comparison:
- It takes the value of the short-term trend and divides it by the value of the long-term anchor.
- It then calculates the percentage difference between these two figures.
- This result is multiplied by 100 to convert it into a clear percentage format.
How to Interpret the Results
The final output is displayed as a Teal histogram in a separate window below your main chart. This visualizes how much "momentum" the price currently has relative to its historical baseline:
- Positive Momentum: When the short-term trend is moving significantly higher than the long-term anchor, the histogram will rise above the zero line.
- Negative Momentum: When the short-term trend falls below the long-term anchor, the histogram will drop below the zero line.
- Relative Strength: The height of the bars indicates the intensity of the current move. A taller bar suggests a stronger deviation from the "anchor" price, while a bar closer to the zero line suggests that the market is stabilizing or moving in line with its long-term average.
By using this logic, you can quickly identify whether the current market move is a significant surge or if the price is simply drifting along its established path.
//+------------------------------------------------------------------+
//|                                                    iAnchMom.mq4  |
//|                                                                  |
//+------------------------------------------------------------------+
#property indicator_separate_window
#property indicator_buffers 1
#property indicator_color1 Teal
//---- input parameters
extern int EMA_period=34;
extern int MomPeriod=120;
//---- buffers
double MomBuffer[];
//+------------------------------------------------------------------+
//| Custom indicator initialization function                         |
//+------------------------------------------------------------------+
int init()
  {
   string short_name;
//---- indicator line
   IndicatorBuffers(1);
   SetIndexBuffer(0, MomBuffer);
   SetIndexStyle(0,DRAW_HISTOGRAM,STYLE_SOLID,2,Teal);
   SetIndexDrawBegin(0,MomPeriod + MomPeriod + 1);
//---- name for DataWindow and indicator subwindow label
   short_name="iAnchMom("+MomPeriod+")";
   IndicatorShortName(short_name);
   SetIndexLabel(0,short_name);
//----
   return(0);
  }
//+------------------------------------------------------------------+
//| AnchMom                                                          |
//+------------------------------------------------------------------+
int start()
  {
   int i,counted_bars=IndicatorCounted();
   double a,b;
   int SMA_Period=MomPeriod + MomPeriod + 1;
//----
   if(Bars<=SMA_Period) return(0);
//---- initial zero
   if(counted_bars<1)
      for(i=1;i<=SMA_Period;i++) MomBuffer[Bars-i]=0.0;
//----
   i=Bars-SMA_Period-1;
   if(counted_bars>=SMA_Period) i=Bars-counted_bars-1;
   while(i>=0)
     {
      a=iMA(NULL,0,EMA_period,0, MODE_EMA,PRICE_CLOSE, i);
      b=iMA(NULL,0,SMA_Period,0, MODE_SMA, PRICE_CLOSE, i);
      MomBuffer[i]= 100*((a/b)-1);
      i--;
     }
   return(0);
  }
//+------------------------------------------------------------------+
Comments