i-VaR95
Download script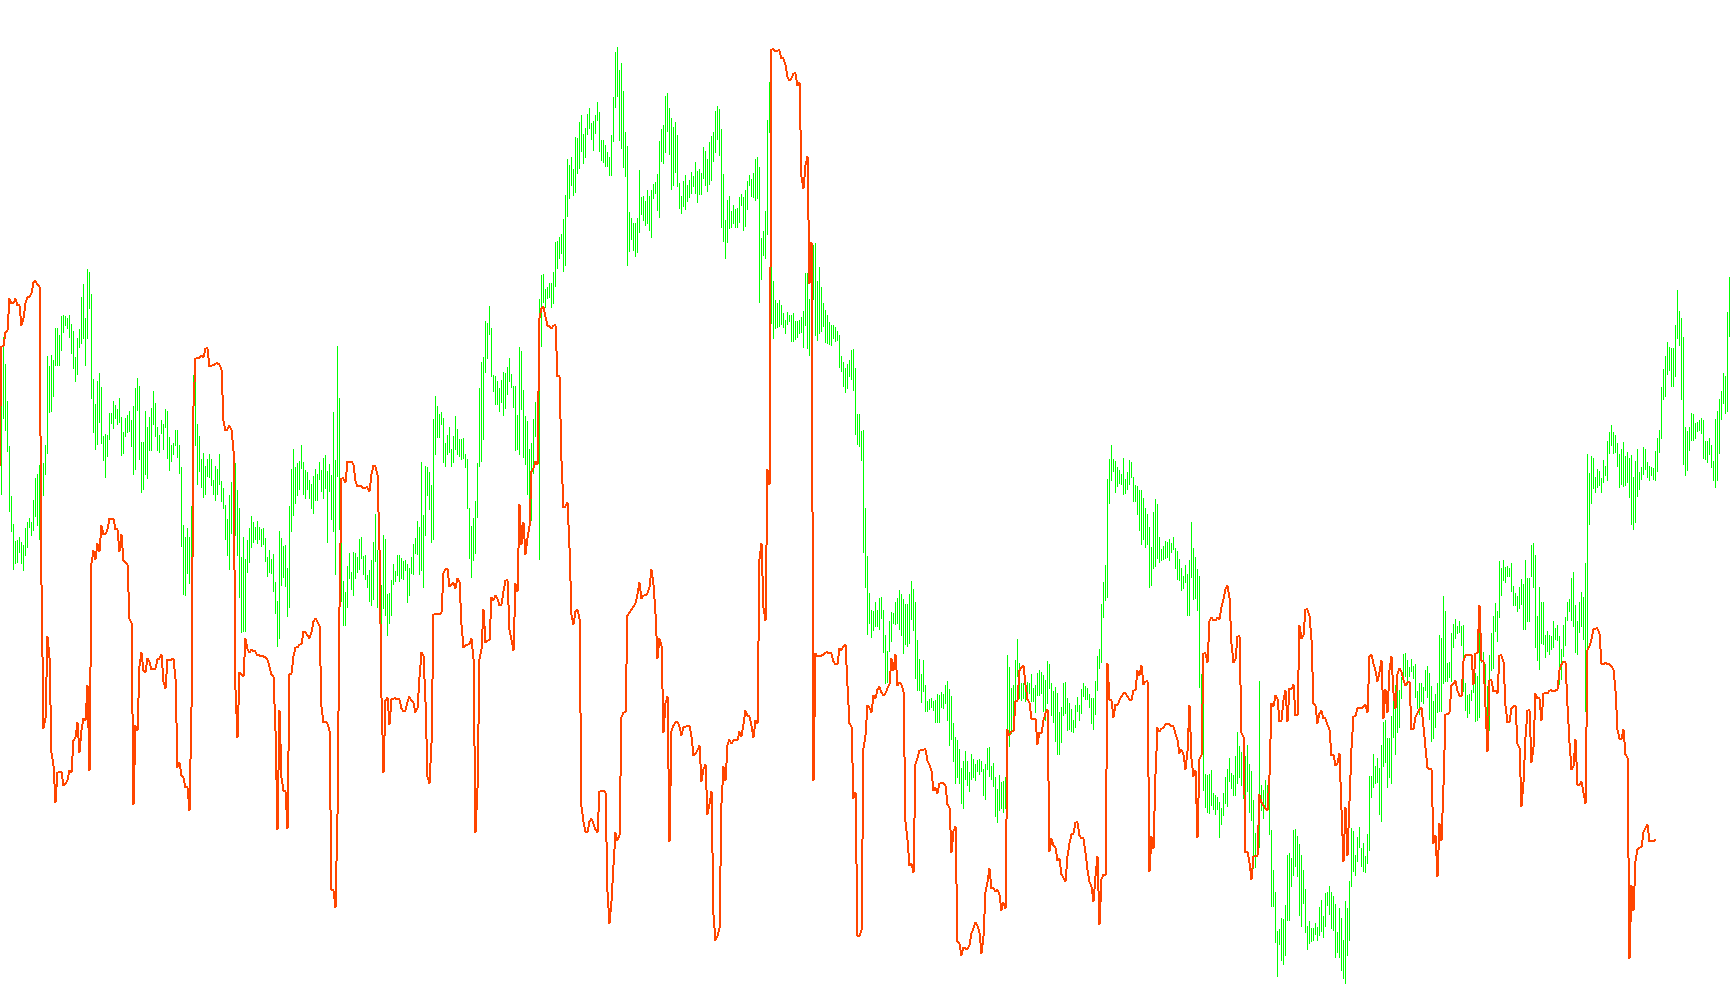
This tool is designed to measure and visualize market volatility, providing traders with a clearer understanding of how much an asset's price is likely to swing over a specific period. Unlike standard indicators that might only show simple price movement, this script calculates the "risk" or "noise" level inherent in the market based on historical data.
Core Functionality
The primary purpose of the indicator is to calculate different types of Historical Volatility (HV). It analyzes past price action to estimate how much a price might deviate from its current level. It specifically offers four distinct ways to interpret this volatility:
- Simple Historical Volatility: A standard calculation that looks at the average movement of prices over a set period, treating all recent data with equal importance.
- Exponential Historical Volatility: A more nuanced version that gives more weight to recent price action. It uses a "smoothing" factor to ensure that current market behavior has a stronger influence on the result than older data.
- High-Low (Parkinson) Volatility: This method focuses on the distance between the highest and lowest prices reached during each period, rather than just the closing prices. This is often more effective at capturing "extreme" price swings that occur within a single candle.
- Value at Risk (VaR 95%): This is a more advanced financial metric. It estimates the maximum amount of movement (in points) that could occur within a specific investment horizon with a 95% level of certainty. Essentially, it tells you what kind of price "jump" could happen in your timeframe, plus a buffer for the current market spread.
Key Parameters and Usage
To tailor the results to your specific trading style, the script includes several adjustable settings:
- HV Period: Determines how far back into the past the indicator looks to gather its data.
- HV Type: Allows you to switch between the four calculation methods mentioned above.
- Smoothing Coefficient: Specifically used for the Exponential method to fine-tune how quickly the indicator reacts to new information.
- Investment Horizon: Used specifically for the VaR calculation to define the time window (e.g., how many bars into the future) for the risk estimate.
Summary for the User
This indicator does not provide direct "Buy" or "Sell" signals. Instead, it acts as a diagnostic tool for market conditions. By observing the levels on the chart, you can identify periods of high turbulence (where the indicator spikes) versus periods of stability. It is particularly useful for risk management, helping you understand the potential range of price movement and ensuring that your risk limits are aligned with the current reality of the market.
//+------------------------------------------------------------------+
//|                                                      i-VaR95.mq4 |
//|                                    http://piccstick.blogspot.com |
//|                                    http://piccstick.blogspot.com |
//+------------------------------------------------------------------+
//| Èíäèêàòîð îòîáðàæàåò çíà÷åíèå èñòîðè÷åñêîé âîëàòèëüíîñòè         |
//| Âîçìîæåí ðàñ÷åò âîëàòèëüíîñòè íåñêîëüêèìè ìåòîäàìè               |
//|  - Simple Historical Volatility                                  |
//| - Exponential Historical Volatility                              |
//|  - High-Low Historical Volatility                                |
//|                                                                  |
//| Íåñêîëüêî çàìå÷àíèé:                                             |
//| 1. Äàííûé èíäèêàòîð íå ïîêàçûâàåò òî÷åê âõîäà â ðûíîê            |
//|    è âûõîäà èç íåãî ;-)                                          |
//| 2. Êàðòèíêà èíäèêàòîðà ïîõîæà íà êðòèíêó èçâåòíîãî ATR, îñîáåííî |
//|    ïðè ðàñ÷åòå ìåòîäîì Ïàðêèíñîíà, çíà÷åíèÿ òåì íå ìåíåå, ðàçíûå |
//| 3. Äëÿ ðàñ÷åòà VaR èñïîëüçóåòñÿ 95-ïðîöåíòíàÿ âåðîÿòíîñòü,       |
//|    òî åñòü èíäèêàòîð îòîáðàæàåò çíà÷åíèå â ïóíêòàõ (áåç ó÷åòà    |
//|    5-ãî ñèìâîëà), êîòîðîå ìîæåò áûòü äîñòóãíóòî öåíîé ñ          |
//|    âåðîÿòíîñòüþ 5% çà ïåðèîä ðàâíûé èíâåòèöèîííîìó               |
//|    ãîðèçîíòó (grznt)                                             |
//|                                                                  |
//|                                                                  |
//|                                                                  |
//| Ïî âñåì âîïðîñàì îáðàùàòüñÿ â ëè÷êó íà ýòîì ôîðóìå               |
//| èëè íà ïî÷òó.                                                    |
//|                                                                  |
//| Ïèøó íà çàêàç.                                                   |
//|                                                                  |
//+------------------------------------------------------------------+
#property copyright "piccioli@gmail.com"
#property link      "http://piccstick.blogspot.com"

#property indicator_separate_window
#property indicator_buffers 1
#property indicator_color1 OrangeRed

extern int HV_Period = 21;    // Ïåðèîä ðàñ÷åòà èñòîðè÷åñêîé âîëàòèëüíîñòè
extern int HV_Type = 0;       // Ñïîñîá âû÷èñëåíãèÿ âîëàòèëüíîñòè
                              // Âîçìîæíûå çíà÷åíèÿ:
                              // 0 - ìåòîä ïðîñòîé (ðàâíîâçâåøåííîé) ñêîëüçÿùåé ñðåäíåé
                              // 1 - ìåòîä ýêñïîíåíöèàëüíî-âçâåøåííîé ñêîëüçÿùåé
                              // 2 - ýêñòðåìàëüíàÿ âîëàòèëüíîñòü, âîëàòèëüíîñòü Ïàðêèíñîíà
                              // Õ - ïðè ëþáîì äðóãîì çíà÷åíèè áóäåò âûâîäèòñÿ 95-ïðîöåíòíûé VaR (ñì. ñïåö. ëèòåðàòóðó)

extern double decline=0.94;   // êîýôôèöèåíò ñãëàæèâàíèÿ
                              // Òðàäèöèîííî ïðèíèìàåòñÿ ðàâíûì 0.94
                              // äàííûé ïàðàìåòð âëèÿåò òîëüêî íà åêñïîíåíöèàëüíî-âçâåøåííûé ìåòîä, òî åñòü êîãäà HV_Type = 1

extern int grznt=3;           // èíâåñòèöèîííûé ãîðèçîíò äëÿ âû÷èñëåíèÿ 95% VaR


double VAR[];

//+------------------------------------------------------------------+
//| Custom indicator initialization function                         |
//+------------------------------------------------------------------+
int init()
  {
//---- indicators
   SetIndexStyle(0, DRAW_LINE, EMPTY, 2, OrangeRed);
   SetIndexBuffer(0,VAR);
   SetIndexLabel(0,"VaR");
//----
   return(0);
  }
//+------------------------------------------------------------------+
//| Custom indicator deinitialization function                       |
//+------------------------------------------------------------------+
int deinit()
  {
//----

//----
   return(0);
  }
//+------------------------------------------------------------------+
//| Custom indicator iteration function                              |
//+------------------------------------------------------------------+
int start()
  {
   int counted_bars=IndicatorCounted();
   int limit;

//----
   if(counted_bars>0) counted_bars = counted_bars-HV_Period;
     limit=Bars-counted_bars;
  //---- îñíîâíîé öèêë
     for(int i=0; i<limit; i++)
       {
       VAR[i]=HV(i);
       }


//----
   return(0);
  }
//+------------------------------------------------------------------+

double HV(int j)
   {
   double shv = 0;
   double tshv = 0;
   double ehv = 0;
   double hlhv = 0;
   double var95 = 0;

   for (int i=j; i<(HV_Period+j); i++)
      {
      hlhv = hlhv + (MathLog(iHigh(Symbol(),0,i)/iLow(Symbol(),0,i))*MathLog(iHigh(Symbol(),0,i)/iLow(Symbol(),0,i)))/(4*MathLog(2));
      }

   hlhv = MathSqrt(hlhv/HV_Period);

   for (i=j; i<(HV_Period+j); i++)
   {
      tshv = tshv + MathLog(iClose(Symbol(),0,i)/iClose(Symbol(),0,i+1));
   }

   tshv = tshv/HV_Period;

   for (i=j; i<(HV_Period+j); i++)
   {
      shv = shv + (tshv - (MathLog(iClose(Symbol(),0,i)/iClose(Symbol(),0,i+1))))*(tshv - (MathLog(iClose(Symbol(),0,i)/iClose(Symbol(),0,i+1))));
   }

   shv = MathSqrt(shv/(HV_Period-1));


   if (decline >= 1 || decline <= 0)
      decline = 0.94;

   for (i=j; i<(HV_Period+j); i++)
   {
      ehv = ehv + decline*(tshv - (MathLog(iClose(Symbol(),0,i)/iClose(Symbol(),0,i+1))))*(tshv - (MathLog(iClose(Symbol(),0,i)/iClose(Symbol(),0,i+1))));
   }
   ehv = MathSqrt((1-decline)*shv);

   var95 = 1.65 * (shv) * 10000 * MathSqrt(grznt)+2*MarketInfo(Symbol(),MODE_SPREAD);

   if (HV_Type == 0)
      return(shv);
   else if (HV_Type == 1)
      return(ehv);
   else if (HV_Type == 2)
      return(hlhv);
   else
      return(MathCeil(var95));
}
Comments