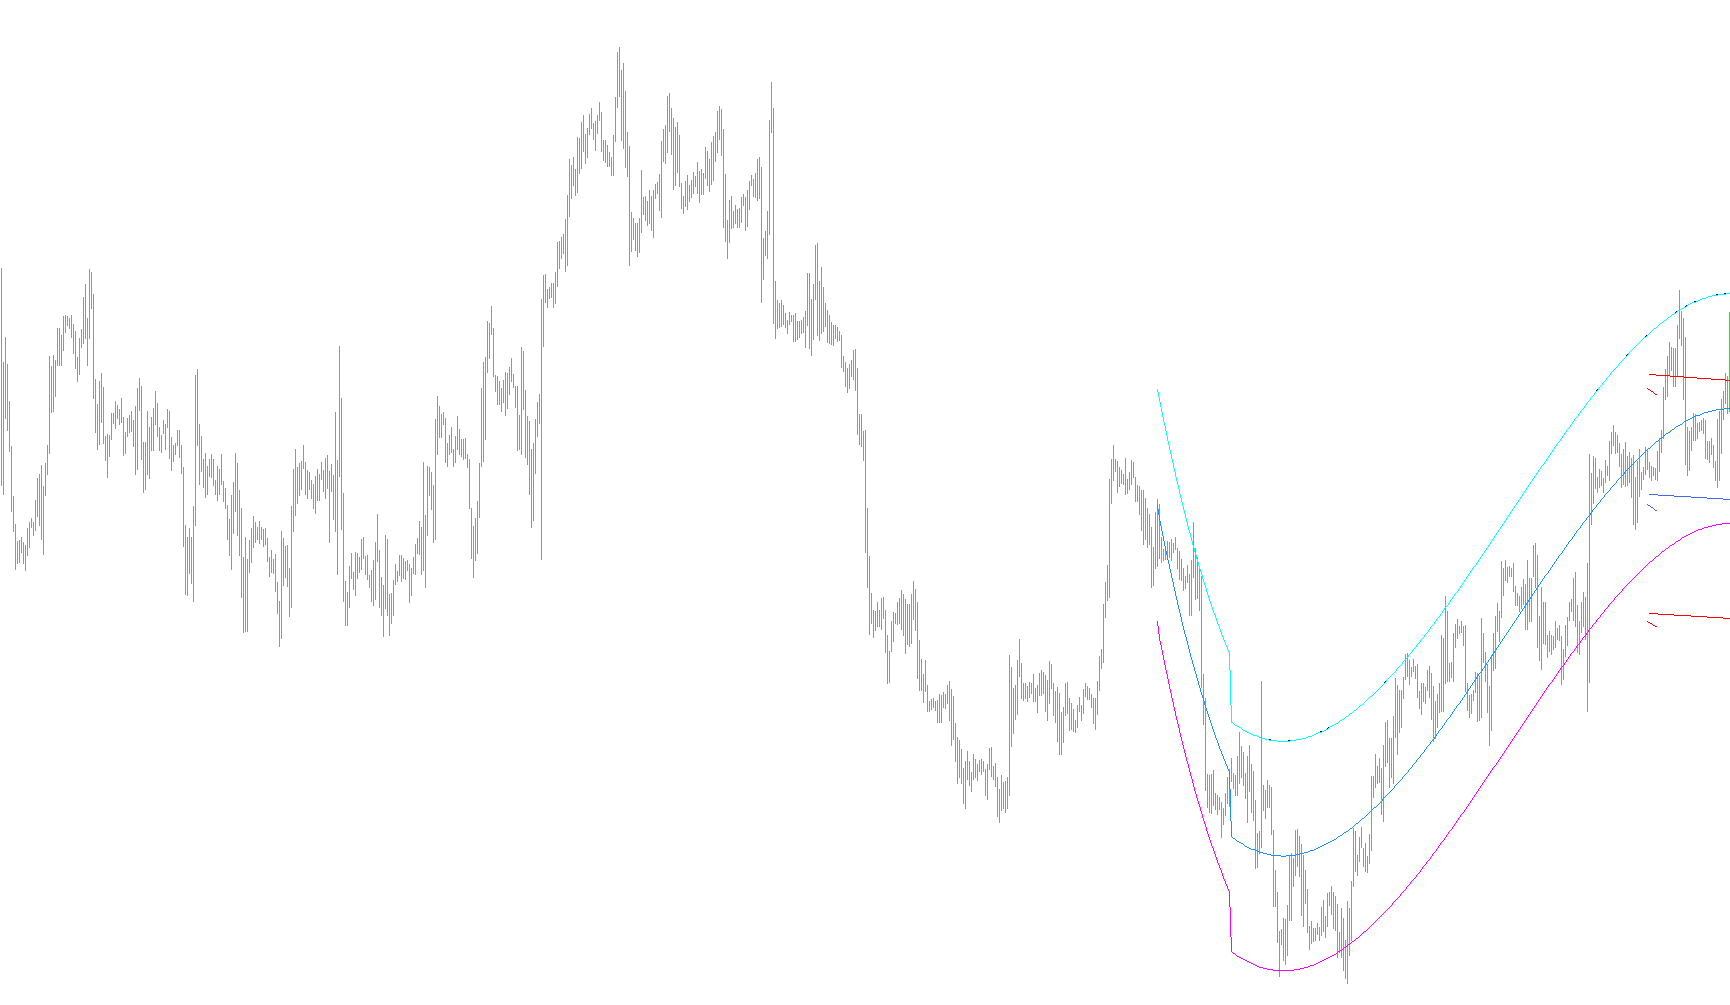
This script functions as a sophisticated visual analysis tool designed to map out price trends and identify potential "boundaries" for market movement. Instead of relying on simple moving averages, it uses advanced mathematical modeling to project the trajectory of price action based on historical data.
Core Logic Overview
1. Polynomial Curve Fitting (Trend Projection) The primary logic of the script is based on a mathematical method called polynomial regression. The script analyzes a specific number of historical price bars (set by the user) to identify the underlying curve of the market. By calculating a "degree" of complexity, it determines whether the current trend is a simple linear move or a more complex, fluid curve. This allows the tool to "smooth out" the noise of daily price fluctuations to reveal the true direction of the trend.
2. The Gaussian Elimination Process To achieve high accuracy in its trend projection, the script performs a series of internal matrix calculations known as Gaussian elimination. Think of this as a rigorous sorting process where the software organizes a large amount of raw data into a structured mathematical grid. This step ensures that the resulting trend line is not just a "best guess" but is statistically derived from the weighted importance of every price point within the lookback period.
3. Dynamic Boundary Channels (Standard Deviation) Once the primary trend curve is established, the script calculates the volatility of the market relative to that curve. It measures how far the price typically deviates from the center line. It then projects two outer boundaries:
- Upper Boundary: Represents the "ceiling" or overextended area.
- Lower Boundary: Represents the "floor" or oversold area.
The distance between these boundaries is determined by a standard deviation factor. This creates a dynamic channel that expands when the market is volatile and contracts when the market is stable, providing a visual "corridor" of expected price behavior.
Visual Representation
The script communicates this logic to the user through three distinct visual components:
- The Center Line: A blue line representing the projected mathematical path of the price.
- The Boundary Lines: Two red lines (upper and lower) that define the range in which the price is statistically likely to remain.
- Trend Rays: The script automatically generates trend lines ("Rays") at specific points to give a clearer visual cue of the immediate projected direction from the current price point.
Summary for the User
Essentially, this tool looks backward at the last several hundred bars of data, uses heavy-duty math to find the "true" curve of the market, and then draws a corridor around that curve. It helps traders see where the price should be heading and identifies the zones where the price might be reaching an extreme point.
//http://www.forex-tsd.com/suggestions-trading-systems/20012-didgeridoo-trading-system.html
//mod trail 2009fxtsd
//----
#property indicator_chart_window
#property indicator_buffers 6
#property indicator_color4 LimeGreen
#property indicator_color5 Gold
#property indicator_color6 Gold

#property indicator_color1 Blue
#property indicator_color2 Brown
#property indicator_color3 Maroon

extern int degree = 3;
extern double kstd = 2.0;
extern int bars = 250;
extern int shift = 0;


//-----
double fx[],sqh[],sql[];
double fx1[],sqh1[],sql1[];

double ai[10,10],b[10],x[10],sx[20];
double sum;
int ip,p,n,f;
double qq,mm,tt;
int ii,jj,kk,ll,nn;
double sq;

int i0 = 0;

/*
void clear()
{
  int total = ObjectsTotal();
  for (int i=total-1; i >= 0; i--)
  {
    string name = ObjectName(i);
    if (StringFind(name, prefix) == 0) ObjectDelete(name);
  }
}
*/

//+------------------------------------------------------------------+
//| Custom indicator initialization function                         |
//+------------------------------------------------------------------+
int init()
{
  SetIndexBuffer(3, fx); // Áóôåðû ìàññèâîâ èíäèêàòîðà
  SetIndexBuffer(4, sqh);
  SetIndexBuffer(5, sql);

  SetIndexStyle(3, DRAW_LINE);
  SetIndexStyle(4, DRAW_LINE);
  SetIndexStyle(5, DRAW_LINE);

  SetIndexEmptyValue(3, 0.0);
  SetIndexEmptyValue(4, 0.0);
  SetIndexEmptyValue(5, 0.0);

  SetIndexShift(3, shift);
  SetIndexShift(4, shift);
  SetIndexShift(5, shift);


  SetIndexBuffer(0, fx1);
  SetIndexBuffer(1, sqh1);
  SetIndexBuffer(2, sql1);


  return(0);
}

//+------------------------------------------------------------------+
//| Custom indicator deinitialization function                       |
//+------------------------------------------------------------------+
int deinit()
{  for (int i=0;i<Bars;i++)
      {
      ObjectDelete("Ray1"+Time[i]);
      ObjectDelete("Ray2"+Time[i]);
      ObjectDelete("Ray3"+Time[i]);
      }

  //clear();
  return(0);
}

//+------------------------------------------------------------------+
//| Custom indicator iteration function                              |
//+------------------------------------------------------------------+
int start()
{
  if (Bars < bars) return;

//----

  int mi; // ïåðåìåííàÿ èñïîëüçóþùàÿñÿ òîëüêî â start
  ip = bars;
  p=ip; // òèïà ïðèñâàèâàíèå
  sx[1]=p+1; // ïðèìå÷àíèå - [] - îçíà÷àåò ìàññèâ
  nn = degree+1;

  SetIndexDrawBegin(0, Bars-p-1);
  SetIndexDrawBegin(1, Bars-p-1);
  SetIndexDrawBegin(2, Bars-p-1);

//----------------------sx-------------------------------------------------------------------
  for(mi=1;mi<=nn*2-2;mi++) // ìàòåìàòè÷åñêîå âûðàæåíèå - äëÿ âñåõ mi îò 1 äî nn*2-2
  {
    sum=0;
    for(n=i0;n<=i0+p;n++)
    {
       sum+=MathPow(n,mi);
    }
    sx[mi+1]=sum;
  }
  //----------------------syx-----------
  for(mi=1;mi<=nn;mi++)
  {
    sum=0.00000;
    for(n=i0;n<=i0+p;n++)
    {
       if(mi==1) sum+=Close[n];
       else sum+=Close[n]*MathPow(n,mi-1);
    }
    b[mi]=sum;
  }
//===============Matrix=======================================================================================================
  for(jj=1;jj<=nn;jj++)
  {
    for(ii=1; ii<=nn; ii++)
    {
       kk=ii+jj-1;
       ai[ii,jj]=sx[kk];
    }
  }
//===============Gauss========================================================================================================
  for(kk=1; kk<=nn-1; kk++)
  {
    ll=0;
    mm=0;
    for(ii=kk; ii<=nn; ii++)
    {
       if(MathAbs(ai[ii,kk])>mm)
       {
          mm=MathAbs(ai[ii,kk]);
          ll=ii;
       }
    }
    if(ll==0) return(0);
    if (ll!=kk)
    {
       for(jj=1; jj<=nn; jj++)
       {
          tt=ai[kk,jj];
          ai[kk,jj]=ai[ll,jj];
          ai[ll,jj]=tt;
       }
       tt=b[kk];
       b[kk]=b[ll];
       b[ll]=tt;
    }
    for(ii=kk+1;ii<=nn;ii++)
    {
       qq=ai[ii,kk]/ai[kk,kk];
       for(jj=1;jj<=nn;jj++)
       {
          if(jj==kk) ai[ii,jj]=0;
          else ai[ii,jj]=ai[ii,jj]-qq*ai[kk,jj];
       }
       b[ii]=b[ii]-qq*b[kk];
    }
  }
  x[nn]=b[nn]/ai[nn,nn];
  for(ii=nn-1;ii>=1;ii--)
  {
    tt=0;
    for(jj=1;jj<=nn-ii;jj++)
    {
       tt=tt+ai[ii,ii+jj]*x[ii+jj];
       x[ii]=(1/ai[ii,ii])*(b[ii]-tt);
    }
  }
//===========================================================================================================================
  for(n=i0;n<=i0+p;n++)
  {
    sum=0;
    for(kk=1;kk<=degree;kk++)
    {
       sum+=x[kk+1]*MathPow(n,kk);
    }
    fx[n]=x[1]+sum;
  }
//-----------------------------------Std-----------------------------------------------------------------------------------
  sq=0.0;
  for(n=i0;n<=i0+p;n++)
  {
    sq+=MathPow(Close[n]-fx[n],2);
  }
  sq=MathSqrt(sq/(p+1))*kstd;

  for(n=i0;n<=i0+p;n++)
  {
    sqh[n]=fx[n]+sq;
    sql[n]=fx[n]-sq;
  }


  for(n=0;n<Bars-IndicatorCounted();n++)
  {
    fx1[n]=fx[n];
    sqh1[n]=sqh[n];
    sql1[n]=sql[n];
  }


   if (  ObjectFind  ("Ray1"+Time[0])== -1   )
         ObjectCreate("Ray1"+Time[0],OBJ_TREND,0,Time[5],sqh[5],Time[0],sqh[0]);
         ObjectSet   ("Ray1"+Time[0],OBJPROP_COLOR,Red);
         ObjectSet   ("Ray1"+Time[0],OBJPROP_RAY,false);


   if (  ObjectFind  ("Ray2"+Time[0])== -1   )
         ObjectCreate("Ray2"+Time[0],OBJ_TREND,0,Time[5],fx[5],Time[0],fx[0]);
         ObjectSet   ("Ray2"+Time[0],OBJPROP_COLOR,RoyalBlue);
         ObjectSet   ("Ray2"+Time[0],OBJPROP_RAY,false);

   if (  ObjectFind  ("Ray3"+Time[0])== -1   )
         ObjectCreate("Ray3"+Time[0],OBJ_TREND,0,Time[5],sql[5],Time[0],sql[0]);
         ObjectSet   ("Ray3"+Time[0],OBJPROP_COLOR,Red);
         ObjectSet   ("Ray3"+Time[0],OBJPROP_RAY,false);


  return(0);
}
//+------------------------------------------------------------------+
Comments