i-RP-T01m-mod-4
Download script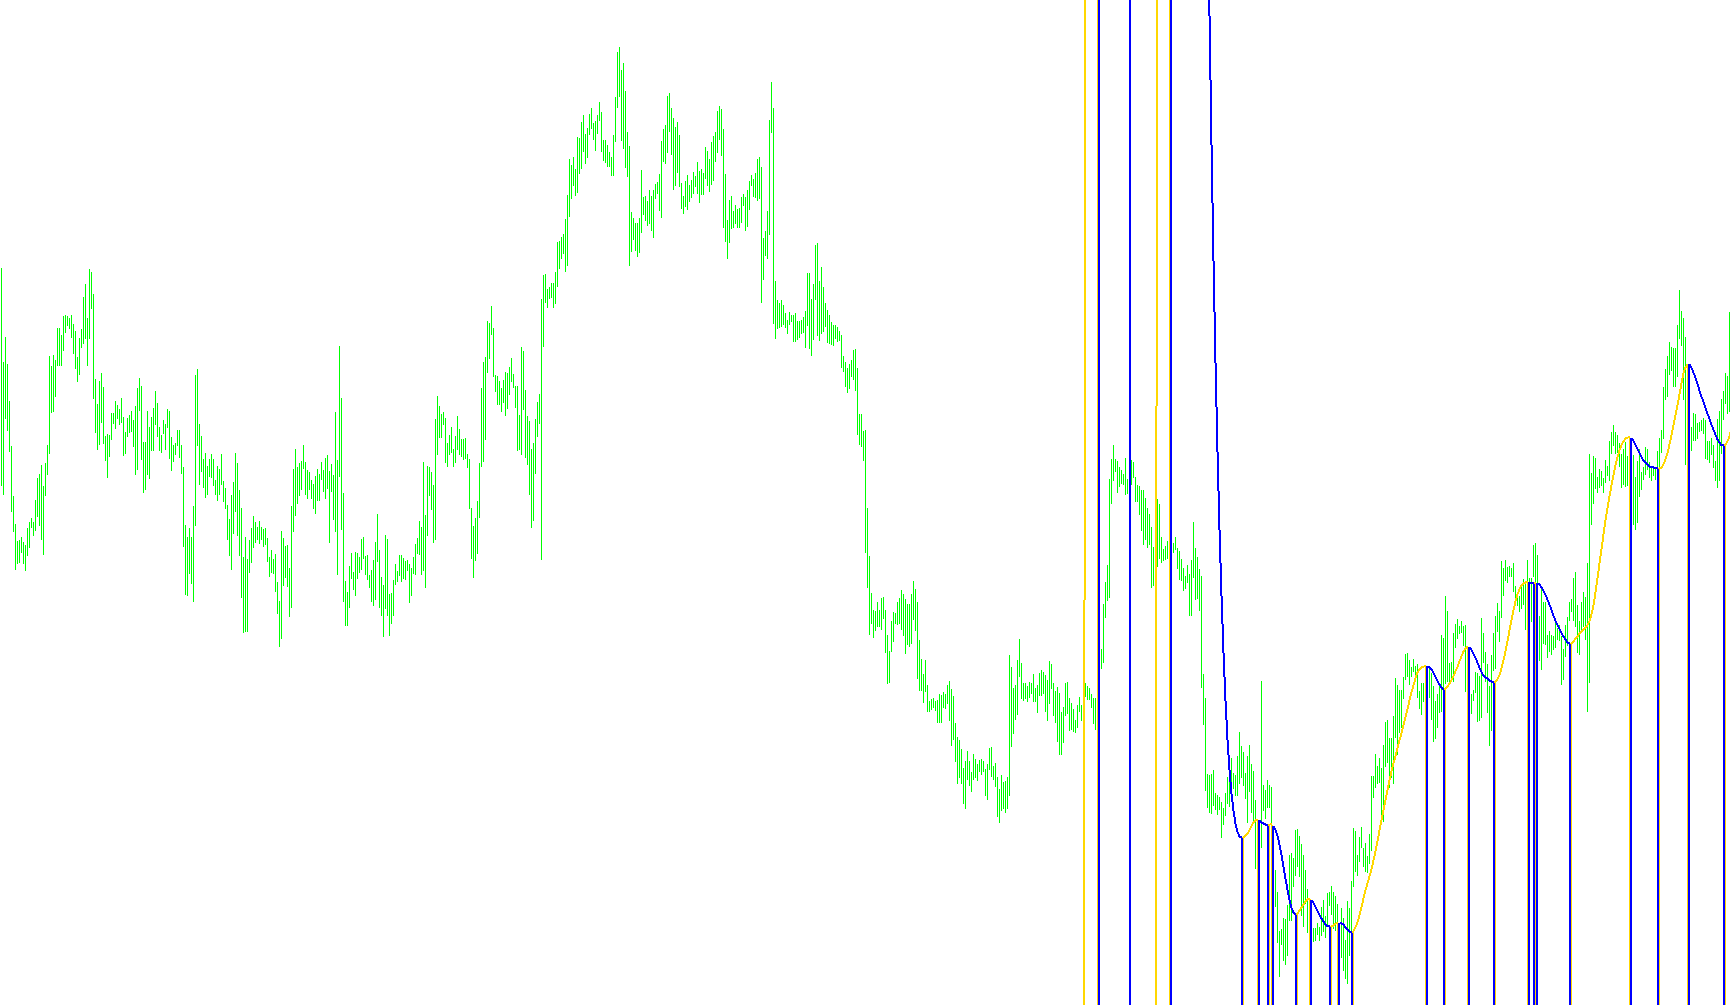
This technical tool is designed to assist traders by identifying specific structural shifts in price movement. It functions as a trend-following indicator that filters out minor market noise to highlight the core momentum of the asset you are monitoring.
Core Logic and Mechanism
The script operates by analyzing historical price data over a customizable timeframe to calculate a smoothed, weighted value. Instead of reacting impulsively to every small tick, it uses a mathematical smoothing technique (similar to a moving average but more specialized) to create a continuous "path" of price action.
Here is how the logic unfolds:
- Data Smoothing: The tool takes the closing prices of recent bars and applies a weighted calculation. This creates a fluid line that represents the underlying trend, effectively stripping away "jittery" price movements that can often mislead inexperienced traders.
- Trend Identification: Once the smooth path is established, the script compares the current value against the previous value. It is looking for a definitive change in direction:
- If the current value is higher than the previous one, it signifies an upward trend.
- If the current value is lower than the previous one, it signifies a downward trend.
- Visual Signaling: To make this information easy to read at a glance on your chart, the script uses two distinct visual outputs:
- Positive Momentum: When the price path is moving upward, the indicator activates its first visual line (typically appearing in Aqua).
- Negative Momentum: When the price path begins to head downward, it switches to the second visual line (typically appearing in Red).
How It Helps the User
By translating raw price data into these two clear directional lines, the script allows you to see the "flow" of the market. Rather than guessing which way the price will go based on a single candle, you can observe whether the momentum has shifted from one color to another. It serves as a visual confirmation tool, helping you stay on the right side of the prevailing trend while ignoring insignificant fluctuations.
//+------------------------------------------------------------------+
//|                                            i-RoundPrice-T01m.mq4 |
//|          25.07.2006  Translated on MT4 by Êèì Èãîðü Â. aka KimIV |
//|                                              http://www.kimiv.ru |
//+------------------------------------------------------------------+
/*[[
	Name := RoundPrice
	Author := Copyright © 2006, HomeSoft Tartan Corp.
	Link := spiky@transkeino.ru
	Separate Window := No
	First Color := Lime
	First Draw Type := Line
	First Symbol := 217
	Use Second Data := Yes
	Second Color := Red
	Second Draw Type := Line
	Second Symbol := 218
]]*/
#property copyright "Copyright © 2006, HomeSoft Tartan Corp."
#property link      "spiky@transkeino.ru"

#property indicator_chart_window
#property indicator_buffers 2
#property indicator_color1 Aqua
#property indicator_color2 Red

//------- Âíåøíèå ïàðàìåòðû èíäèêàòîðà -------------------------------
extern int t3_period=21;
extern double b=0.7;
extern int mBar=300;

//------- Ãëîáàëüíûå ïåðåìåííûå èíäèêàòîðà ---------------------------
double dBuf0[], dBuf1[];


//+------------------------------------------------------------------+
//| Custom indicator initialization function                         |
//+------------------------------------------------------------------+
void init() {
  SetIndexBuffer    (0, dBuf0);
  SetIndexEmptyValue(0, EMPTY_VALUE);
  SetIndexStyle     (0, DRAW_LINE,EMPTY,2);

  SetIndexBuffer    (1, dBuf1);
  SetIndexEmptyValue(1, EMPTY_VALUE);
  SetIndexStyle     (1, DRAW_LINE,EMPTY,2);
}

//+------------------------------------------------------------------+
//| Custom indicator iteration function                              |
//+------------------------------------------------------------------+
void start() {
  bool   ft=True;
  double e1, e2, e3, e4, e5, e6, c1, c2, c3, c4, n, w1, w2, b2, b3;
  double t3[];
  int    LoopBegin, shift;

  if (mBar==0) LoopBegin=Bars-t3_period-1;
  else LoopBegin=mBar;
  LoopBegin=MathMin(LoopBegin, Bars-t3_period-1);

  ArrayResize(t3, LoopBegin);

  if (ft) {
    b2=b*b;
    b3=b2*b;
    c1=-b3;
    c2=(3*(b2+b3));
    c3=-3*(2*b2+b+b3);
    c4=(1+3*b+b3+3*b2);
    n=t3_period;

    if (n<1) n=1;
    n=1+0.5*(n-1);
    w1=2/(n+1);
    w2=1-w1;
    ft=False;
  }

  for (shift=LoopBegin; shift>=0; shift--) {
    e1=w1*Close[shift]+w2*e1;
    e2=w1*e1+w2*e2;
    e3=w1*e2+w2*e3;
    e4=w1*e3+w2*e4;
    e5=w1*e4+w2*e5;
    e6=w1*e5+w2*e6;

    t3[shift]=c1*e6+c2*e5+c3*e4+c4*e3;
    if (t3[shift+1]<=t3[shift]) dBuf0[shift]=t3[shift]; else dBuf0[shift]=0;
    if (t3[shift+1]>t3[shift]) dBuf1[shift]=t3[shift]; else dBuf1[shift]=0;
  }
 Comment("P2=",t3[2]," P1=",t3[1],"P0=",t3[0]);
}
//+------------------------------------------------------------------+
Comments