iAvgVol_v1
Download script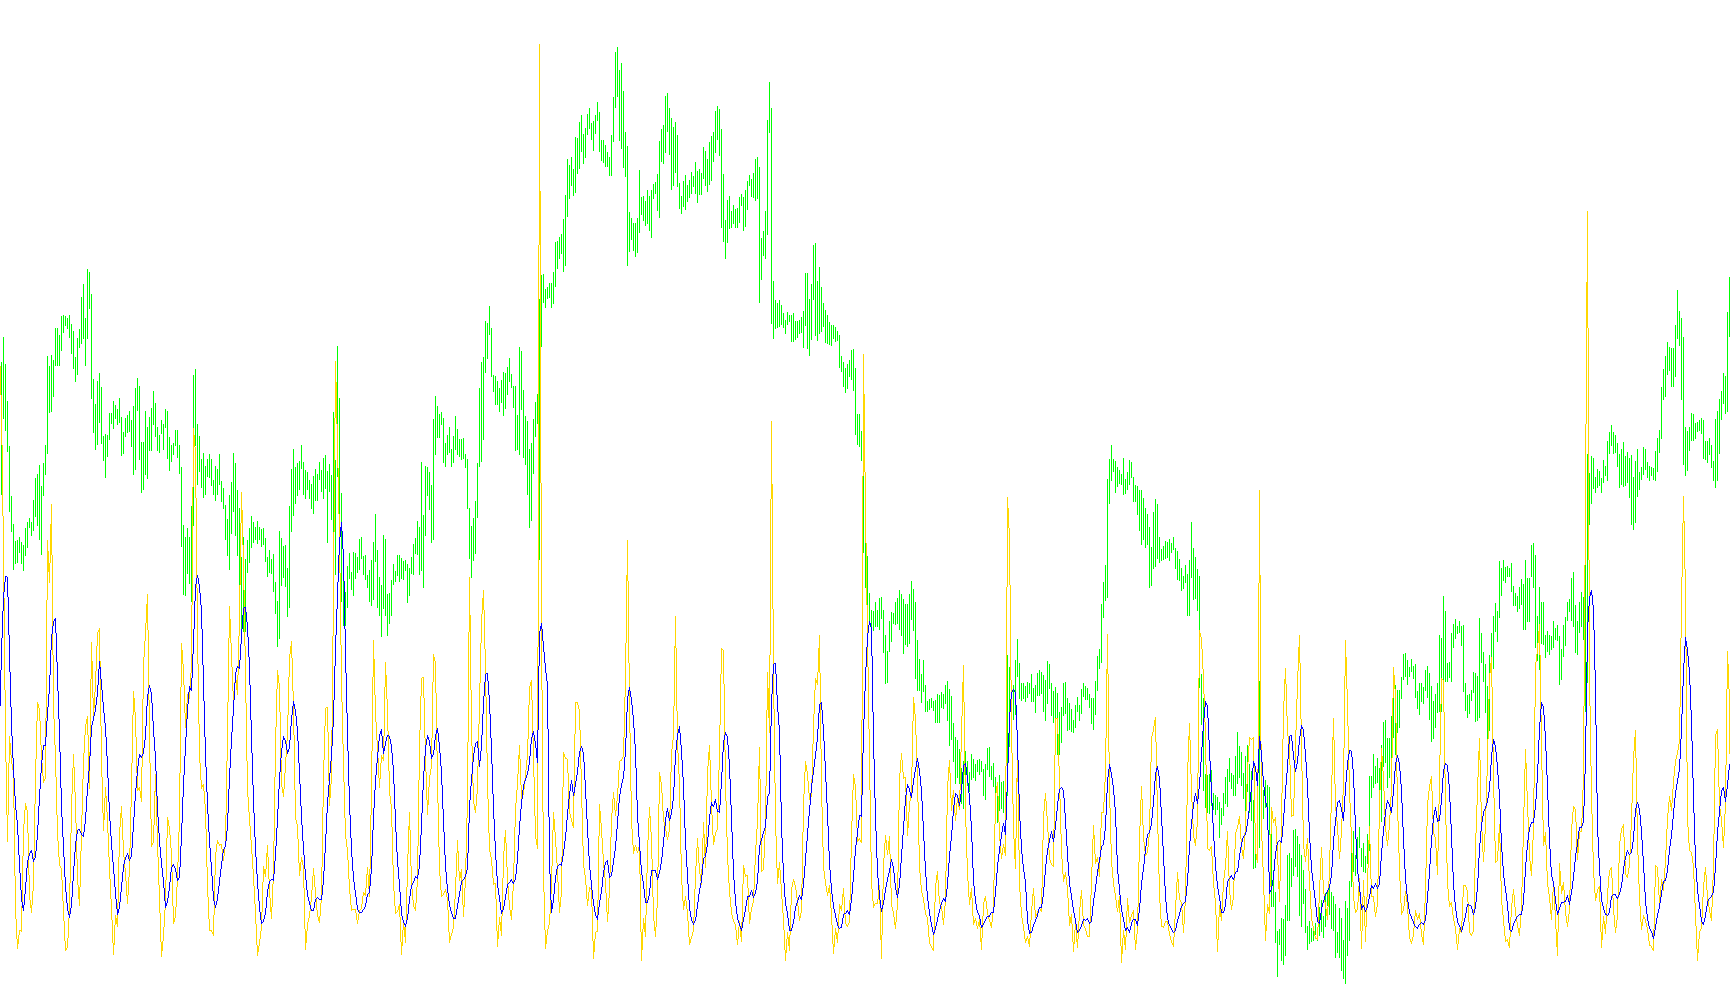
This tool is designed to provide traders with a clearer visual representation of market activity by comparing current trading volume against a historical average. By isolating these two data points in a separate window, it helps users identify whether the current level of participation in the market is significant or merely typical for the recent past.
Core Functionality
The script tracks and displays two primary metrics simultaneously:
- Current Volume: This represents the actual amount of trading activity occurring on each specific price candle. It serves as a raw look at how much "action" is happening in the market at any given moment.
- Average Volume: This is a calculated baseline derived from the total volume over a user-defined period (set by the number of candles you choose to include). By averaging this data, the tool smooths out the noise of sudden, one-off spikes to show you what "normal" trading behavior looks like.
How the Logic Works
The script operates through a continuous loop that scans the market history from the most recent candle back to the beginning of the available chart data. For every candle it encounters, the logic performs the following steps:
- Data Collection: It identifies the specific volume for the current point in time.
- Rolling Calculation: It looks back at a specific number of previous candles (determined by your input settings) and calculates their combined volume.
- Averaging: It divides that total sum by the number of periods to create a moving average.
- Visual Mapping: It plots both these values as lines on your chart.
Practical Application
By viewing these two lines together, you can easily spot discrepancies. For example, if the current volume line jumps significantly higher than the average volume line, it may indicate a surge in interest or a major move in the market. Conversely, if the current volume remains well below the average, it suggests a period of lower liquidity or consolidation. This allows you to make more informed decisions by distinguishing between standard market fluctuations and high-impact trading events.
/*-----------------------------+
|			       |
| Shared by www.Aptrafx.com    |
|			       |
+------------------------------*/

//+------------------------------------------------------------------+
//|                                                      iAvgVol.mq4 |
//|                                           Copyright © 2005, Anri |
//|                                    http://tradestation.narod.ru/ |
//+------------------------------------------------------------------+
#property copyright "Copyright © 2005, Anri"
#property link      "http://tradestation.narod.ru/"

#property indicator_separate_window
#property indicator_buffers 2
#property indicator_color1 Blue
#property indicator_color2 WhiteSmoke
//---- input parameters
extern int       nPeriod=5;
//---- buffers
double ExtMapBuffer1[];
double ExtMapBuffer2[];
//+------------------------------------------------------------------+
//| Custom indicator initialization function                         |
//+------------------------------------------------------------------+
int init()
  {
//---- indicators
   SetIndexStyle(0,DRAW_LINE);
   SetIndexBuffer(0,ExtMapBuffer1);
   SetIndexLabel(0,"Volume");
   SetIndexStyle(1,DRAW_LINE);
   SetIndexBuffer(1,ExtMapBuffer2);
   SetIndexLabel(1,"Avg Volume");
//----
   return(0);
  }
//+------------------------------------------------------------------+
//| Custor indicator deinitialization function                       |
//+------------------------------------------------------------------+
int deinit()
  {
//---- TODO: add your code here

//----
   return(0);
  }
//+------------------------------------------------------------------+
//| Custom indicator iteration function                              |
//+------------------------------------------------------------------+
int start()
  {
   int    counted_bars=IndicatorCounted();
//---- TODO: add your code here
   int    i, shift;
   double nSum;
//---- initial zero
   if(counted_bars<1) // åñëè òåêóùèé áàð ìåíüøå åäèíèöû - íàôèã ñ ïëÿæà, óñòàíàâëèâàåì âñå â íóëè
     {
      for(i=1;i<=0;i++) {ExtMapBuffer1[Bars-i]=0; ExtMapBuffer2[Bars-i]=0; };
     };
//---- âû÷èñëåíèÿ
   for(shift=Bars-1;shift>=0;shift--) {
     nSum=Volume[shift];
     ExtMapBuffer1[shift]=nSum;
     if ((nPeriod>0)&&(shift<(Bars-1-nPeriod))) {
       for(i=nPeriod-1;i>=1;i--) {
         nSum=nSum+ExtMapBuffer1[shift+i];
	    };
	    nSum=nSum/nPeriod;
	  };
     ExtMapBuffer2[shift]=nSum;
   };
   return(0);
  }
//+------------------------------------------------------------------+
Comments