iBalans
Download script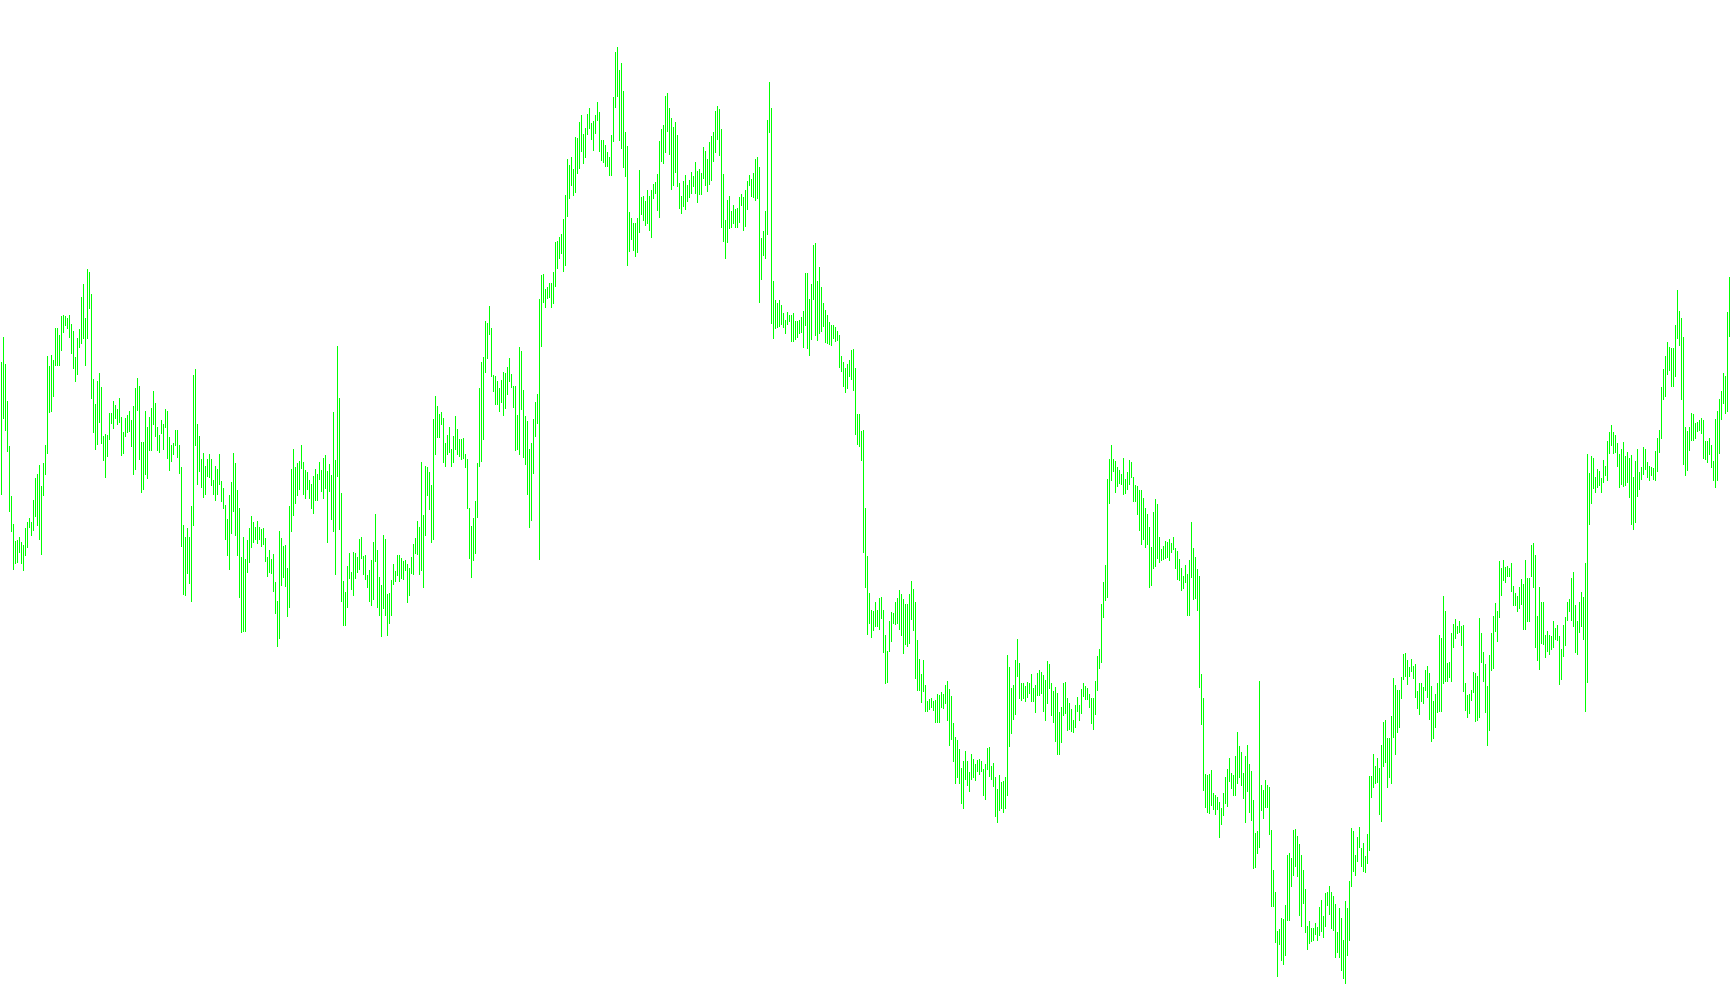
This tool is designed to provide traders with a comprehensive, visual breakdown of their account performance and trading history directly within the MetaTrader platform. Rather than just showing your current balance, it reconstructs the journey of your account by analyzing past closed trades to give you a clear picture of your progress over specific timeframes.
Core Functionality
Historical Balance Tracking The script scans your account history to identify completed trades within a user-defined timeframe (based on days). It then calculates how each trade affected your balance—including profits, losses, commissions, and swaps—to map out a chronological progression of your account's value. This allows you to see the "path" your balance took as trades were closed.
Performance Analysis The tool automatically categorizes your trading activity into several key metrics:
- Gross Profit & Loss: Shows the raw totals of your winning and losing trades.
- Net Profit: Calculates the final bottom line by subtracting losses from gains.
- Win/Loss Ratio: Tracks the total number of trades executed, specifically counting how many were profitable versus how many resulted in a loss.
Asset-Specific Filtering One of the key features is the ability to distinguish between your overall account performance and your performance on a specific currency pair or asset. The tool isolates data for the current symbol you are viewing, allowing you to see exactly how much net profit and what win/loss ratio you have specifically on that instrument compared to your total account activity.
Visual Data Display Instead of requiring you to manually calculate statistics, the script displays this information dynamically in a dedicated window:
- Real-time Totals: It continuously updates your current balance and high-level stats.
- Dynamic Labels: It generates an on-screen dashboard showing your net profit, gross figures, and trade counts for both the total account and the specific symbol.
- Highs and Lows: The logic identifies the maximum and minimum balance points reached during the analyzed period, helping you visualize your peak performance and deepest drawdowns.
Summary for the User
Essentially, this script acts as a "performance diary." It automatically sorts through your history to tell you not just where your money is now, but how you got there—identifying your best and worst moments, your success rate on different assets, and providing a clean, organized summary of your trading habits at a single glance.
//+------------------------------------------------------------------+
//|                           iBalans.mq4                            |
//+------------------------------------------------------------------+
#property  copyright "Yurich"
#property  link      ""
//---- indicator settings
#property  indicator_separate_window
#property  indicator_buffers 3
#property  indicator_color1  Green
#property  indicator_color2  Gold
#property  indicator_width1  2
#property  indicator_width2  2
//---- indicator parameters
extern int Days=0;
extern bool Show_info=true;
//---- indicator buffers
double     iB[];
double     iS[];
double     iT[];
//---- indicator var
int wh;
datetime prevtime;
double prevbalans, midlevel, minlevel, maxlevel;
#define names "iBalans_"
//+------------------------------------------------------------------+
int init()
{
   SetIndexBuffer(0,iB);
   SetIndexBuffer(1,iS);
   SetIndexBuffer(2,iT);
   SetIndexStyle(0,DRAW_LINE);
   SetIndexStyle(1,DRAW_LINE);
   SetIndexStyle(2,DRAW_NONE);
   IndicatorDigits(2);
   IndicatorShortName(names+"("+Days+")");
   SetIndexLabel(0,"Total balans");
   SetIndexLabel(1,NULL);
   SetIndexLabel(2,NULL);
//----
   prevbalans=0;
   midlevel=0;
   minlevel=0;
   maxlevel=0;
   if(Days<0) Days=0;
   return(0);
}
//+------------------------------------------------------------------+
int start()
{
   int i, j=0, pt=0, lt=0, st=0, spt=0, slt=0;
   int htm[][2];
   double cp, mnl, mxl;
   double sb=0.0, gp=0.0, gl=0.0, sgp=0.0, sgl=0.0;
   datetime now=iTime(NULL,0,0);
   if(now!=prevtime)
   {
      prevtime=now;
      prevbalans=0;
   }
   double sbalans=AccountBalance();
   if(prevbalans==sbalans)return(0);
   prevbalans=sbalans;
   datetime stday=iTime(Symbol(), PERIOD_D1,0)-Days*PERIOD_D1*60;
//----
   int oht=OrdersHistoryTotal();
   ArrayResize(htm,oht);
   for(i=0; i<oht; i++)
      if(OrderSelect(i,SELECT_BY_POS,MODE_HISTORY))
         if(OrderType()<=OP_SELL && (OrderCloseTime()>stday || Days==0))
         {
            htm[j][0]=OrderCloseTime();
            htm[j][1]=OrderTicket();
            j++;
         }
   ArrayResize(htm,j);
   ArraySort(htm);
   mxl=sbalans;
   mnl=sbalans;
   iB[0]=sbalans;
   for(i=1; i<=j; i++)
   {
      OrderSelect(htm[j-i][1],SELECT_BY_TICKET);
      cp=OrderProfit()+OrderCommission()+OrderSwap();
      iB[i]=iB[i-1]-cp;
      if(cp>=0) { pt++; gp+=cp;} else { lt++; gl+=-cp;}
      if(iB[i]>mxl) mxl=iB[i];
      if(iB[i]<mnl) mnl=iB[i];
      if(OrderSymbol()==Symbol())
      {
         iS[i-1]=iB[i-1];
         iS[i]=iB[i];
         sb+=cp;
         if(cp>=0) { spt++; sgp+=cp;} else { slt++; sgl+=-cp;}
         st++;
      } else iS[i]=EMPTY_VALUE;
   }
   sbalans=iB[i-1];
   if(sbalans!=midlevel)
   {
      midlevel=sbalans;
      SetLevelValue(0,midlevel);
   }
   if(mxl!=maxlevel)
   {
      maxlevel=MathMax(mxl,midlevel);
      SetLevelValue(1,maxlevel);
      iT[0]=maxlevel+0.1*(maxlevel-minlevel);
   }
   if(mnl!=minlevel)
   {
      minlevel=MathMin(mnl,midlevel);
      SetLevelValue(2,minlevel);
      iT[1]=minlevel-0.1*(maxlevel-minlevel);
   }
//----
   if(!Show_info) return(0);
   wh=WindowFind(names+"("+Days+")");
   show(0, Lime, "Total Balans "+DoubleToStr(AccountBalance(),2));
   show(1, Lime, "Gross Profit "+DoubleToStr(gp,2)
            +"  Gross Loss "+DoubleToStr(gl,2)
            +"  Net Profit "+DoubleToStr(gp-gl,2));
   show(2, Lime, "Total Trades "+j+"     Profit Trades "+pt+"     Loss Trades "+lt);
   show(3, Gold, "Net Profit "+Symbol()+" "+DoubleToStr(sb,2));
   show(4, Gold, "Gross Profit "+DoubleToStr(sgp,2)
            +"  Gross Loss "+DoubleToStr(sgl,2));
   show(5, Gold, Symbol()+" Trades "+st+"     Profit Trades "+spt+"    Loss Trades "+slt);
//----
   return(0);
}
//+------------------------------------------------------------------+
void show(int line, color col, string str)
{
   string sobj=names+line;
   int cw=ObjectFind(sobj);
   if(cw!=wh)
   {
      if(cw>=0) ObjectDelete(sobj);
      ObjectCreate(sobj,OBJ_LABEL,wh,0,0);
      ObjectSet(sobj,OBJPROP_CORNER,0);
      ObjectSet(sobj,OBJPROP_XDISTANCE,3);
      ObjectSet(sobj,OBJPROP_YDISTANCE,25+line*12);
   }
   ObjectSetText(sobj,str,8,"",col);
}
//+------------------------------------------------------------------+
int deinit()
{
   for(int i=0; i<=5; i++) ObjectDelete(names+i);
   return(0);
}
//+------------------------------------------------------------------+
Comments