FLOW_A
Download script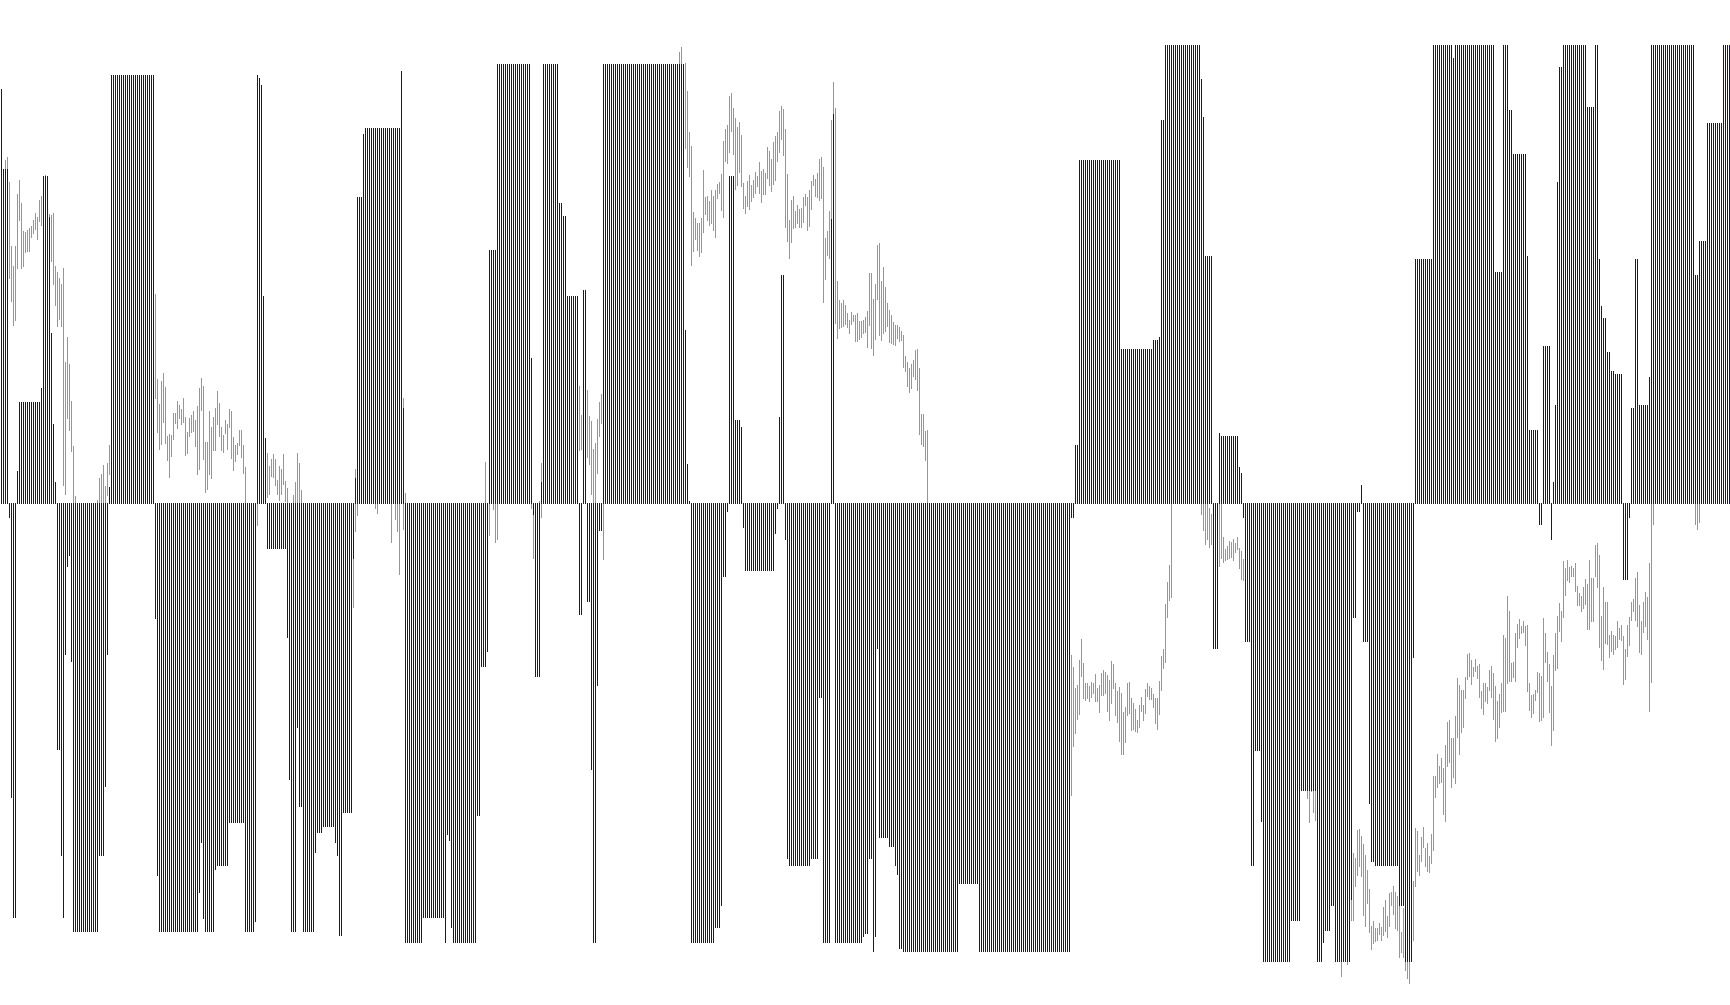
This technical script is designed to analyze market trends and momentum by calculating specific "steps" or price boundaries. Rather than just looking at where the price is currently, it evaluates the volatility of the market over a set period to create a dynamic range of movement.
How the Logic Works
1. Volatility Analysis (The Foundation) The tool begins by measuring the average price range (the distance between highs and lows) over a specific number of past bars. It gives more weight to recent data, allowing it to react quickly to current market conditions while still maintaining a sense of the broader trend. From this, it establishes three different "intensity" levels: Minimum, Medium, and Maximum.
2. Dynamic Boundary Creation Based on these intensity levels, the script identifies three sets of price boundaries. These boundaries act like invisible floor and ceiling levels that shift automatically as the market becomes more or less volatile. The script looks at whether the current price is breaking above or below these specific thresholds to determine the current trend direction (Up, Down, or Neutral).
3. Stochastic Transformation Once the trends are identified, the script converts this information into a percentage-based value (similar to a "Stochastic Oscillator"). It does this by comparing the "Minimum" trend level against a "Maximum" benchmark. This transforms raw price data into a smoother, more readable indicator that oscillates between specific boundaries.
4. Signal Generation and Momentum The core output of the script is a signal derived from the difference between these two trend lines (the Minimum and Medium levels).
- The Histogram: This visualizes the gap between the different trend intensities.
- Momentum: The script then applies a momentum calculation to this signal, which helps smooth out "noise" and highlights the strength of the movement.
5. Alert System Finally, the script includes an automated notification system. If the generated momentum signal crosses a specific pre-defined threshold (indicating a significant surge or drop in trend intensity), it triggers an alert to notify the user immediately.
Summary for the User
In simple terms, this tool filters out market noise by calculating how much "room" the price has to move based on recent volatility. It then tracks whether the price is pushing against those boundaries. When the gap between different trend intensities widens or narrows significantly, it provides a visual signal and an alert, helping you identify shifts in market momentum.
//+------------------------------------------------------------------+
//|                                              StepMA_Stoch_v1.mq4 |
//|                           Copyright © 2005, TrendLaboratory Ltd. |
//|                                       E-mail: igorad2004@list.ru |
//|           I just added alert - Kalenzo (http://www.fxservice.eu) |
//+------------------------------------------------------------------+
#property copyright "Copyright © 2005, TrendLaboratory Ltd."
#property link      "E-mail: igorad2004@list.ru"

#property indicator_separate_window
#property indicator_buffers 2
#property indicator_color1 LightGreen
#property indicator_color2 Gold
#property indicator_minimum -25
#property indicator_maximum 25

//---- input parameters
extern int PeriodWATR=10;
extern double Kwatr=1.0000;
extern int HighLow=0;

//---- indicator buffers
double LineMinBuffer[];
double LineMidBuffer[];
double stepSignalBuffer[];
double momBuffer[];
extern double alertLevel = 10;
int ab = 0;
double psb = 0;
//+------------------------------------------------------------------+
//| Custom indicator initialization function                         |
//+------------------------------------------------------------------+
  int init() {
   string short_name;
//---- indicator line
   //SetIndexStyle(0,DRAW_LINE,STYLE_SOLID, 1);
   //SetIndexStyle(1,DRAW_LINE,STYLE_SOLID, 1);
   SetIndexStyle(1,DRAW_HISTOGRAM, STYLE_SOLID, 1);
   SetIndexStyle(2,DRAW_LINE,STYLE_SOLID, 1);
   //SetIndexBuffer(0, LineMinBuffer);
   //SetIndexBuffer(1, LineMidBuffer);
   SetIndexBuffer(1, stepSignalBuffer);
   SetIndexBuffer(2, momBuffer);

   IndicatorDigits(MarketInfo(Symbol(),MODE_DIGITS));
//---- name for DataWindow and indicator subwindow label
   short_name="FLOW ("+PeriodWATR+","+Kwatr+","+HighLow+")";
   IndicatorShortName(short_name);
   //SetIndexLabel(0,"StepMA Stoch 1");
   //SetIndexLabel(1,"StepMA Stoch 2");
   SetIndexLabel(1,"StepMA Hist");
   SetIndexLabel(2,"StepMA Mom");
//----
   //SetIndexDrawBegin(0,PeriodWATR);
   //SetIndexDrawBegin(1,PeriodWATR);
   SetIndexDrawBegin(1,PeriodWATR);
   SetIndexDrawBegin(2,PeriodWATR);
//----
   return(0);
  }

//+------------------------------------------------------------------+
//| StepMA_3D_v1                                                         |
//+------------------------------------------------------------------+
int start() {
   int      i,shift,TrendMin,TrendMax,TrendMid;
   double   SminMin0,SmaxMin0,SminMin1,SmaxMin1,SumRange,dK,WATR0,WATRmax,WATRmin,WATRmid;
   double   SminMax0,SmaxMax0,SminMax1,SmaxMax1,SminMid0,SmaxMid0,SminMid1,SmaxMid1;
   double   linemin,linemax,linemid,Stoch1,Stoch2,bsmin,bsmax;

   for(shift=Bars-1;shift>=0;shift--)
   {
	SumRange=0;
	for (i=PeriodWATR-1;i>=0;i--)
	    {
       dK = 1+1.0*(PeriodWATR-i)/PeriodWATR;
       SumRange+= dK*MathAbs(High[i+shift]-Low[i+shift]);
       }
	WATR0 = SumRange/PeriodWATR;

	WATRmax=MathMax(WATR0,WATRmax);
	if (shift==Bars-1-PeriodWATR) WATRmin=WATR0;
	WATRmin=MathMin(WATR0,WATRmin);

	int StepSizeMin=MathRound(Kwatr*WATRmin/Point);
	int StepSizeMax=MathRound(Kwatr*WATRmax/Point);
	int StepSizeMid=MathRound(Kwatr*0.5*(WATRmax+WATRmin)/Point);

	if (HighLow>0) {
	  SmaxMin0=Low[shift]+2*StepSizeMin*Point;
	  SminMin0=High[shift]-2*StepSizeMin*Point;

	  SmaxMax0=Low[shift]+2*StepSizeMax*Point;
	  SminMax0=High[shift]-2*StepSizeMax*Point;

	  SmaxMid0=Low[shift]+2*StepSizeMid*Point;
	  SminMid0=High[shift]-2*StepSizeMid*Point;

	  if(Close[shift]>SmaxMin1) TrendMin=1;
	  if(Close[shift]<SminMin1) TrendMin=-1;

	  if(Close[shift]>SmaxMax1) TrendMax=1;
	  if(Close[shift]<SminMax1) TrendMax=-1;

	  if(Close[shift]>SmaxMid1) TrendMid=1;
	  if(Close[shift]<SminMid1) TrendMid=-1;
	}

	if (HighLow == 0) {
	  SmaxMin0=Close[shift]+2*StepSizeMin*Point;
	  SminMin0=Close[shift]-2*StepSizeMin*Point;

	  SmaxMax0=Close[shift]+2*StepSizeMax*Point;
	  SminMax0=Close[shift]-2*StepSizeMax*Point;

	  SmaxMid0=Close[shift]+2*StepSizeMid*Point;
	  SminMid0=Close[shift]-2*StepSizeMid*Point;

	  if(Close[shift]>SmaxMin1) TrendMin=1;
	  if(Close[shift]<SminMin1) TrendMin=-1;

	  if(Close[shift]>SmaxMax1) TrendMax=1;
	  if(Close[shift]<SminMax1) TrendMax=-1;

	  if(Close[shift]>SmaxMid1) TrendMid=1;
	  if(Close[shift]<SminMid1) TrendMid=-1;
	  }

	  if(TrendMin>0 && SminMin0<SminMin1) SminMin0=SminMin1;
	  if(TrendMin<0 && SmaxMin0>SmaxMin1) SmaxMin0=SmaxMin1;

	  if(TrendMax>0 && SminMax0<SminMax1) SminMax0=SminMax1;
	  if(TrendMax<0 && SmaxMax0>SmaxMax1) SmaxMax0=SmaxMax1;

	  if(TrendMid>0 && SminMid0<SminMid1) SminMid0=SminMid1;
	  if(TrendMid<0 && SmaxMid0>SmaxMid1) SmaxMid0=SmaxMid1;


	  if (TrendMin>0) linemin=SminMin0+StepSizeMin*Point;
	  if (TrendMin<0) linemin=SmaxMin0-StepSizeMin*Point;

	  if (TrendMax>0) linemax=SminMax0+StepSizeMax*Point;
	  if (TrendMax<0) linemax=SmaxMax0-StepSizeMax*Point;

	  if (TrendMid>0) linemid=SminMid0+StepSizeMid*Point;
	  if (TrendMid<0) linemid=SmaxMid0-StepSizeMid*Point;

	  bsmin=linemax-StepSizeMax*Point;
	  bsmax=linemax+StepSizeMax*Point;
	  Stoch1=(linemin-bsmin)/(bsmax-bsmin);
	  Stoch2=(linemid-bsmin)/(bsmax-bsmin);

	  LineMinBuffer[shift]=Stoch1;
	  LineMidBuffer[shift]=Stoch2;
	  stepSignalBuffer[shift]=(Stoch1-Stoch2)*100;
	  momBuffer[shift]= iMomentumOnArray(stepSignalBuffer, ArraySize(stepSignalBuffer), 13, 0);


	  SminMin1=SminMin0;
	  SmaxMin1=SmaxMin0;

	  SminMax1=SminMax0;
	  SmaxMax1=SmaxMax0;

	  SminMid1=SminMid0;
	  SmaxMid1=SmaxMid0;
	}

	if(Bars>ab && psb!=0 && ((stepSignalBuffer[0] >= alertLevel && psb < alertLevel) || (stepSignalBuffer[0] <= -alertLevel && psb > -alertLevel)) )
	{
      Alert(Symbol()+" M("+Period()+") Signal level touched");
      ab = Bars;
	}
   psb = stepSignalBuffer[0];

	return(0);
 }
Comments