FloatPivot
Download script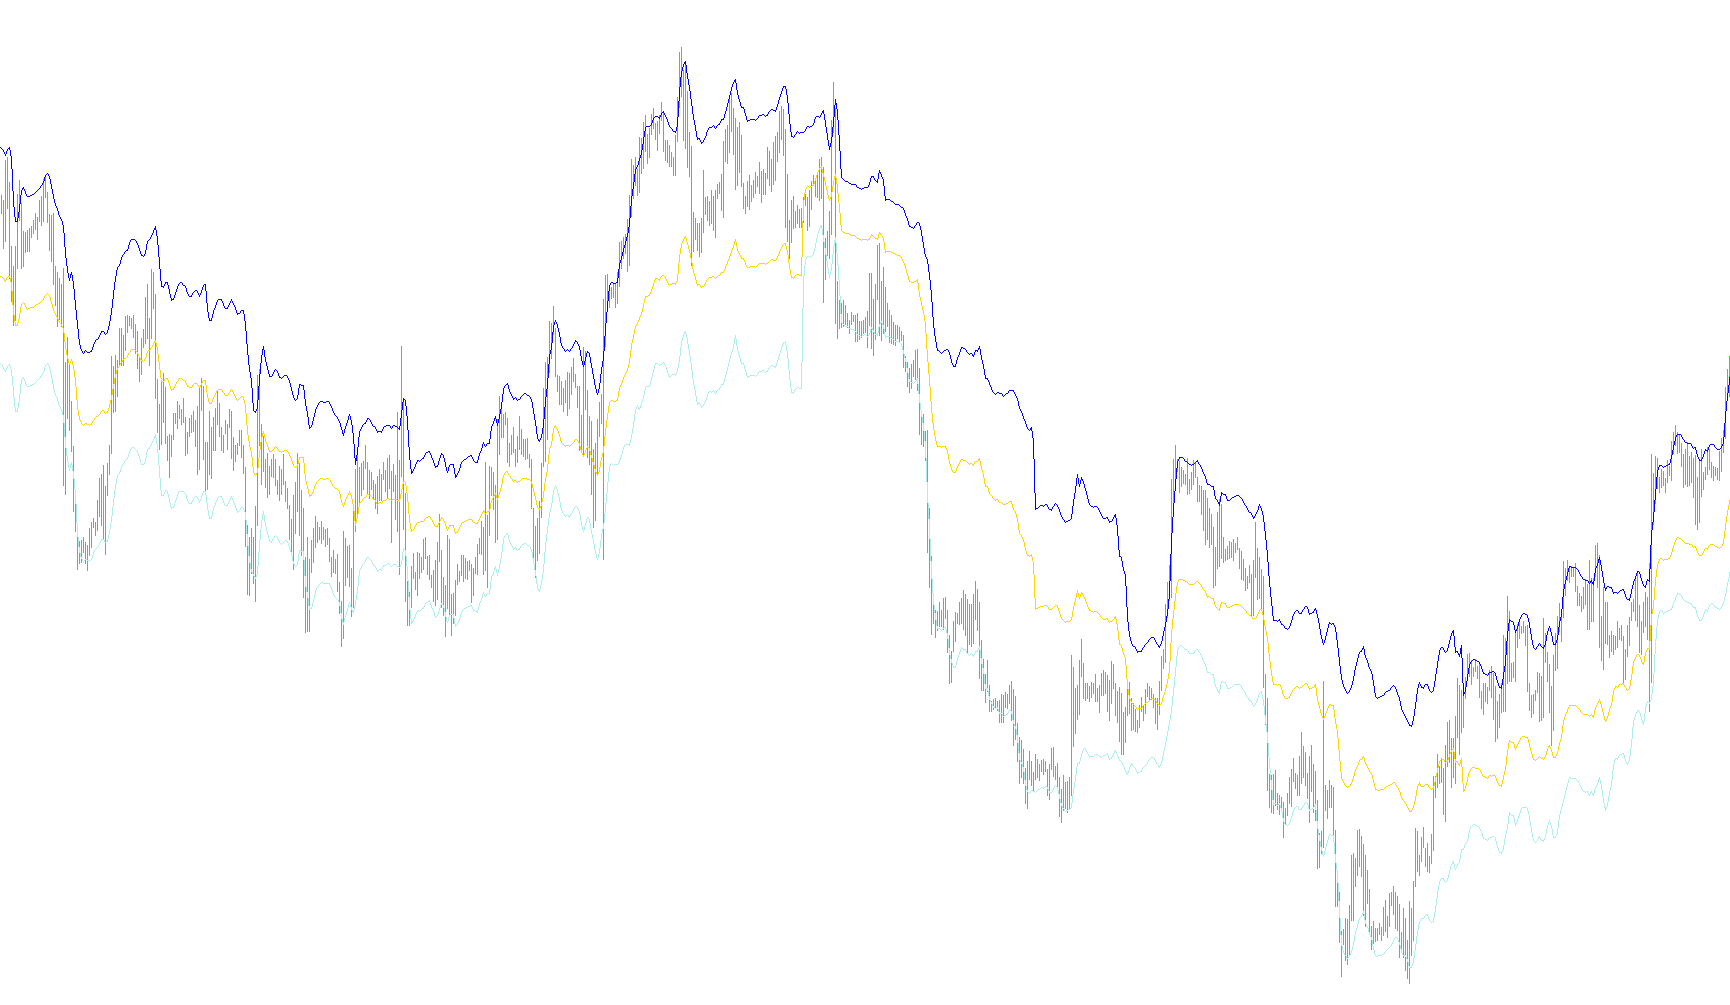
This script is designed to provide traders with a visual representation of key price levels on a trading chart by calculating "Pivot" points based on historical price action. It helps identify potential areas of support and resistance by looking at the extremes of recent price movement combined with average closing prices.
How the Logic Works
The tool functions by analyzing a specific window of past price data (defined by a user-set period) to generate three distinct lines on your chart:
1. The Primary Pivot Point To find the central "Pivot," the script looks at two types of data simultaneously:
- Price Extremes: It identifies the highest high and the lowest low reached within the chosen look-back period.
- Average Price: It calculates an average of the closing prices from three consecutive bars prior to the current one. By combining these extremes with the average price, the script establishes a "Float Pivot"—a smoothed central baseline that represents the core equilibrium of the market during that timeframe.
2. Upper and Lower Boundaries In addition to the main pivot, the script calculates two secondary levels that act as projected boundaries:
- The High Boundary (HL1): This level is calculated by weighing the relationship between the central pivot and the price extremes. It essentially projects a target area based on how far the price has stretched toward its highs relative to the pivot.
- The Low Boundary (HL2): Similarly, this level projects a support-oriented target by calculating the distance from the pivot toward the recent lows.
Visual Representation
When applied to a chart, these calculations appear as three different colored lines:
- Yellow Line: Represents the main Float Pivot (the central equilibrium).
- Red and Aqua Lines: Represent the high and low boundaries, respectively.
Summary for Traders
Instead of just showing you where the price was, this script attempts to show you where the price is centered. By observing how the current price interacts with these three lines, traders can get a better sense of whether the market is currently trading above or below its historical average range and identify potential zones where price might encounter resistance or find support.
//+------------------------------------------------------------------+
//|                                                           FP.mq4 |
//|                                 Copyright © 2006, Nick A. Zhilin |
//|                                              rebus@dialup.etr.ru |
//+------------------------------------------------------------------+
#property copyright "Copyright © 2006, Nick A. Zhilin"
#property link      "rebus@dialup.etr.ru"
//----
extern int IPeriod = 100;
//----
#property indicator_chart_window
#property indicator_buffers 3
#property indicator_color1 Yellow
#property indicator_color2 Red
#property indicator_color3 Aqua
//---- buffers
double ExtMapBuffer1[];
double ExtMapBuffer2[];
double ExtMapBuffer3[];
//+------------------------------------------------------------------+
//| Custom indicator initialization function                         |
//+------------------------------------------------------------------+
int init()
  {
   IndicatorShortName("Float Pivot");
//---- indicators
   SetIndexStyle(0, DRAW_LINE);
   SetIndexBuffer(0, ExtMapBuffer1);
   SetIndexLabel(0, "Pivot");
   SetIndexStyle(1, DRAW_LINE);
   SetIndexBuffer(1, ExtMapBuffer2);
   SetIndexLabel(1, "HL1");
   SetIndexStyle(2, DRAW_LINE);
   SetIndexBuffer(2, ExtMapBuffer3);
   SetIndexLabel(2, "HL2");
//----
   Comment("FloatPivot(" + IPeriod + ")");
//----
   return(0);
  }
int deinit()
  {
   Comment("");
//----
   return(0);
  }
//+------------------------------------------------------------------+
//| Float Pivot                                                      |
//+------------------------------------------------------------------+
int start()
  {
   int i, counted_bars = IndicatorCounted();
//----
   i = Bars - counted_bars - 1;
   while(i >= 0)
     {
       double max = High[Highest(NULL, 0, MODE_HIGH, IPeriod, i)];
       double min = Low[Lowest(NULL, 0, MODE_LOW, IPeriod, i)];
       double pivot = (Close[i+1] + Close[i+2] + Close[i+3]) / 3;
       // Pivot
       ExtMapBuffer1[i] = (max + min + pivot) / 3;
       // (R1 - Pivot) / 2
       ExtMapBuffer2[i] = ((2*(max + min + pivot) / 3 - min) +
                           (max+min+pivot) / 3) / 2;
       // (Pivot - S1) / 2
       ExtMapBuffer3[i] = ((max + min + pivot) / 3 +
                           (2*(max + min + pivot) / 3 - max)) / 2;
       i--;
     }
//----
   return(0);
  }
//+------------------------------------------------------------------+
Comments