ForecastOscillator_v1
Download script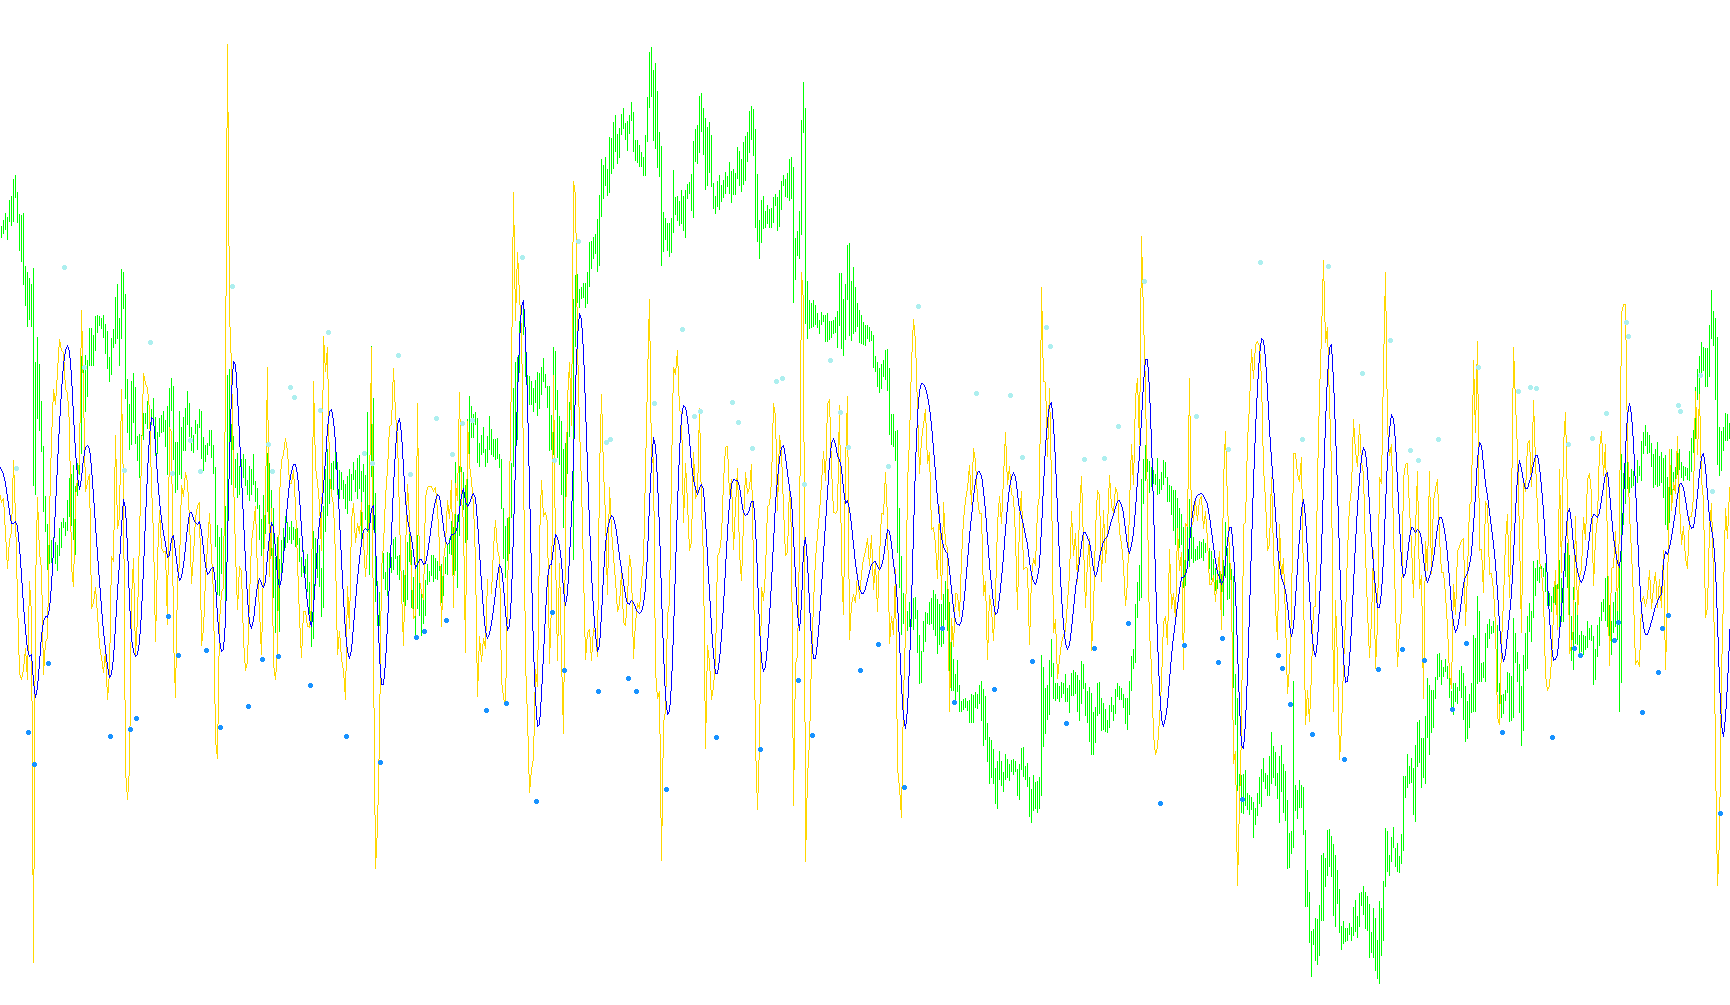
The Forecast Oscillator is a technical analysis tool designed to help traders visualize price momentum and identify potential trend reversals by analyzing the relationship between current market prices and historical weighted trends. Unlike standard indicators that simply react to past price action, this script utilizes advanced mathematical modeling to project a "forecast" of where the price intends to go based on its recent trajectory.
Core Analytical Logic
The tool functions through a multi-layered calculation process:
1. Weighted Trend Analysis (WT) The indicator begins by calculating a weighted trend. Rather than treating all historical data equally, it applies a regression-based weighting system. This ensures that the most relevant price points from the recent past have a significant influence on the current "Weighted Trend" value. By establishing this baseline, the tool creates a stable reference point for what the "normal" market movement looks like.
2. The Forecast Oscillator Calculation Once the weighted trend is established, the script calculates the Forecast Oscillator. This is achieved by measuring the percentage difference between the current closing price and the weighted trend. Essentially, it quantifies how far the current price has strayed from its expected path. If the market is moving significantly faster or slower than the underlying trend suggests, this oscillator will reflect that deviation.
3. Triple Smoothing (T3) Filtering To remove "market noise"—the small, erratic price fluctuations that can lead to false signals—the script passes the forecast data through a T3 smoothing algorithm. This is a sophisticated filtering technique that seeks to maintain the integrity of the trend's shape while eliminating jagged movements. The result is a much smoother, more reliable line that represents the "true" momentum of the market.
Visual Signals and Interpretation
The script translates these complex calculations into visual cues on the chart:
- Trend Lines: It plots two main lines representing the raw forecast and the smoothed trend. Traders look for the interaction between these lines to gauge whether momentum is accelerating or decelerating.
- Automated Signal Arrows: The logic includes a specific set of conditions to identify potential turning points. By comparing the relationship between the current oscillator values and their previous positions, the script identifies moments where the price momentum has shifted significantly enough to suggest a change in direction.
- When certain downward pressure conditions are met, it places a "Low Signal" marker.
- When specific upward momentum shifts occur, it places a "High Signal" marker.
Summary for the User
In practical terms, this tool helps you see beyond the current candle. It tells you: "Based on the recent weighted history, how far has the price pushed away from its average path, and is that push starting to exhaust itself?" It provides a filtered look at market energy, aiming to highlight high-probability reversal zones before they become obvious to the naked eye.
/*-----------------------------+
|			       |
| Shared by www.Aptrafx.com    |
|			       |
+------------------------------*/

//+------------------------------------------------------------------+
//|                                          Forecast Oscillator.mq4 |
//|                Copyright © 2005, Nick Bilak, beluck[AT]gmail.com |
//|                                    http://forexsystems.ru/phpBB/ |
//+------------------------------------------------------------------+
#property copyright "Copyright © 2005, Nick Bilak, beluck[AT]gmail.com"
#property link      "http://forexsystems.ru/phpBB/index.php"

#property indicator_separate_window
#property indicator_buffers 4
#property indicator_level1 0
#property indicator_color1 DarkTurquoise
#property indicator_color2 LawnGreen
#property indicator_color3 Magenta
#property indicator_color4 Aqua
//---- input parameters
extern int       regress=15;
extern int       t3=10;
extern double    b=0.7;
//---- buffers
double osc[];
double osct3[];
double hiSig[];
double loSig[];

int shift,limit,length;
double b2,b3,c1,c2,c3,c4,w1,w2,n,WT,forecastosc,t3_fosc,sum,e1,e2,e3,e4,e5,e6,tmp,tmp2;

//+------------------------------------------------------------------+
//| Custom indicator initialization function                         |
//+------------------------------------------------------------------+
int init()
  {
//---- indicators
   SetIndexStyle(0,DRAW_LINE);
   SetIndexBuffer(0,osc);
   SetIndexEmptyValue(0,0);
   SetIndexStyle(1,DRAW_LINE);
   SetIndexBuffer(1,osct3);

   SetIndexStyle(2,DRAW_ARROW);
   SetIndexBuffer(2,hiSig);
   SetIndexEmptyValue(2,EMPTY_VALUE);
   SetIndexArrow(2,159);
   SetIndexStyle(3,DRAW_ARROW);
   SetIndexBuffer(3,loSig);
   SetIndexEmptyValue(3,EMPTY_VALUE);
   SetIndexArrow(3,159);
//----
   return(0);
  }
//+------------------------------------------------------------------+
//| Custor indicator deinitialization function                       |
//+------------------------------------------------------------------+
int deinit()
  {
   return(0);
  }
//+------------------------------------------------------------------+
//| Custom indicator iteration function                              |
//+------------------------------------------------------------------+
int start()
  {
   int counted_bars=IndicatorCounted();

   if (counted_bars<0) return(-1);
   if (counted_bars>0) counted_bars--;
   limit=Bars-31;
   if(counted_bars>=31) limit=Bars-counted_bars+2;

   for (shift=limit+30;shift>=0;shift--)   {

      b2=b*b;
      b3=b2*b;
      c1=-b3;
      c2=(3*(b2+b3));
      c3=-3*(2*b2+b+b3);
      c4=(1+3*b+b3+3*b2);
      n=t3;

      if (n<1) n=1;
      n = 1 + 0.5*(n-1);
      w1 = 2 / (n + 1);
      w2 = 1 - w1;

      length=regress;
      sum = 0;
      for (int i = length; i>0; i--) {
         tmp = length+1;
         tmp = tmp/3;
         tmp2 = i;
         tmp = tmp2 - tmp;
         sum = sum + tmp*Close[shift+length-i];
      }
      tmp = length;
      WT = sum*6/(tmp*(tmp+1));

      forecastosc=(Close[shift]-WT)/WT*100;

      e1 = w1*forecastosc + w2*e1;
      e2 = w1*e1 + w2*e2;
      e3 = w1*e2 + w2*e3;
      e4 = w1*e3 + w2*e4;
      e5 = w1*e4 + w2*e5;
      e6 = w1*e5 + w2*e6;

      t3_fosc = c1*e6 + c2*e5 + c3*e4 + c4*e3;

      osc[shift] = forecastosc;
      osct3[shift] = t3_fosc;

      if (osc[shift+1] > osct3[shift+2] && osc[shift+2] <= osct3[shift+3] && osct3[shift+1]<0) loSig[shift+1] = t3_fosc-0.05;
      if (osc[shift+1] < osct3[shift+2] && osc[shift+2] >= osct3[shift+3] && osct3[shift+1]>0) hiSig[shift+1] = t3_fosc+0.05;

   }
   Comment("WT=",WT);
   return(0);
  }
//+------------------------------------------------------------------+
Comments