Floor_Pivots_Weekly
Download script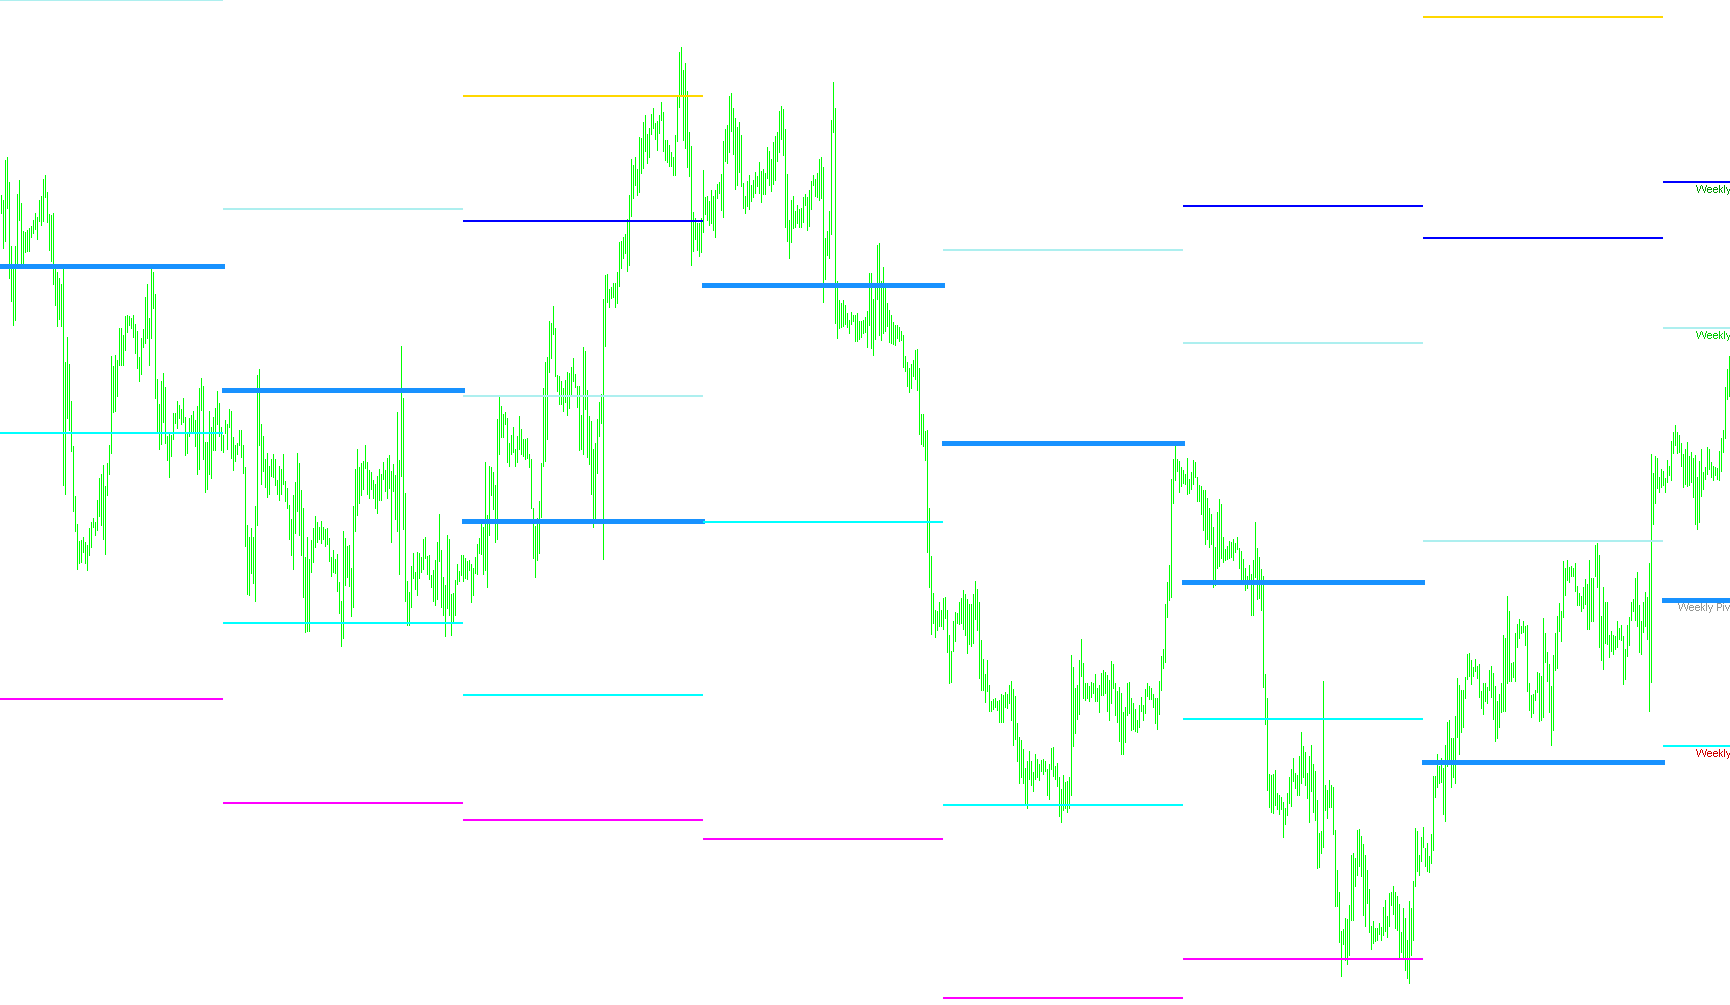
This script is designed to provide traders with a visual roadmap of price action by identifying key support and resistance levels based on weekly data. It automatically calculates and plots "Floor Pivot" levels, which are specific price points used to gauge market sentiment and potential turning points throughout the trading week.
How the Logic Works
The core objective of this script is to analyze the price movement of the previous week to predict where the market might find stability or face resistance in the current week. Here is a breakdown of the process:
1. Data Collection The script scans historical price data to identify three primary values from the completed preceding week:
- The highest price reached (High).
- The lowest price reached (Low).
- The final closing price (Close).
2. The Pivot Point Calculation Once it identifies these three values, the script calculates the "Weekly Pivot Point" (PP). This is essentially the mathematical average of the previous week's high, low, and close. This point serves as the "center of gravity" for the current week’s price action.
3. Support and Resistance Mapping Using the Pivot Point as a baseline, the script generates several additional levels:
- Resistance Levels (R1, R2, R3): These represent "ceilings." They are calculated based on the distance between the pivot point and the previous week's extremes. Traders often watch these levels to see if the price will struggle to break upward.
- Support Levels (S1, S2, S3): These represent "floors." These are calculated symmetrically to the resistance levels. They indicate areas where buying interest might increase or where a falling price might find a base to bounce back up.
4. Dynamic Visual Updates The script is designed to be interactive and easy to read:
- Automatic Refresh: It automatically detects the start of a new week (Monday) and recalculates all levels based on the updated data from the week that just ended.
- Visual Labeling: Rather than just showing lines, the script places clear text labels (e.g., "Weekly R1," "Weekly S2") directly on the chart. This allows for immediate identification of which level is being displayed.
- Dynamic Positioning: As new price candles form during the week, the script ensures that the labels and indicators move accurately to stay aligned with the current market price, providing a real-time visual guide for the trader.
Summary for the User
Essentially, this tool removes the manual math from your trading routine. By looking at the chart, you can immediately see where the "floor" and "ceiling" are for the week based on historical behavior. It helps you identify zones where the market is likely to react, pause, or reverse, allowing for more structured decision-making during live trading sessions.
//+------------------------------------------------------------------+
//|                                          Floor_Pivots_Weekly.mq4 |
//|                         Copyright © 2009, kris.pivo[at]gmail.com |
//+------------------------------------------------------------------+
#property copyright "© Kris, 2009"                                 //|
//+------------------------------------------------------------------+
#property indicator_chart_window
#property indicator_buffers 7
#property indicator_color1 C'000,100,000' // SeaGreen
#property indicator_color2 C'000,150,000' // Green
#property indicator_color3 C'000,200,000' // Lime
#property indicator_color4 C'150,150,150' // Silver
#property indicator_color5 C'200,000,000' // Red
#property indicator_color6 C'150,000,000' // Crimson
#property indicator_color7 C'100,000,000' // Maroon
//---- input parameters
int fontsize=8;
//---- buffers
double BufferR3[];
double BufferR2[];
double BufferR1[];
double BufferPP[];
double BufferS1[];
double BufferS2[];
double BufferS3[];

double WH,WL,WC,PP,PD,PRH,PRL;
double S1,R1,S2,R2,S3,R3;
double last_week_high, last_week_low, last_week_close, this_week_open;
//+------------------------------------------------------------------+

int deinit() {
   ObjectDelete("PivR3");
   ObjectDelete("PivR2");
   ObjectDelete("PivR1");
   ObjectDelete("PivPP");
   ObjectDelete("PivS1");
   ObjectDelete("PivS2");
   ObjectDelete("PivS3");

	ObjectDelete("LabPivR3");
	ObjectDelete("LabPivR2");
	ObjectDelete("LabPivR1");
	ObjectDelete("LabPivPP");
	ObjectDelete("LabPivS1");
	ObjectDelete("LabPivS2");
	ObjectDelete("LabPivS3");

	Comment("");
	return(0); }
//+------------------------------------------------------------------+

int init()
  {
   string short_name;

   SetIndexStyle(0,DRAW_ARROW);
   SetIndexArrow(0,160);
   SetIndexBuffer(0,BufferR3);

   SetIndexStyle(1,DRAW_ARROW);
   SetIndexArrow(1,160);
   SetIndexBuffer(1,BufferR2);

   SetIndexStyle(2,DRAW_ARROW);
   SetIndexArrow(2,160);
   SetIndexBuffer(2,BufferR1);

   SetIndexStyle(3,DRAW_ARROW);
   SetIndexArrow(3,167);
   SetIndexBuffer(3,BufferPP);

   SetIndexStyle(4,DRAW_ARROW);
   SetIndexArrow(4,160);
   SetIndexBuffer(4,BufferS1);

   SetIndexStyle(5,DRAW_ARROW);
   SetIndexArrow(5,160);
   SetIndexBuffer(5,BufferS2);

   SetIndexStyle(6,DRAW_ARROW);
   SetIndexArrow(6,160);
   SetIndexBuffer(6,BufferS3);

   short_name="Floor Pivots Weekly";
   IndicatorShortName(short_name);
   SetIndexLabel(0,short_name);
   SetIndexDrawBegin(0,1);
   return(0);  }

int start()
  {
   int counted_bars=IndicatorCounted();
   int limit, i;
   if (counted_bars==0)
     {
      ObjectCreate("PivR3", OBJ_TEXT, 0,0,0);
      ObjectSetText("PivR3", "                                      Weekly R3",fontsize,"Arial",indicator_color1);
      ObjectCreate("PivR2", OBJ_TEXT, 0,0,0);
      ObjectSetText("PivR2", "                                      Weekly R2",fontsize,"Arial",indicator_color2);
      ObjectCreate("PivR1", OBJ_TEXT, 0,0,0);
      ObjectSetText("PivR1", "                                      Weekly R1",fontsize,"Arial",indicator_color3);
      ObjectCreate("PivPP", OBJ_TEXT, 0,0,0);
      ObjectSetText("PivPP", "                                      Weekly Pivot Point",fontsize,"Arial",indicator_color4);
      ObjectCreate("PivS1", OBJ_TEXT, 0,0,0);
      ObjectSetText("PivS1", "                                      Weekly S1",fontsize,"Arial",indicator_color5);
      ObjectCreate("PivS2", OBJ_TEXT, 0,0,0);
      ObjectSetText("PivS2", "                                      Weekly S2",fontsize,"Arial",indicator_color6);
      ObjectCreate("PivS3", OBJ_TEXT, 0,0,0);
      ObjectSetText("PivS3", "                                      Weekly S3",fontsize,"Arial",indicator_color7);
     }
   if(counted_bars<0) return(-1);
//----
   limit=(Bars-counted_bars)-1;
//----
   for(i=limit; i>=0;i--)
     {
      // Monday
      if(1==TimeDayOfWeek(Time[i]) && 1!=TimeDayOfWeek(Time[i+1]) )  // 0=Sunday, 1=Monday, ...
        {
         last_week_close=Close[i+1];
         this_week_open=Open[i];

         WH = last_week_high;
         WL = last_week_low;
         WC = last_week_close;

         PP = (WH + WL + WC)/3;
         PD = MathAbs(((WH + WL)/2) - PP);
         PRH = PP + PD;
         PRL = PP - PD;

			R1 = (2*PP)- WL;
			S1 = (2*PP)- WH;
			R2 = PP+(R1-S1);
			S2 = PP-(R1-S1);
			R3 = (WH + (2*(PP-WL)));
			S3 = (WL - (2*(WH-PP)));

         last_week_low  = Low[i];
         last_week_high = High[i];
//----
         ObjectMove("PivR3", 0, Time[i],R3);
         ObjectMove("PivR2", 0, Time[i],R2);
         ObjectMove("PivR1", 0, Time[i],R1);
         ObjectMove("PivPP", 0, Time[i],PP);
         ObjectMove("PivS1", 0, Time[i],S1);
         ObjectMove("PivS2", 0, Time[i],S2);
         ObjectMove("PivS3", 0, Time[i],S3);
        }
      last_week_high=MathMax(last_week_high, High[i]);
      last_week_low=MathMin(last_week_low, Low[i]);

      BufferR3[i]=R3;
      BufferR2[i]=R2;
      BufferR1[i]=R1;
      BufferPP[i]=PP;
      BufferS1[i]=S1;
      BufferS2[i]=S2;
      BufferS3[i]=S3;

   DoLabel( "LabPivR3", BufferR3[0], indicator_color1 );
   DoLabel( "LabPivR2", BufferR2[0], indicator_color2 );
   DoLabel( "LabPivR1", BufferR1[0], indicator_color3 );
   DoLabel( "LabPivPP", BufferPP[0], indicator_color4 );
   DoLabel( "LabPivS1", BufferS1[0], indicator_color5 );
   DoLabel( "LabPivS2", BufferS2[0], indicator_color6 );
   DoLabel( "LabPivS3", BufferS3[0], indicator_color7 );
	}
	return(0); }

void DoLabel( string dName, double dValue, color dColor )
   {
   if (ObjectFind(dName) != 0)
      {
      ObjectCreate(dName,OBJ_ARROW,0,Time[0],dValue);
      ObjectSet(dName,OBJPROP_ARROWCODE,SYMBOL_RIGHTPRICE);
      ObjectSet(dName,OBJPROP_COLOR,dColor);
      }
   else
      {
      ObjectMove(dName,0,Time[0],dValue);
      }
   }
//+-----------------------------------------------------------------------------------------+
//|                                         THE END                                         |
//+-----------------------------------------------------------------------------------------+
Comments